. 2015 Oct 9;290(41):24816-34.
doi: 10.1074/jbc.M115.678367. Epub 2015 Aug 25.

Hsp31 Is a Stress Response Chaperone That Intervenes in the Protein Misfolding Process

Affiliations

Hsp31 Is a Stress Response Chaperone That Intervenes in the Protein Misfolding Process

Chai-Jui Tsai et al. J Biol Chem. .

Abstract

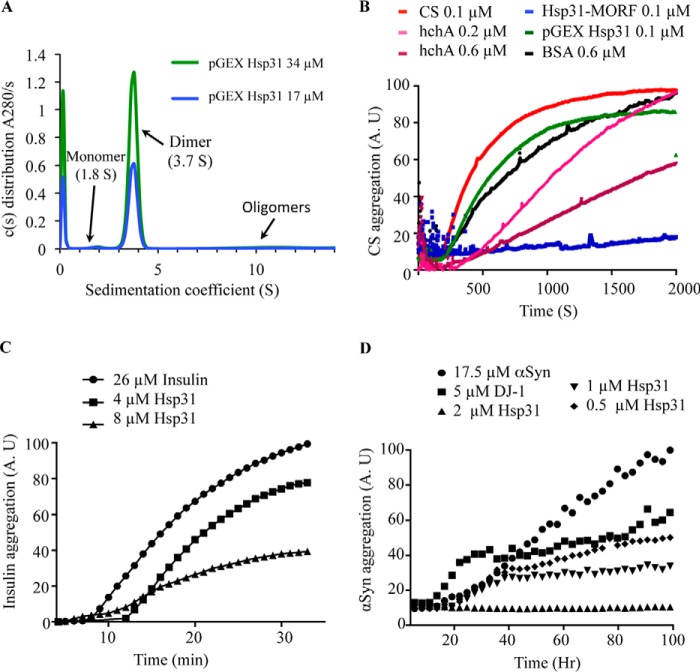
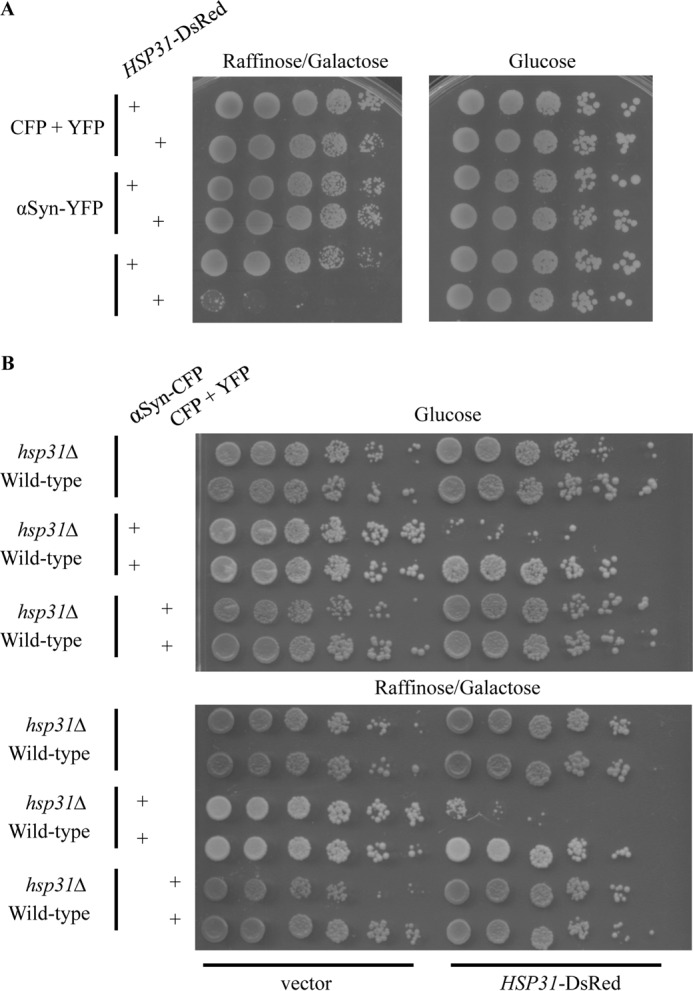
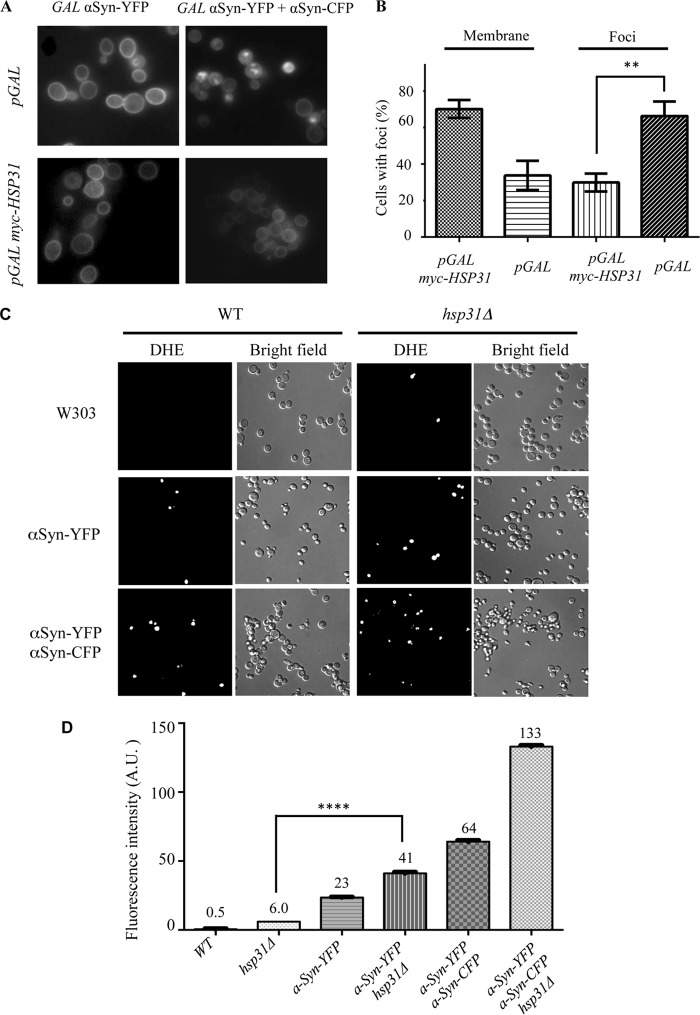
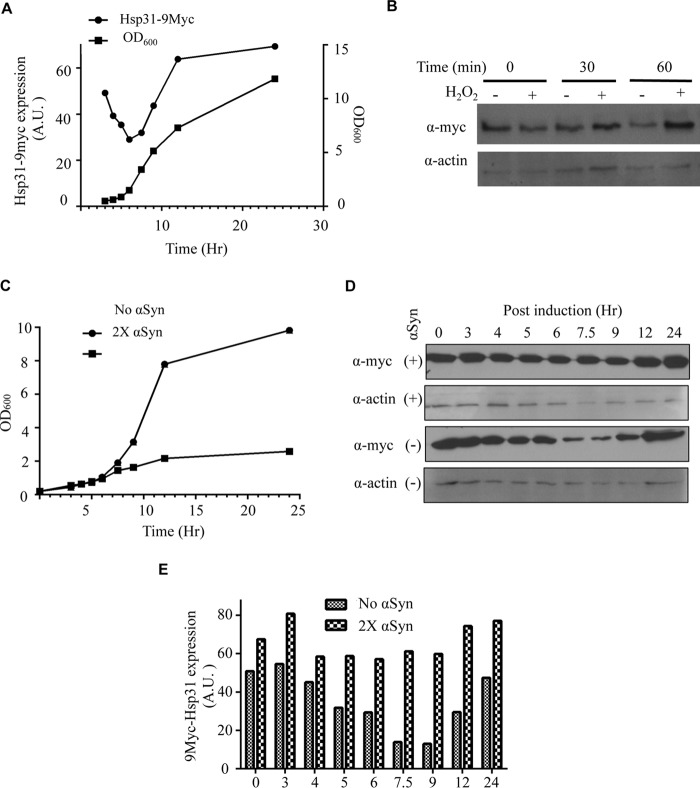
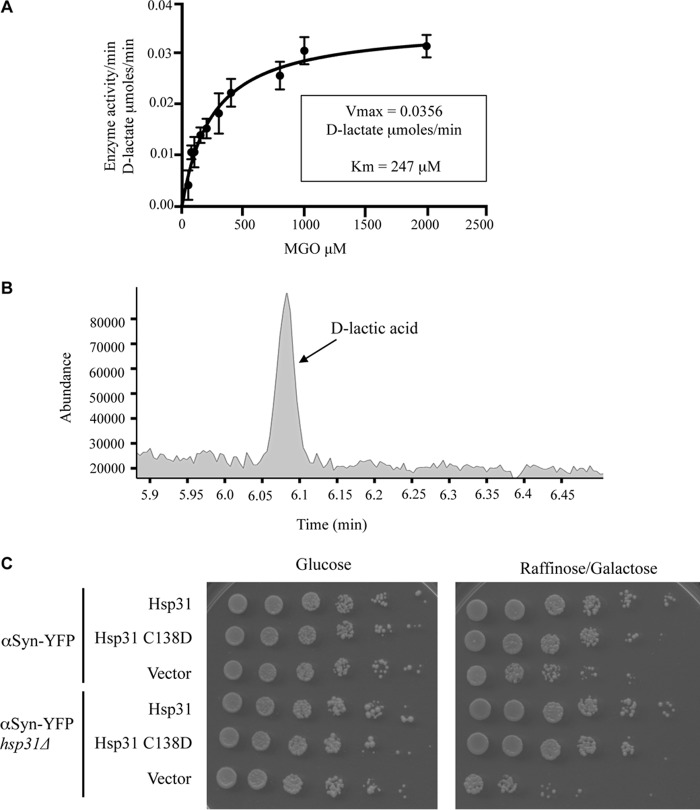
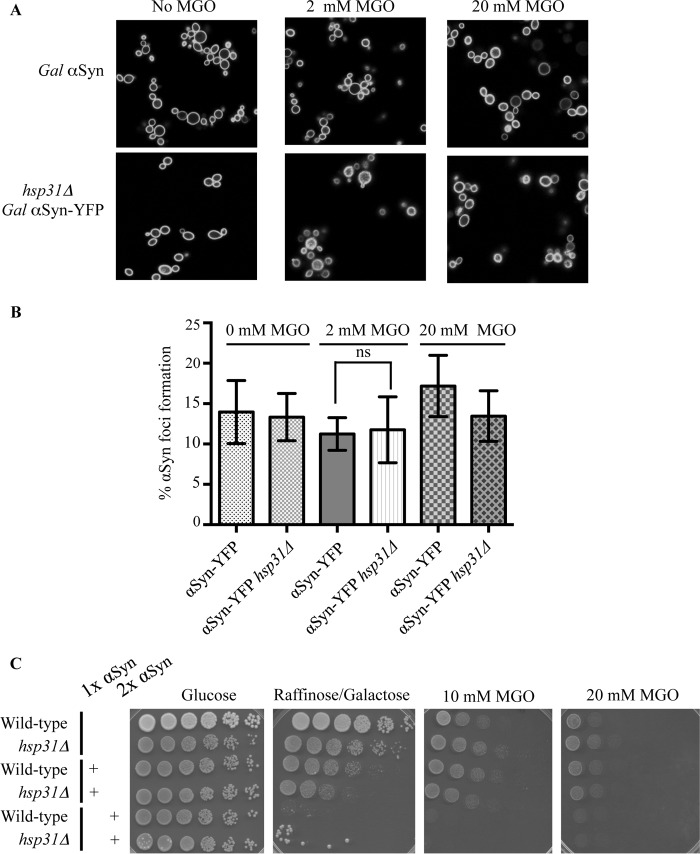
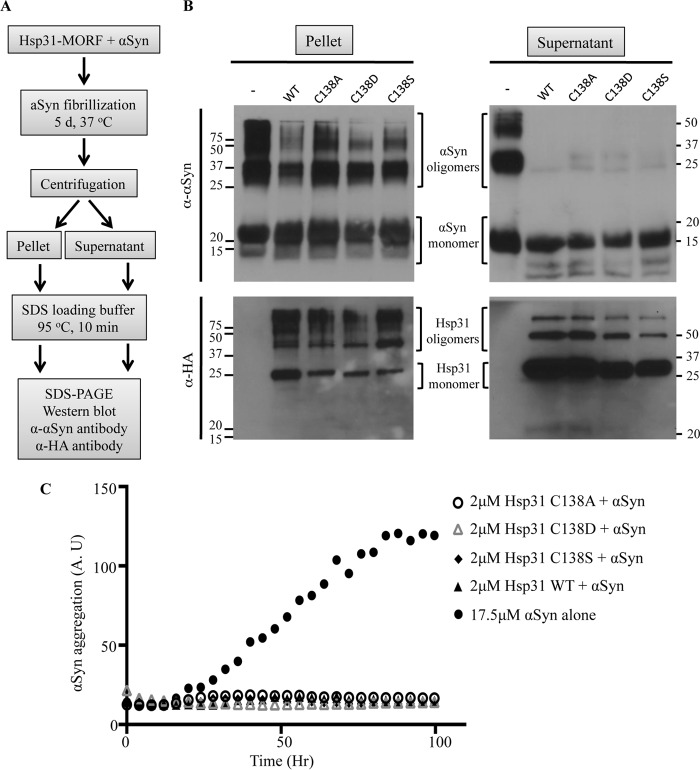
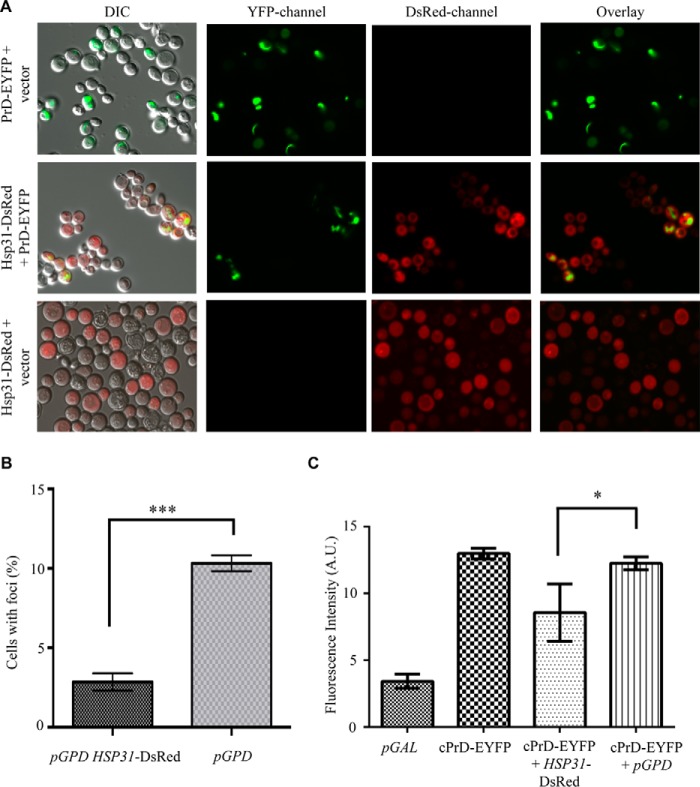
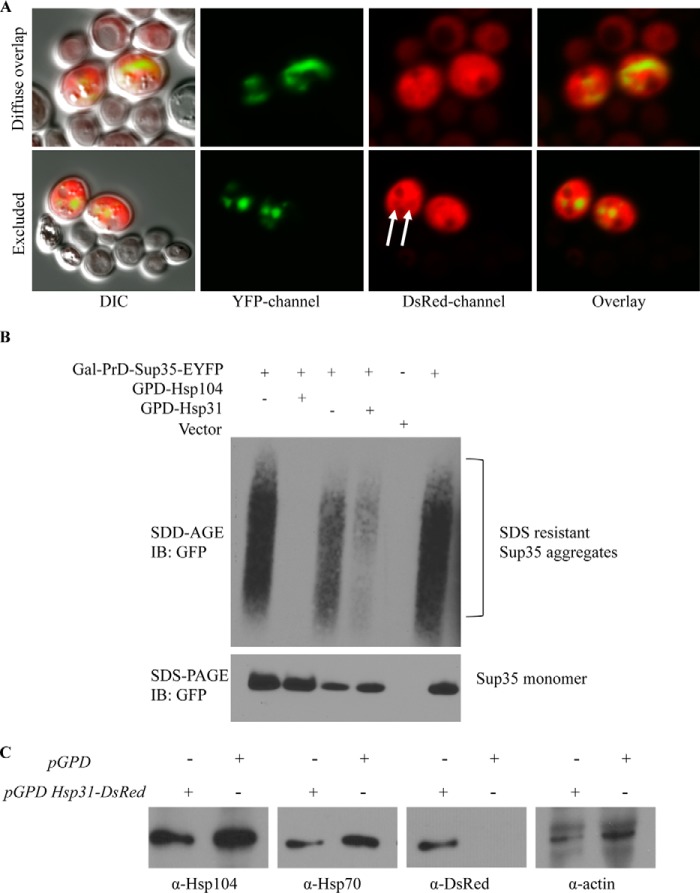
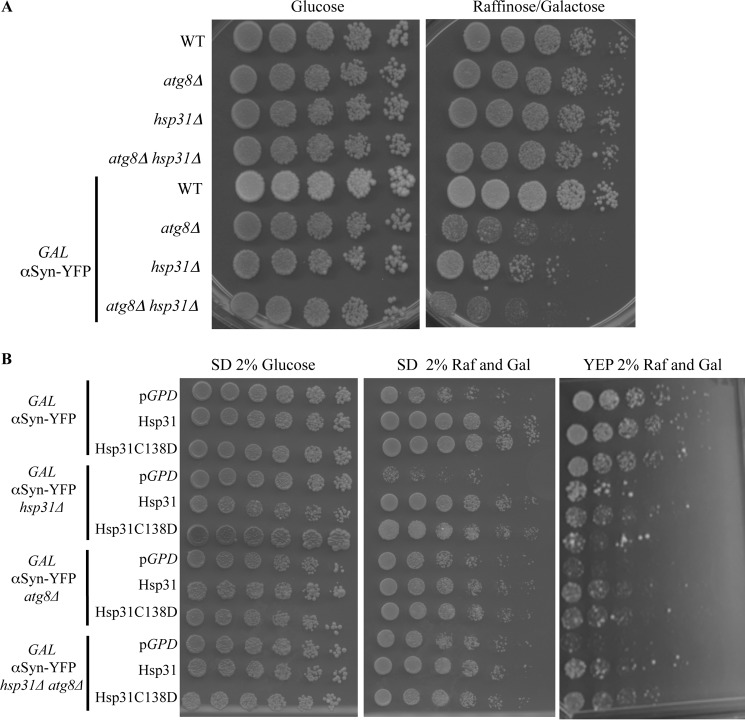
The Saccharomyces cerevisiae heat shock protein Hsp31 is a stress-inducible homodimeric protein that is involved in diauxic shift reprogramming and has glyoxalase activity. We show that substoichiometric concentrations of Hsp31 can abrogate aggregation of a broad array of substrates in vitro. Hsp31 also modulates the aggregation of α-synuclein (αSyn), a target of the chaperone activity of human DJ-1, an Hsp31 homolog. We demonstrate that Hsp31 is able to suppress the in vitro fibrillization or aggregation of αSyn, citrate synthase and insulin. Chaperone activity was also observed in vivo because constitutive overexpression of Hsp31 reduced the incidence of αSyn cytoplasmic foci, and yeast cells were rescued from αSyn-generated proteotoxicity upon Hsp31 overexpression. Moreover, we showed that Hsp31 protein levels are increased by H2O2, in the diauxic phase of normal growth conditions, and in cells under αSyn-mediated proteotoxic stress. We show that Hsp31 chaperone activity and not the methylglyoxalase activity or the autophagy pathway drives the protective effects. We also demonstrate reduced aggregation of the Sup35 prion domain, PrD-Sup35, as visualized by fluorescent protein fusions. In addition, Hsp31 acts on its substrates prior to the formation of large aggregates because Hsp31 does not mutually localize with prion aggregates, and it prevents the formation of detectable in vitro αSyn fibrils. These studies establish that the protective role of Hsp31 against cellular stress is achieved by chaperone activity that intervenes early in the protein misfolding process and is effective on a wide spectrum of substrate proteins, including αSyn and prion proteins.

Keywords: Parkinson disease; alpha-synuclein; enzyme; molecular chaperone; multifunctional protein; prion; protein misfolding; small heat shock protein (sHsp); stress response; yeast.


Figures

FIGURE 1.
FIGURE 1.
Hsp31 inhibits in vitro protein aggregation of a variety of substrates. A, the predominant form of Hsp31 is a homodimer in solution. Hsp31 was purified from the pGEX E. coli expression plasmid, and the GST tag was proteolytically removed. Sedimentation velocity was performed, and the c(s) distribution plot demonstrated that the majority species at 3.7 S is a dimeric protein. B, Hsp31 inhibited CS aggregation. CS at 0.1 μm reached a maximum aggregation (100%) after 30 min of incubation at 43 °C (red). The presence of Hsp31 purified using the MORF yeast expression plasmid suppressed CS aggregation (blue), but recombinant Hsp31, purified from the pGEX E. coli expression plasmid (green) with the GST tag removed, had a reduced effect. E. coli hchA was used as a positive control (0.2 μm (pink) and 0.6 μm (purple)) and had less anti-aggregation effect when compared with Hsp31-MORF. BSA, a negative control, had a slight anti-aggregation effect but was used at higher protein concentrations (black). Each curve is the average of three independent experiments. C, Hsp31 suppressed aggregation of insulin induced by reducing agent. The amount of 26 μm insulin aggregation after a 30-min incubation with 20 mm DTT was used to set the 100% aggregation arbitrary units (A.U.) (●). The presence of Hsp31 suppressed insulin aggregation (4 μm (■) and 8 μm (▴)). D, Hsp31 suppressed αSyn fibrillization. αSyn alone (●) was considered to be 100% aggregated after 100 h of incubation. Inhibition of αSyn fibrillization by Hsp31 was dose-dependent (2 μm (▴), 1 μm (▾), and 0.5 μm (♦)). DJ-1 (5 μm) (■) was used as the positive control in the assay. These data are representative of more than five independent experiments with all experiments demonstrating similar trends.
FIGURE 2.
FIGURE 2.
Hsp31 rescues cells from αSyn mediated toxicity. A, Hsp31 co-expression in yeast reduced αSyn toxicity. A yeast strain containing one or two copies of genomically expressed GAL-αSyn was used in a growth dilution assay, in the presence of pGPD-HSP31-DsRed or empty vector, in media containing galactose/raffinose (left) or glucose (right). The strain harboring two copies of the αSyn gene had better fitness when transformed with the Hsp31-encoding construct compared with the empty vector. B, combination of hsp31Δ with single copy αSyn expression is toxic for yeast. The expression of a single copy of αSyn in hsp31Δ strain reduced cellular fitness in the presence of glucose (top) and raffinose/galactose (bottom). The overexpression of Hsp31 in the same strain was able to rescue viability on both types of media.
FIGURE 3.
FIGURE 3.
Hsp31 alters the subcellular localization of αSyn and decreases ROS generated by αSyn. A, single copy of CFP-tagged αSyn localized mainly to plasma membrane (top left). Cytoplasmic foci predominate when two copies of αSyn are expressed (top right). Co-expression of pGAL-HSP31 with GAL-αSyn did not change the localization of αSyn when one copy of the gene was expressed (bottom left) but significantly reduced foci formation when two copies of αSyn were expressed (bottom right). B, quantification of microscopic images demonstrates that Hsp31 alters the subcellular localization of αSyn. The percentage of cells with αSyn localizing to the membrane when Hsp31 is present is greater in αSyn-expressing cells transformed with the Hsp31-encoding construct versus the control vector. This experiment was done at 8 h postinduction, and cells with one or more foci were counted in a blinded manner (n ≥ 100 cells/sample; **, p ≤ 0.01 determined by t test; p = 0.0013). The column bars represent the means of the three independent biological replicates. Error bars, S.D. C, superoxide ions increase when HSP31 is deleted and when αSyn is expressed. The in vivo presence of superoxide ions was detected by treatment with dihydroethidium and visualization by fluorescence microscopy. Representative fields of view are presented. D, quantification of superoxide ion increase in hsp31Δ- and GAL-αSyn-expressing strains. Flow cytometry was performed on three biological replicates. ****, p ≤ 0.0001 based on one-way analysis of variance with multiple comparison t test. A.U., arbitrary units. Error bars, S.D.
FIGURE 4.
FIGURE 4.
Hsp31 expression increases at early stationary phase, under oxidizing conditions, and with αSyn expression. A, Hsp31 reached maximal expression at early stationary phase. Cell growth curves are represented by A600 values (■). Cells were normalized to A600 = 0.2 at the start, and aliquots were collected until stationary phase was reached ∼12 h postinoculation and at 24 h when the culture was saturated. The expression of genomically tagged Hsp31-9myc expression was assessed via immunoblot analysis of cell lysates obtained at corresponding time points. The plot shows expression levels normalized to β-actin levels (●). B, H2O2 treatment increases the expression of Hsp31. The Hsp31–9myc strain was exposed to 1 mm H2O2 treatment for 30 and 60 min, and increased Hsp31 expression was determined by immunoblot. Samples were normalized for cellular density by A600, and β-actin was used as a loading control. These data are representative of three independent experiments. C, growth curves showing the inhibitory effect of GAL-αSyn expression in yeast harboring two copies of αSyn. Cells were normalized to A600 = 0.2 at hour 0, representing the time of inoculation, and the OD was monitored for 24 h at the identical time points used in A. Cells containing two copies of genomically integrated αSyn (■) grew more slowly 9 h after inoculation compared with the same strain without αSyn (●). D, Hsp31–9myc expression increased in the presence of induced GAL-αSyn. The immunoblot was probed with anti-Myc and anti-β-actin antibodies. The level of Hsp31 at the 7.5 and 9 h time points did not decrease in the 2xαSyn strain compared with the strain that did not express αSyn. E, quantitation of Hsp31 expression level reveals increased expression during log phase. The Hsp31–9myc-tagged cells with and without two copies of αSyn were harvested at 0, 3, 4, 5, 6, 7.5, 9, 12, and 24 h after inoculation. The levels of Hsp31 expression were quantified and normalized to the β-actin signal. Three independent experiments were performed, and all experiments resulted in similar trends as observed here. A.U., arbitrary units.
FIGURE 5.
FIGURE 5.
Hsp31 is a methylglyoxalase that produces d-lactic acid, and the enzyme activity is not necessary for rescuing αSyn toxicity. A, the plot of substrate concentration versus rate of d-lactate production by Hsp31 is depicted, and the Michaelis-Menten best fit model is represented by the solid line; Vmax and Km were determined based on this model. Mean values of triplicate experiments are plotted. Error bars, S.D. B, GC-MS trace demonstrates a peak (6.09 min) consistent with the production of d-lactic acid by Hsp31 in the enzymatic reaction. C, overexpression of pGPD HSP31 or the C138D mutant rescues toxicity from αSyn-expressing strains.
FIGURE 6.
FIGURE 6.
MGO does not increase αSyn foci or toxicity. A, representative fluorescence microscopy images of αSyn-expressing cells treated with 2 and 20 mm MGO. B, the level of αSyn foci does not increase with MGO treatment. Percentage of cells with αSyn foci formation was quantified for the two strains (αSyn-YFP and αSyn-YFP/Hsp31Δ) in the presence of 2 and 20 mm MGO. Cells in three or more fields of view were counted, and the mean values were plotted (error bars, S.D.). Ns, one-way analysis of variance with multiple comparison t test indicates no significant difference. C, MGO treatment does not differentially increase toxicity of αSyn-expressing strains compared with non-expressing counterparts. Strains were serially diluted on agar plates containing 10 and 20 mm MGO. A.U., arbitrary units.
FIGURE 7.
FIGURE 7.
Hsp31 and catalytic mutants prevent the formation of αSyn oligomers. A, flow chart depicting the fractionation of the αSyn fibrillization assay and detection of monomeric and oligomeric species. SDS-PAGE of the pellet and supernatant fractions was performed, and antibodies were used to detect αSyn followed by stripping of the membrane and reprobing with anti-HA tag antibody to detect Hsp31 (note that Hsp31 was purified using the MORF tag, but Protein A was removed proteolytically, and the HA tag is retained). B, Hsp31 suppresses the formation of SDS-resistant higher order oligomers detected with Western blotting of the pellet and supernatant fractions. C, Hsp31 catalytic triad mutants suppress αSyn fibrillization. All proteins were added at the same level of 2 μm. A.U., arbitrary units.
FIGURE 8.
FIGURE 8.
Fluorescence microscopy demonstrating Hsp31 suppression of Sup35 aggregation. A, PrD-Sup35 produced ribbon-like and punctate aggregates that are decreased when Hsp31 is overexpressed. PrD-Sup35-EYFP was overexpressed for 48 h at 30 °C in control W303 cells or W303 cells expressing elevated levels of Hsp31. Hsp31 was diffuse in the cytoplasm and decreased the presence of Sup35 aggregates. The diffuse cytoplasmic localization of Hsp31 did not appear to be altered as a result of Sup35 expression. B, quantitation of cells with one or more Sup35-EYFP foci. A smaller proportion of cells with Sup35 aggregates was evident in Hsp31-overexpressing cells compared with vector control (pGPD). Values represent mean ± S.E. (n = 3). ***, two-tailed Student's t test; p ≤ 0.001. C, quantitation of Sup35-EYFP fluorescence suppression by Hsp31 using flow cytometry. Hsp31 overexpression lowers the median fluorescence intensity (FI; arbitrary units (A.U.)) of Sup35 compared with empty vector control. *, two-tailed Student's t test; p ≤ 0.05). Error bars, S.E.; n = 3 biological replicates. DIC, differential interference contrast.
FIGURE 9.
FIGURE 9.
Hsp31 and Sup35 are not mutually co-localized, and Hsp104 and Hsp70 are not altered. A, most cells with high levels of expression of Hsp31 and Sup35 exhibited diffuse cytoplasmic localization for Hsp31 that overlapped with Sup35 (top). Occlusion of Hsp31 from the Sup35 aggregate was also observed, as evidenced by the decreased DsRed signal at aggregate sites (white arrows, bottom panel). B, SDS-resistant Sup35 aggregates are suppressed by Hsp31. Cellular lysates were subjected to SDD-AGE and SDS-PAGE. Overexpression of Sup35-PrD-EYFP initiated the formation of Sup35 aggregates, which were detected with anti-GFP antibody. C, Hsp31 overexpression does not alter the expression levels of Hsp104 and Hsp70. Cells of the BY4741 strain harboring the pGPD-HSP31-DsRed or vector control (pGPD) were grown overnight, and samples were prepared as described in the legend to Fig. 3. Immunoblots (IB) were probed with anti-Hsp104, anti-Hsp70, anti-DsRed, and anti-actin antibodies.
FIGURE 10.
FIGURE 10.
The autophagy pathway prevents αSyn toxicity but is not required for Hsp31-mediated rescue. A, yeast strains serially diluted on YEP agar plates (glucose or raffinose/galactose) demonstrating the toxicity of GAL-αSyn in the atg8Δ, hsp31Δ, and atg8Δ hsp31Δ strains. B, overexpression of HSP31 using pAG415-GPD-HSP31-DsRed or the C138D mutant partially rescued toxicity of αSyn expression on YEP media for the atg8Δ, hsp31Δ, and atg8Δ hsp31Δ strains (right). Rescue by HSP31 overexpression could not be assessed in synthetic media for strains with the atg8Δ genotype because GAL-αSyn expression was not toxic in these strains (middle). Rescue of GAL-αSyn expression in the hsp31Δ strain was toxic and rescued by HSP31 overexpression in synthetic and YEP media.

References

    1. Luo G. R., Chen S., Le W. D. (2007) Are heat shock proteins therapeutic target for Parkinson's disease? Int. J. Biol. Sci. 3, 20–26 - PMC - PubMed
    1. Vila M., Przedborski S. (2004) Genetic clues to the pathogenesis of Parkinson's disease. Nat. Med. 10, S58–S62 - PubMed
    1. Farrer M. J. (2006) Genetics of Parkinson disease: paradigm shifts and future prospects. Nat. Rev. Genet. 7, 306–318 - PubMed
    1. Batelli S., Albini D., Rametta R., Polito L., Prato F., Pesaresi M., Negro A., Forloni G. (2008) DJ-1 modulates α-synuclein aggregation state in a cellular model of oxidative stress: relevance for Parkinson's disease and involvement of HSP70. PLoS One 3, e1884. - PMC - PubMed
    1. Choi J., Sullards M. C., Olzmann J. A., Rees H. D., Weintraub S. T., Bostwick D. E., Gearing M., Levey A. I., Chin L.-S., Li L. (2006) Oxidative damage of DJ-1 is linked to sporadic Parkinson's and Alzheimer's diseases. J. Biol. Chem. 281, 10816–10824 - PMC - PubMed

Publication types

MeSH terms