. 2015 Oct 9;290(41):24772-83.
doi: 10.1074/jbc.M115.687020. Epub 2015 Aug 25.

Fyn Activation of mTORC1 Stimulates the IRE1α-JNK Pathway, Leading to Cell Death

Affiliations

Fyn Activation of mTORC1 Stimulates the IRE1α-JNK Pathway, Leading to Cell Death

Yichen Wang et al. J Biol Chem. .

Abstract

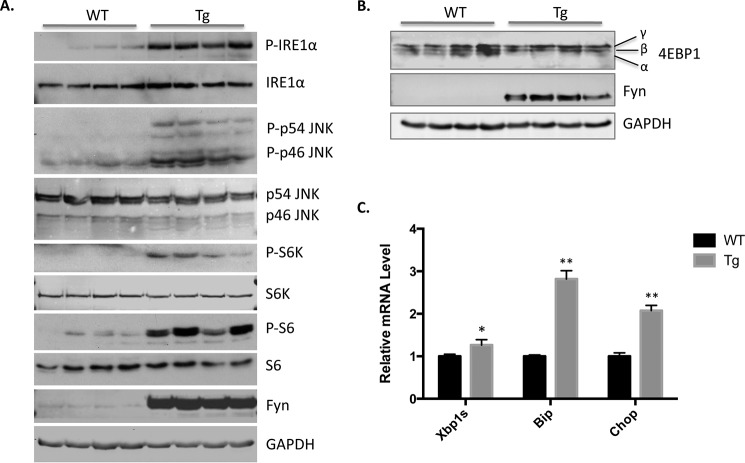
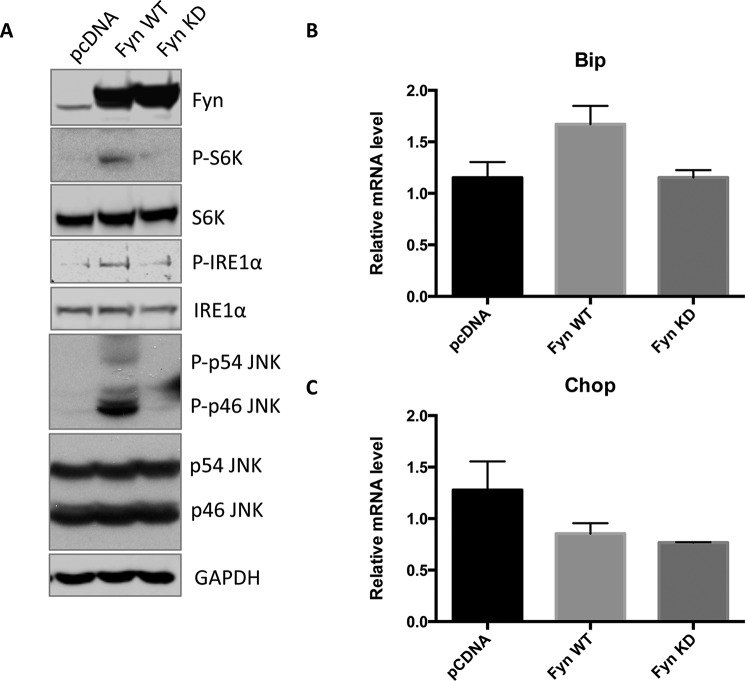
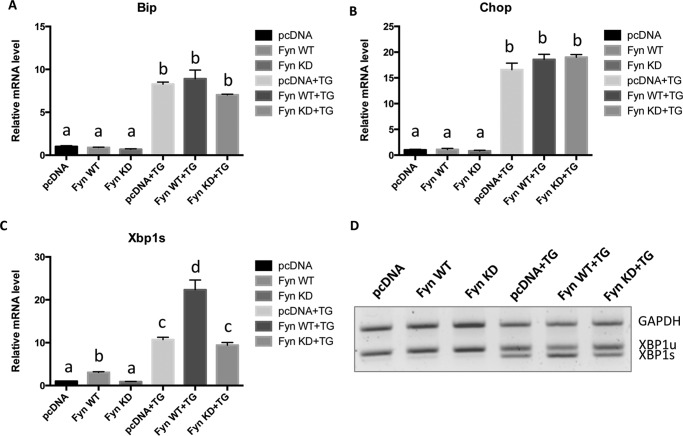
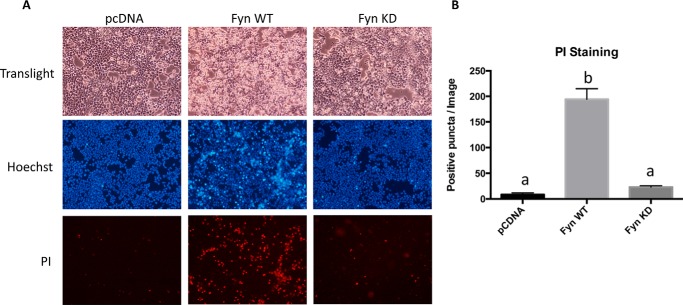
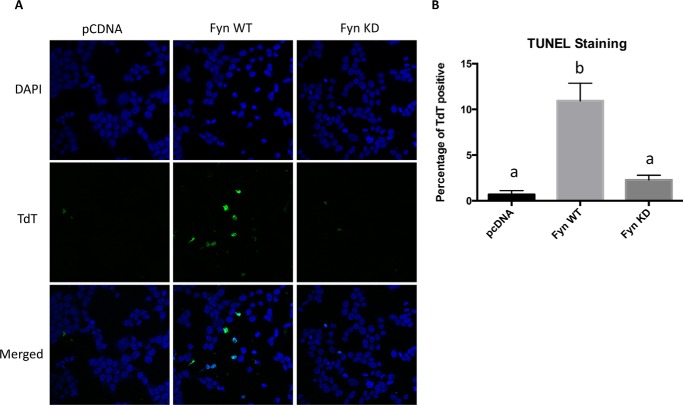
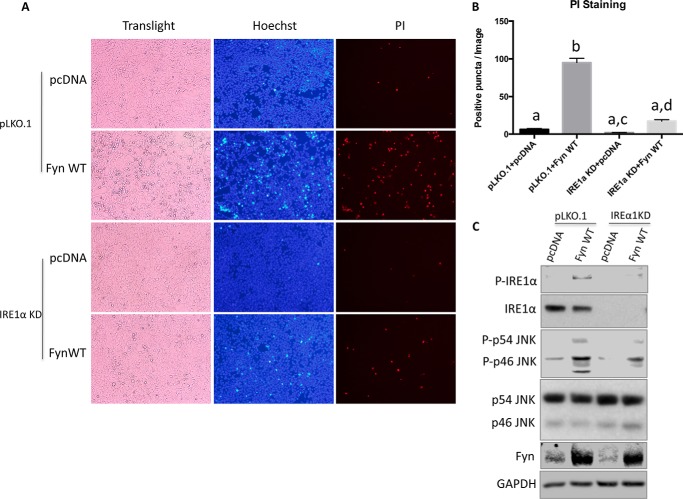
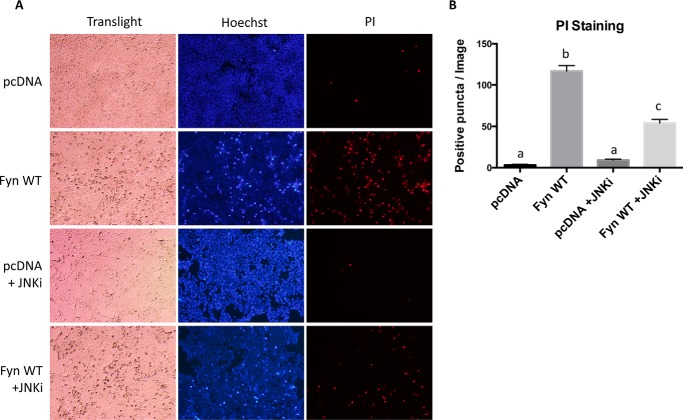
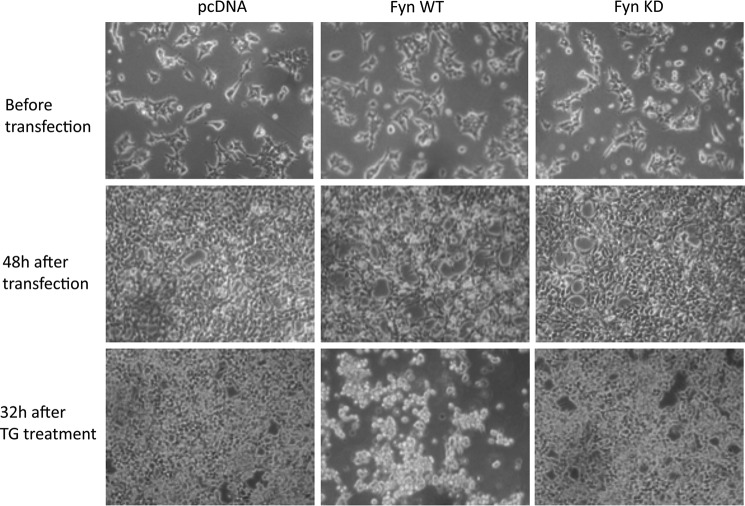
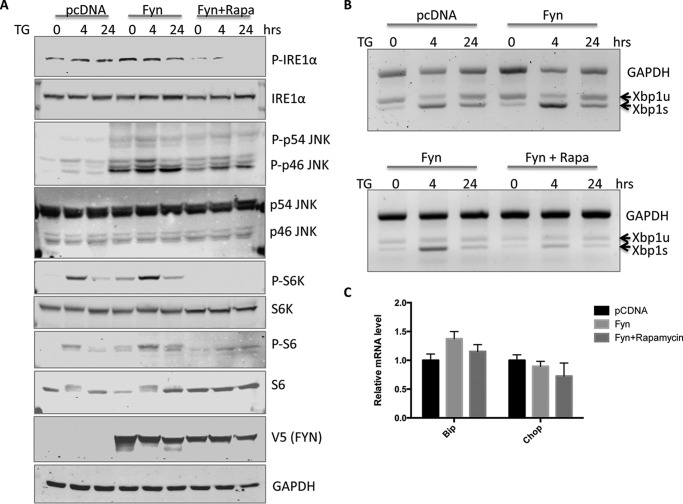
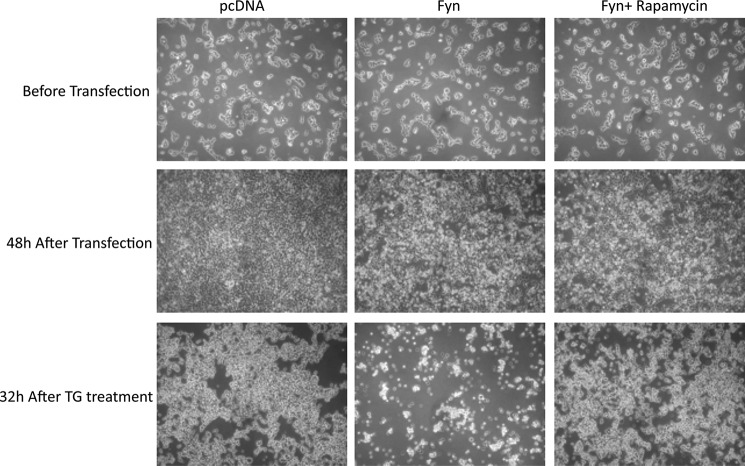
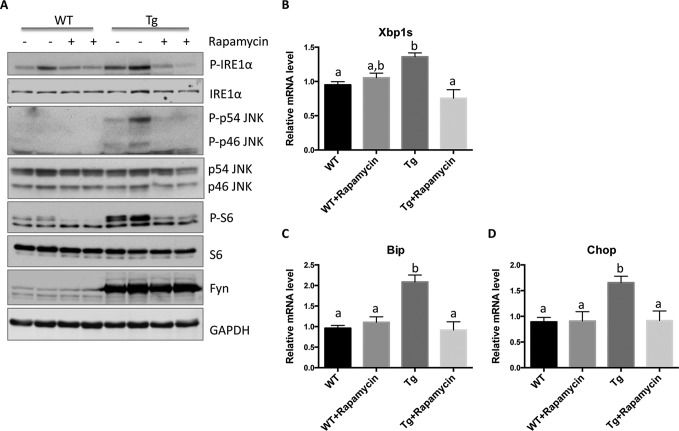
We previously reported that the skeletal muscle-specific overexpression of Fyn in mice resulted in a severe muscle wasting phenotype despite the activation of mTORC1 signaling. To investigate the bases for the loss of muscle fiber mass, we examined the relationship between Fyn activation of mTORC1, JNK, and endoplasmic reticulum stress. Overexpression of Fyn in skeletal muscle in vivo and in HEK293T cells in culture resulted in the activation of IRE1α and JNK, leading to increased cell death. Fyn synergized with the general endoplasmic reticulum stress inducer thapsigargin, resulting in the activation of IRE1α and further accelerated cell death. Moreover, inhibition of mTORC1 with rapamycin suppressed IRE1α activation and JNK phosphorylation, resulting in protecting cells against Fyn- and thapsigargin-induced cell death. Moreover, rapamycin treatment in vivo reduced the skeletal muscle IRE1α activation in the Fyn-overexpressing transgenic mice. Together, these data demonstrate the presence of a Fyn-induced endoplasmic reticulum stress that occurred, at least in part, through the activation of mTORC1, as well as subsequent activation of the IRE1α-JNK pathway driving cell death.

Keywords: Fyn; IRE1α; c-Jun N-terminal kinase (JNK); cell death; endoplasmic reticulum stress (ER stress); mammalian target of rapamycin (mTOR); skeletal muscle.


Figures

FIGURE 1.
FIGURE 1.
Skeletal muscle-specific Fyn overexpression induces mTORC1 and IRE1α activation. Wild type (WT) and SKM-Fyn mice (Tg) at 3 weeks of age were sacrificed after an overnight fast. A and B, gastrocnemius muscles were isolated, and cell extracts were prepared for Western blotting against the proteins indicated. These are representative immunoblots independently performed three times. p indicates phosphorylated form. C, the total RNA was extracted from isolated gastrocnemius muscles. The mRNA levels of XBP1s, Bip, and Chop were determined by quantitative PCR. The data are presented as mean ± S.E. from four independent experiments. *, p < 0.05; **, p < 0.01.
FIGURE 2.
FIGURE 2.
Fyn activates mTORC1, IRE1α, and JNK in HEK293T cells. HEK293T cells were transfected with the empty vector (pcDNA), Fyn wild type (Fyn WT), or Fyn kinase-defective (Fyn KD). A, forty-eight hours after transfection, cell extracts were prepared and subjected to Western blot for the indicated proteins. These are representative immunoblots independently performed three times. p indicates phosphorylated form. B, RNA was prepared, and the levels of Bip and Chop mRNA were determined by quantitative RT-PCR. These data are presented as mean ± S.E. from three independent experiments.
FIGURE 3.
FIGURE 3.
TG increases Fyn induction of XBP1s but not Bip or Chop mRNA expression in HEK293T cells. HEK293T cells were transfected with the empty vector (pcDNA), Fyn wild type (Fyn WT), or Fyn kinase-defective (Fyn KD). Forty-eight hours later, the cells were treated with 1 μm TG for 4 h. A–C, the levels of Bip (A), Chop (B), and spliced XBP1 (XBP1s) (C) mRNA were determined by quantitative RT-PCR. D, the mRNA levels of unspliced XBP1 (XBP1u) and spliced XBP1 (XBP1s) were analyzed by semi-quantitative PCR. These data are presented as mean ± S.E. from three independent experiments. Non-identical letters (a, b, c, and d) indicate results that are statistically different from each other at p < 0.05.
FIGURE 4.
FIGURE 4.
Overexpression of active Fyn kinase in HEK293T cells increases Hoechst and propidium iodide staining. HEK293T cells were transfected with the empty vector (pcDNA), Fyn wild type (Fyn WT), or Fyn kinase-defective (Fyn KD). A, forty-eight hours later, the cells were subjected to Hoechst and PI staining. These are representative images from experiments independently performed three times. B, the numbers of positive PI-stained cells were quantified from 10 images. These data are presented as mean ± S.E. Non-identical letters (a and b) indicate results that are statistically different from each other at p < 0.01.
FIGURE 5.
FIGURE 5.
Overexpression of active Fyn kinase in HEK293T cells increases TUNEL staining. HEK293T cells were transfected with the empty vector (pcDNA), Fyn wild type (Fyn WT), or Fyn kinase-defective (Fyn KD). A, forty-eight hours later, the cells were subjected to TUNEL staining. These are representative images from experiments independently performed three times. DAPI was pseudocolored as blue, whereas terminal deoxynucleotidyltransferase (TdT) was pseudocolored as green. B, the percentage of terminal deoxynucleotidyltransferase (TdT)-positive cells was quantified from 10 images. These data are presented as mean ± S.E. Non-identical letters (a and b) indicate results that are statistically different from each other at p < 0.01.
FIGURE 6.
FIGURE 6.
Knockdown of endogenous IRE1α in HEK293T cells suppresses the Fyn overexpression-induced cell death. Cells of IRE1α knockdown (IRE1α KD) and control cells (pLKO.1) were transfected by empty vector (pcDNA) or Fyn wild type (Fyn WT). A, forty-eight hours later, the cells were subjected to Hoechst and PI staining. These are representative images from experiments independently performed three times. B, the numbers of positive PI-stained cells were quantified from 10 images. These data are presented as mean ± S.E. Non-identical letters (a, b, and c) indicate results that are statistically different from each other at p < 0.05. C, cell extracts were prepared and subjected to Western blot for detection of the indicated proteins. p indicates phosphorylated form. These data are representatives of three independent experiments.
FIGURE 7.
FIGURE 7.
Inhibition of JNK represses the Fyn overexpression-induced cell death in HEK293T cells. Cells were transfected by empty vector (pcDNA) and Fyn wild type (Fyn WT). A, thirty-two hours after transfection, the cells were treated with or without JNK inhibitor (JNKi, 25 μm) for 16 h before being subjected to Hoechst and PI staining. These are representative images from experiments independently performed three times. B, the numbers of positive PI-stained cells were quantified from 10 images. The data are presented as mean ± S.E. Non-identical letters (a, b, and c) indicate results that are statistically different from each other at p < 0.05.
FIGURE 8.
FIGURE 8.
Fyn potentiates TG-induced cell death in HEK293T cells. HEK293T cells were transfected with the empty vector (pcDNA), Fyn wild type (Fyn WT), or Fyn kinase-defective (Fyn KD). Forty-eight hours later, the cells were treated with 1 μm TG for 32 h. Representative transmitted light microscopy images from three independent experiments are presented.
FIGURE 9.
FIGURE 9.
Fyn potentiates TG-induced mTORC1-IRE1α activation in HEK293T cells. HEK293T cells were transfected with either the empty vector (pcDNA) or Fyn wild type (Fyn). Forty-eight hours later, the cells were treated with 1 μm TG with or without 100 nm rapamycin (Rapa) for the indicated times. A, cell extracts were prepared and subjected to Western blotting against the proteins indicated. These are representative immunoblots independently performed three times. p indicates phosphorylated form. B, RNA was isolated, and mRNA levels of unspliced XBP1 (XBP1u) and spliced XBP1 (XBP1s) were analyzed by semi-quantitative RT-PCR. These are representative PCR reactions independently performed three times. C, the levels of Bip and Chop mRNA in cells treated with TG with or without rapamycin for 4 h were determined by quantitative RT-PCR. The data are presented as mean ± S.E. from three independent experiments.
FIGURE 10.
FIGURE 10.
Rapamycin protects against Fyn and thapsigargin-induced cell death in HEK293T cells. HEK293T cells were transfected with either the empty vector (pcDNA) or Fyn wild type (Fyn). Forty-eight hours later, the cells were treated with 1 μm TG with or without 100 nm rapamycin for 32 h. Representative transmitted light microscopy images are presented from three independent experiments.
FIGURE 11.
FIGURE 11.
Rapamycin suppresses mTORC1, IRE1α, and JNK activation in SKM-Fyn mice. Three-week-old wild type (WT) and SKM-Fyn transgenic (Tg) mice were intraperitoneally injected with vehicle or rapamycin (2 mg/kg) once a day for 4 days. The mice were then fasted overnight, and gastrocnemius muscles were isolated. A, extracts were prepared and subjected to Western blotting against the proteins indicated. These are representative immunoblots independently performed four times. p indicates phosphorylated form. B–D, extracts were prepared, and the levels of spliced XBP1 (XBP1s), Bip, and Chop mRNA were determined by quantitative RT-PCR. The data are presented as mean ± S.E. from four independent experiments. Non-identical letters (a and b) indicate results that are statistically different from each other at p < 0.05.

Similar articles

Cited by

References

    1. Hetz C. (2012) The unfolded protein response: controlling cell fate decisions under ER stress and beyond. Nat. Rev. Mol. Cell Biol. 13, 89–102 - PubMed
    1. Sano R., Reed J. C. (2013) ER stress-induced cell death mechanisms. Biochim. Biophys. Acta 1833, 3460–3470 - PMC - PubMed
    1. Rayavarapu S., Coley W., Nagaraju K. (2012) Endoplasmic reticulum stress in skeletal muscle homeostasis and disease. Curr. Rheumatol. Rep. 14, 238–243 - PMC - PubMed
    1. Bernales S., Papa F. R., Walter P. (2006) Intracellular signaling by the unfolded protein response. Annu. Rev. Cell Dev. Biol. 22, 487–508 - PubMed
    1. Ron D., Walter P. (2007) Signal integration in the endoplasmic reticulum unfolded protein response. Nat. Rev. Mol. Cell Biol. 8, 519–529 - PubMed

Publication types

MeSH terms

Substances

LinkOut - more resources