Comparative Study
. 2015 Aug 26;16(1):175.
doi: 10.1186/s13059-015-0753-7.

Comparison of Hi-C results using in-solution versus in-nucleus ligation

Affiliations
Comparative Study

Comparison of Hi-C results using in-solution versus in-nucleus ligation

Takashi Nagano et al. Genome Biol. .

Abstract

Background: Chromosome conformation capture and various derivative methods such as 4C, 5C and Hi-C have emerged as standard tools to analyze the three-dimensional organization of the genome in the nucleus. These methods employ ligation of diluted cross-linked chromatin complexes, intended to favor proximity-dependent, intra-complex ligation. During development of single-cell Hi-C, we devised an alternative Hi-C protocol with ligation in preserved nuclei rather than in solution. Here we directly compare Hi-C methods employing in-nucleus ligation with the standard in-solution ligation.

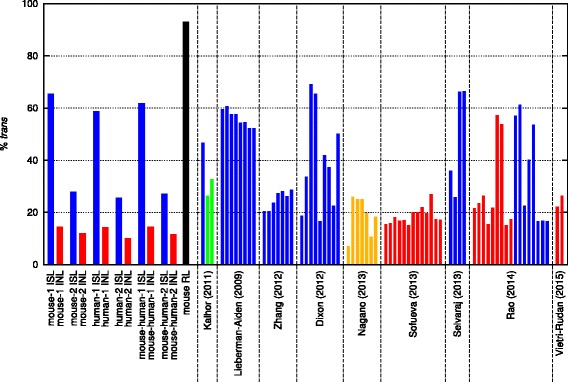
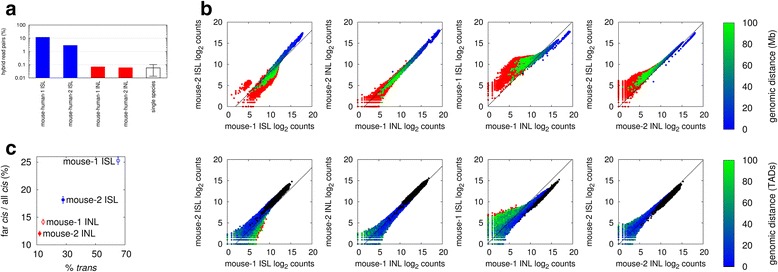
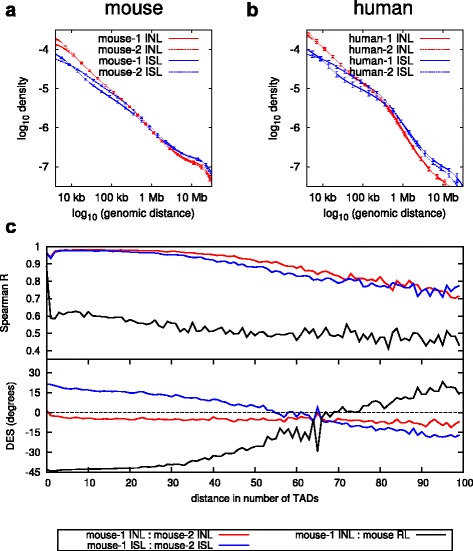
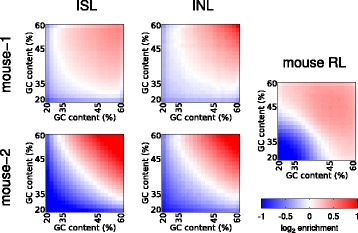
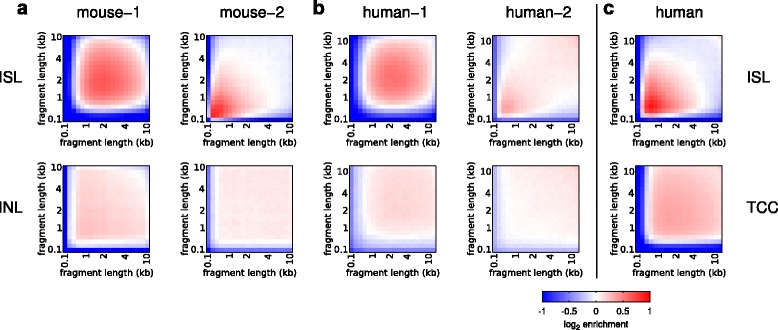
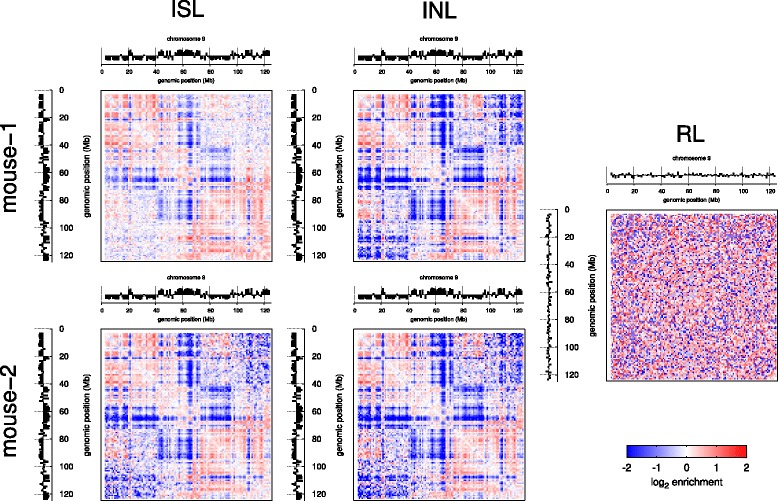
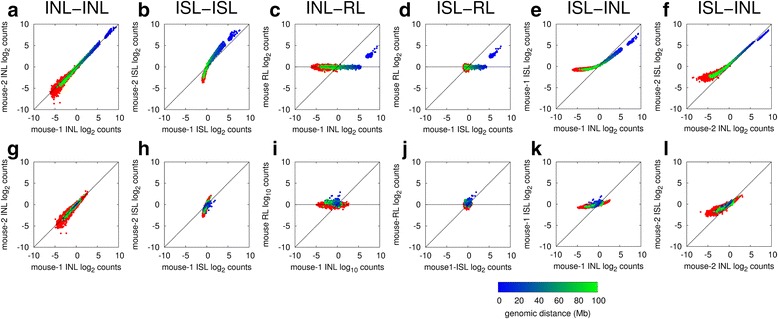
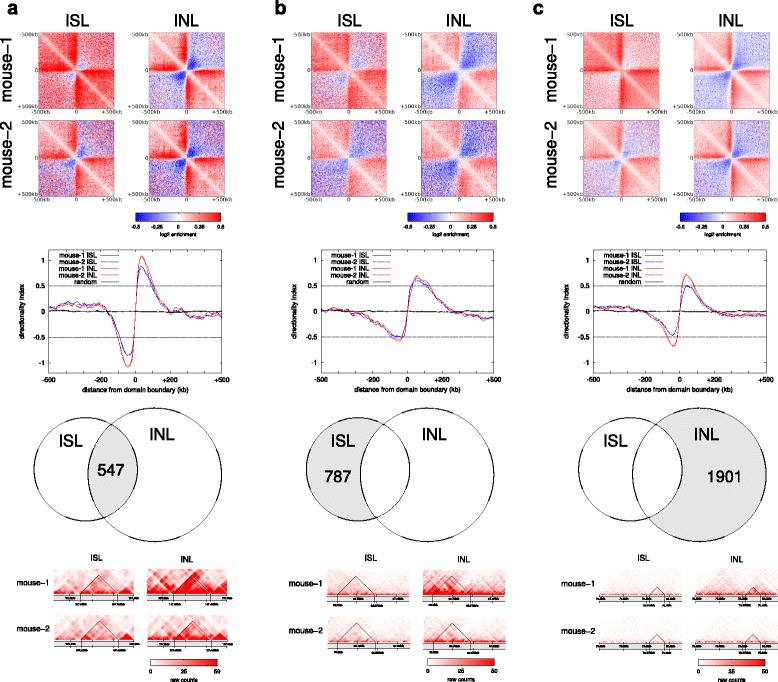
Results: We show in-nucleus ligation results in consistently lower levels of inter-chromosomal contacts. Through chromatin mixing experiments we show that a significantly large fraction of inter-chromosomal contacts are the result of spurious ligation events formed during in-solution ligation. In-nucleus ligation significantly reduces this source of experimental noise, and results in improved reproducibility between replicates. We also find that in-nucleus ligation eliminates restriction fragment length bias found with in-solution ligation. These improvements result in greater reproducibility of long-range intra-chromosomal and inter-chromosomal contacts, as well as enhanced detection of structural features such as topologically associated domain boundaries.

Conclusions: We conclude that in-nucleus ligation captures chromatin interactions more consistently over a wider range of distances, and significantly reduces both experimental noise and bias. In-nucleus ligation creates higher quality Hi-C libraries while simplifying the experimental procedure. We suggest that the entire range of 3C applications are likely to show similar benefits from in-nucleus ligation.


Figures

Fig. 1
Fig. 1
The frequencies of mapped and filtered trans-chromosomal di-tags (%trans). The percentage of trans-chromosomal di-tags in the Hi-C datasets in this study employing in-solution ligation (ISL; blue), in-nucleus ligation (INL; red) and random ligation (RL; black). Additional datasets from the publications indicated are shown with blue (in-solution ligation), red (in-nucleus ligation), green (TCC) or orange (single-cell Hi-C with in-nucleus ligation)
Fig. 2
Fig. 2
In-nucleus ligation reduces noise from Hi-C datasets. a The frequencies of hybrid mouse-human di-tags obtained from the mixture of mouse and human cells by in-solution (ISL; blue) and in-nucleus (INL; red) ligation experiments, compared with the mean hybrid di-tag frequencies in unmixed mouse or human samples (single species; white, with standard deviation). b Scatter plots comparing the log2 binned interaction counts for mouse datasets at 10 Mb resolution (top panels), and topologically associated domain (TAD) scale (bottom panels). Colors represent interaction distances according to the color bar shown; red dots represent trans-chromosomal interactions, black dots represent intra-TAD interactions in bottom panels. Dashed lines show the interaction counts corrected for the difference in the total counts. c The ratio of far-cis (>20 Mb) to all cis-chromosomal interaction counts plotted against the ratio of trans-chromosomal to all interaction counts (Pearson R > 0.98)
Fig. 3
Fig. 3
Reproducibility of cis-chromosomal interactions between replicates. Cis-chromosomal interaction frequency density as a function of the genomic distance for in-solution ligation (ISL; blue) and in-nucleus ligation (INL; red), for mouse foetal liver (a) and human ES cell samples (b). The error bars show one standard deviation from the mean of all chromosomes. c Top panel: Spearman correlation coefficient between replicates as a function of genomic distance. Bottom panel: deviation from expected slope (DES) as a function of genomic distance
Fig. 4
Fig. 4
Experimental GC content bias. The mouse in-solution (ISL), in-nucleus (INL) and random (RL) ligations are compared for GC content-related bias matrices, calculated using the Hi-C matrix correction [21], employing a 100-kb bin resolution
Fig. 5
Fig. 5
Experimental fragment length bias. The mouse and human in-solution (ISL), in-nucleus (INL) and TCC ligation datasets are compared for fragment length bias matrices, calculated using the Hi-C matrix correction [21], employing a 100-kb bin resolution. a Mouse foetal liver. b Human ES cells. c GM12878 human lymphoblastoid cells [4]
Fig. 6
Fig. 6
Normalized Hi-C matrices with compartments. Normalized matrices for mouse chromosome 9 from the indicated datasets with the first principal component indicated A and B compartments (defined by Lieberman-Aiden et al. [15]), at the top and left of each map. INL in-nucleus ligation, ISL in-solution ligation, RL random ligation
Fig. 7
Fig. 7
Reproducibility of the corrected Hi-C matrices. Element-wise comparison of coverage-corrected (af) and coverage- and distance-corrected (gl) Hi-C matrices as indicated. The scatter plots show the log2-corrected counts in one dataset against the corresponding count values in the second dataset, for all cis-chromosomal (blue to green color varying with genomic distance) and trans-chromosomal (red) bin interaction counts. The correction of Imakaev et al. [22] was applied, using a bin resolution of 10 Mb. INL in-nucleus ligation, ISL in-solution ligation, RL random ligation
Fig. 8
Fig. 8
Comparison of TAD boundary recognition. Average coverage- and distance-corrected Hi-C interaction profiles around TAD boundaries (top panels). Averaged standard score of the interaction directionality indices around TAD boundaries (line graphs). Venn diagrams of boundaries detected in the datasets as shown. Zoomed in views of randomly selected TADs from mouse chromosome 9 for each category (bottom panels). a TAD boundaries detected in both in-nucleus ligation (INL) and both in-solution ligation (ISL) replicates. b TAD boundaries detected by both ISL replicates only. c TAD boundaries detected by both INL replicates only

References

    1. Hakim O, Misteli T. SnapShot: chromosome conformation capture. Cell. 2012;148:1068. doi: 10.1016/j.cell.2012.02.019. - DOI - PMC - PubMed
    1. Dekker J, Marti-Renom MA, Mirny LA. Exploring the three-dimensional organization of genomes: interpreting chromatin interaction data. Nat Rev Genet. 2013;14:390–403. doi: 10.1038/nrg3454. - DOI - PMC - PubMed
    1. Selvaraj S, Dixon JR, Bansal V, Ren B. Whole-genome haplotype reconstruction using proximity-ligation and shotgun sequencing. Nat Biotechnol. 2013;31:1111–8. doi: 10.1038/nbt.2728. - DOI - PMC - PubMed
    1. Kalhor R, Tjong H, Jayathilaka N, Alber F, Chen L. Genome architectures revealed by tethered chromosome conformation capture and population-based modeling. Nat Biotechnol. 2012;30:90–8. doi: 10.1038/nbt.2057. - DOI - PMC - PubMed
    1. Dryden NH, Broome LR, Dudbridge F, Johnson N, Orr N, Schoenfelder S, et al. Unbiased analysis of potential targets of breast cancer susceptibility loci by Capture Hi-C. Genome Res. 2014;24:1854–68. doi: 10.1101/gr.175034.114. - DOI - PMC - PubMed

Publication types