. 2015 Aug 27;7(1):94.
doi: 10.1186/s13073-015-0216-5.

An assessment of sex bias in neurodevelopmental disorders

Affiliations

An assessment of sex bias in neurodevelopmental disorders

Andrew Polyak et al. Genome Med. .

Abstract

Background: Neurodevelopmental disorders such as autism and intellectual disability have a sex bias skewed towards boys; however, systematic assessment of this bias is complicated by the presence of significant genetic and phenotypic heterogeneity of these disorders.

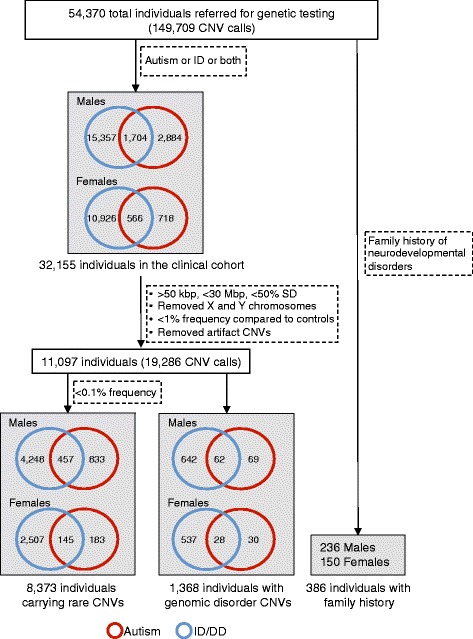
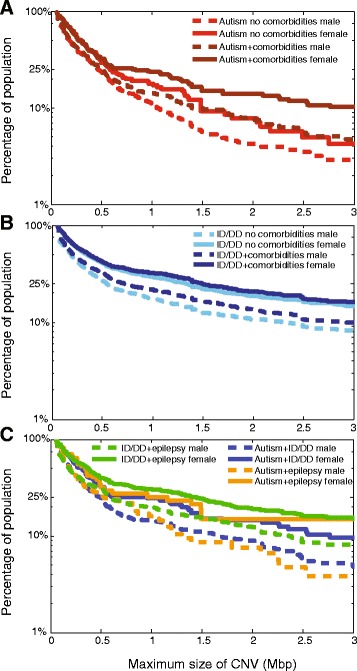
Methods: To assess the extent and characteristics of sex bias, we analyzed the frequency of comorbid features, the magnitude of genetic load, and the existence of family history within 32,155 individuals ascertained clinically for autism or intellectual disability/developmental delay (ID/DD), including a subset of 8,373 individuals carrying rare copy-number variants (CNVs).

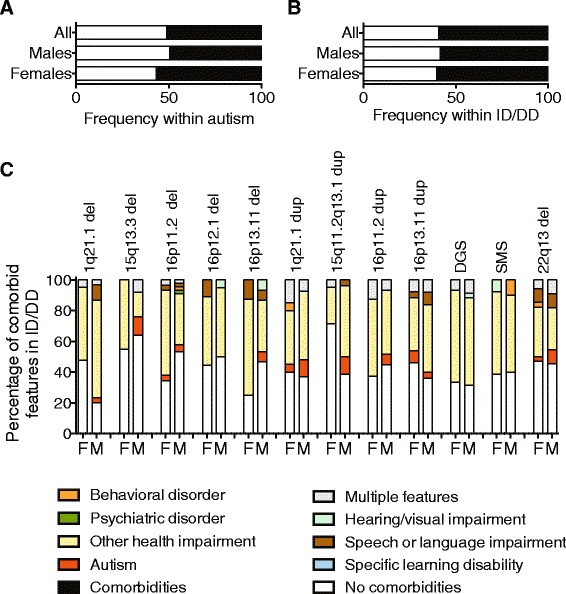
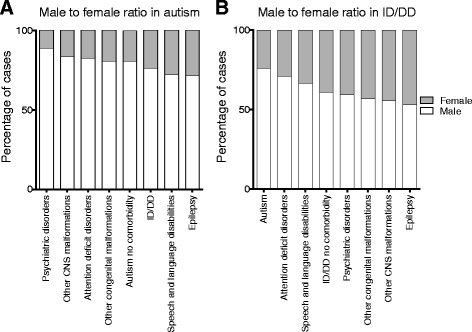
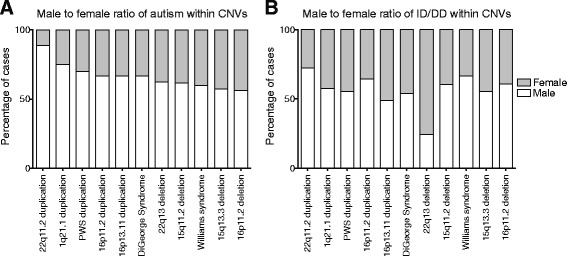
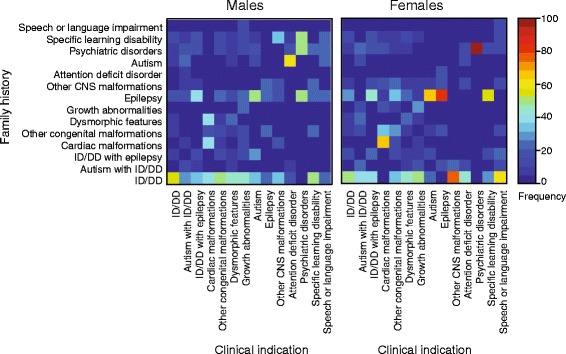
Results: We find that girls were more likely than boys to show comorbid features within both autism (P = 2.9 × 10(-6), OR = 1.34) and ID/DD (P = 7.2 × 10(-4), OR = 1.08) cohorts. The frequency of comorbid features in ID/DD was higher in boys (1q21.1 deletion, 15q11.2q13.1 duplication) or girls (15q13.3 deletion, 16p11.2 deletion) carrying specific CNVs associated with variable expressivity while such differences were the smallest for syndromic CNVs (Smith-Magenis syndrome, DiGeorge syndrome). The extent of the male sex bias also varied according to the specific comorbid feature, being most extreme for autism with psychiatric comorbidities and least extreme for autism comorbid with epilepsy. The sex ratio was also specific to certain CNVs, from an 8:1 male:female ratio observed among autistic individuals carrying the 22q11.2 duplication to 1.3:1 male:female ratio in those carrying the 16p11.2 deletion. Girls carried a higher burden of large CNVs compared to boys for autism or ID/DD, and this difference diminished when severe comorbidities were considered. Affected boys showed a higher frequency of neuropsychiatric family histories such as autism (P = 0.01) or specific learning disability (P = 0.03), while affected girls showed a higher frequency of developmental family histories such as growth abnormalities (P = 0.02).

Conclusions: The sex bias within neurodevelopmental disorders is influenced by the presence of specific comorbidities, specific CNVs, mutational burden, and pre-existing family history of neurodevelopmental phenotypes.


Figures

Fig. 1
Fig. 1
Schematic of cohorts derived from the clinical testing population. The schematic shows datasets derived from the Signature Genomics clinical testing population including the filtering of CNV calls to remove false-positive detection. Note that CNVs were removed if there was a >10 % overlap with a list of artifact CNV calls (Additional file 1: Table S2). Rare CNVs were derived after removing the CNV calls greater than 0.1 % frequency in a control cohort (>8/8,329 controls)
Fig. 2
Fig. 2
Comorbidity within autism and ID/DD. The frequency of comorbid features within (a) all cases with autism (n = 5,872), boys (n = 4,588) and girls (n = 1,284) with autism, and within (b) all individuals with ID/DD (n = 28,553), boys (n = 17,061) and girls (n = 11,492) with ID/DD is shown. The frequency of comorbid features within (c) girls (F) and boys (M) is shown for a representative set of genomic disorders. Additional file 1: Table S8 shows data for all CNVs with sample sizes >10. Due to a limited sample size within the genomic disorder cohort, only ID/DD can be shown. Samples sizes for the CNVs are: 1q21.1 del: M = 30, F = 21; 15q13.3 del: M = 25, F = 20; 16p11.2 del: M = 45, F = 29; 16p12.1 del: M = 20, F = 9; 16p13.11 del: M = 25, F = 26; 1q21.1 dup: M = 27, F = 20; 15q11.2q13.1 dup (Prader-Willi region dup): M = 26, F = 21; 16p11.2 dup: M = 29, F = 16; 16p13.11 dup: M = 25, F = 26; 22q11.2 del (DiGeorge Syndrome): M = 35, F = 30; Smith Magenis Syndrome (SMS): M = 10, F = 13; 22q13 del: M = 11, F = 34
Fig. 3
Fig. 3
Sex ratio for specific comorbidities in individuals with autism and ID/DD. The male:female ratio of individuals manifesting (a) autism, and (b) ID/DD, with specific comorbidities is shown. For this analysis, the other congenital malformations category also included growth abnormalities, kidney malformations, cardiac malformations, and dysmorphic features. Sample sizes (n) for each combination of comorbid features (with autism or ID/DD) is provided in Additional file 1: Table S9
Fig. 4
Fig. 4
Sex ratio for individuals with autism or ID/DD also carrying specific CNVs. The male:female ratio of individuals carrying specific deletions and duplications also manifesting features of (a) autism and (b) ID/DD. Sample sizes (n) for each CNV is provided in Additional file 1: Table S10
Fig. 5
Fig. 5
CNV burden in autism and ID/DD cohorts. Population frequency of the largest CNV in individuals with autism, ID/DD, epilepsy, and/or other comorbidities is shown. Using the rare CNV cohort, survivor functions were generated for the population frequency carrying a CNV larger than a given size. CNV burden plots are shown for: (a) boys (dashed lines) and girls (solid lines) with autism with or without any comorbidities; (b) boys (dashed lines) and girls (solid lines) with ID/DD with or without any comorbidities; (c) boys (dashed lines) and girls (solid lines) with autism with ID, autism with epilepsy, and ID with epilepsy are shown. Full statistical analysis including sample sizes (n) is provided in Additional file 1: Table S11
Fig. 6
Fig. 6
Family history among individuals with neurodevelopmental phenotypes. Matrices were generated showing percentage of individuals with a clinical indication and a specific family history among all individuals with that specific indication and any family history: boys (left, n = 236) and girls (right, n = 150). Family history is represented on the Y-axis, and the clinical indication of the proband is on the X-axis. The frequency of family history is depicted as a range of colors. A graphical description of the comparisons made is provided in Additional file 1: Figure S4

References

    1. Gillberg C, Cederlund M, Lamberg K, Zeijlon L. Brief report: “the autism epidemic”. The registered prevalence of autism in a Swedish urban area. J Autism Dev Disord. 2006;36:429–35. doi: 10.1007/s10803-006-0081-6. - DOI - PubMed
    1. Ropers HH. Genetics of intellectual disability. Curr Opin Genet Dev. 2008;18:241–50. doi: 10.1016/j.gde.2008.07.008. - DOI - PubMed
    1. Scott FJ, Baron-Cohen S, Bolton P, Brayne C. Brief report: prevalence of autism spectrum conditions in children aged 5–11 years in Cambridgeshire. UK Autism. 2002;6:231–7. doi: 10.1177/1362361302006003002. - DOI - PubMed
    1. Autism and Developmental Disabilities Monitoring Network Surveillance Year Principal Investigators, Centers for Disease Control and Prevention Prevalence of autism spectrum disorder among children aged 8 years - autism and developmental disabilities monitoring network, 11 sites, United States, 2010. MMWR Surveill Summ. 2014;63:1–21. - PubMed
    1. Desachy G, Croen LA, Torres AR, Kharrazi M, Delorenze GN, Windham GC, et al. Increased female autosomal burden of rare copy number variants in human populations and in autism families. Mol Psychiatry. 2015;20:170–5. doi: 10.1038/mp.2014.179. - DOI - PubMed

Publication types

LinkOut - more resources