. 2015 Sep;27(9):2335-52.
doi: 10.1105/tpc.15.00508. Epub 2015 Aug 25.

Chlamydomonas Genome Resource for Laboratory Strains Reveals a Mosaic of Sequence Variation, Identifies True Strain Histories, and Enables Strain-Specific Studies

Affiliations

Chlamydomonas Genome Resource for Laboratory Strains Reveals a Mosaic of Sequence Variation, Identifies True Strain Histories, and Enables Strain-Specific Studies

Sean D Gallaher et al. Plant Cell. 2015 Sep.

Abstract

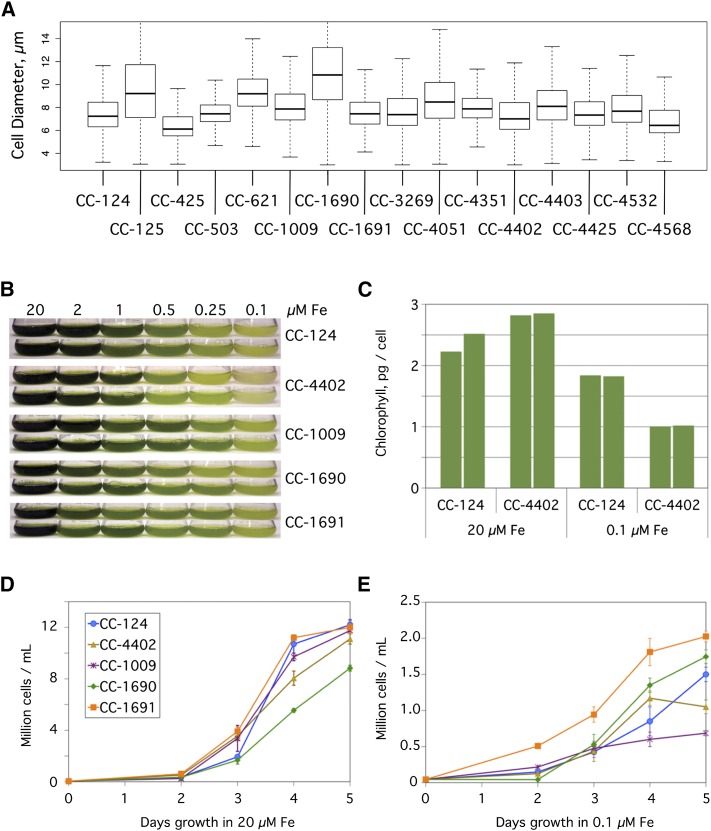
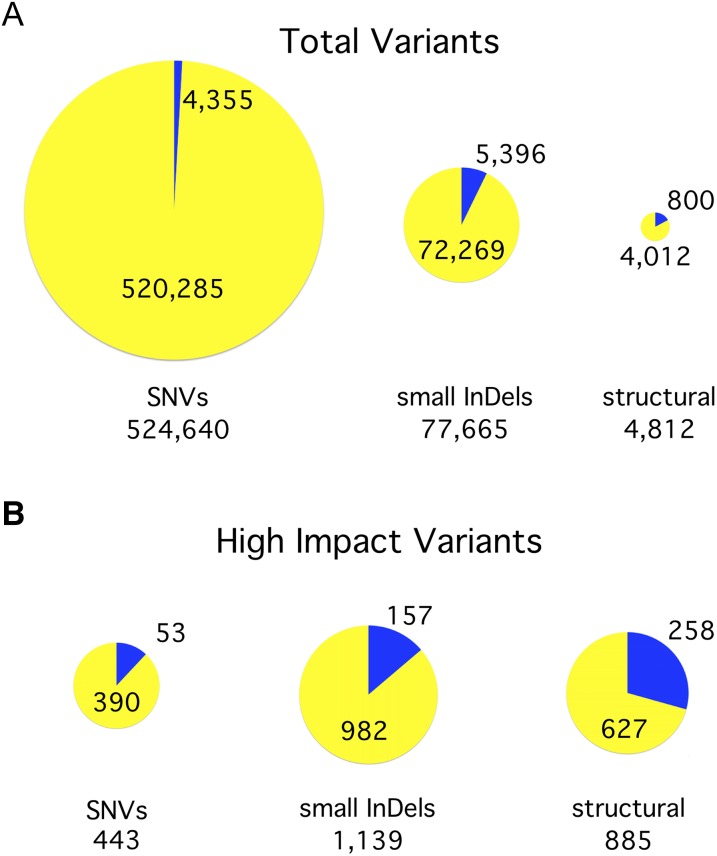
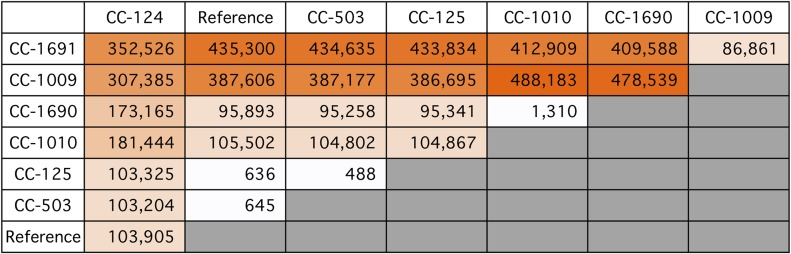
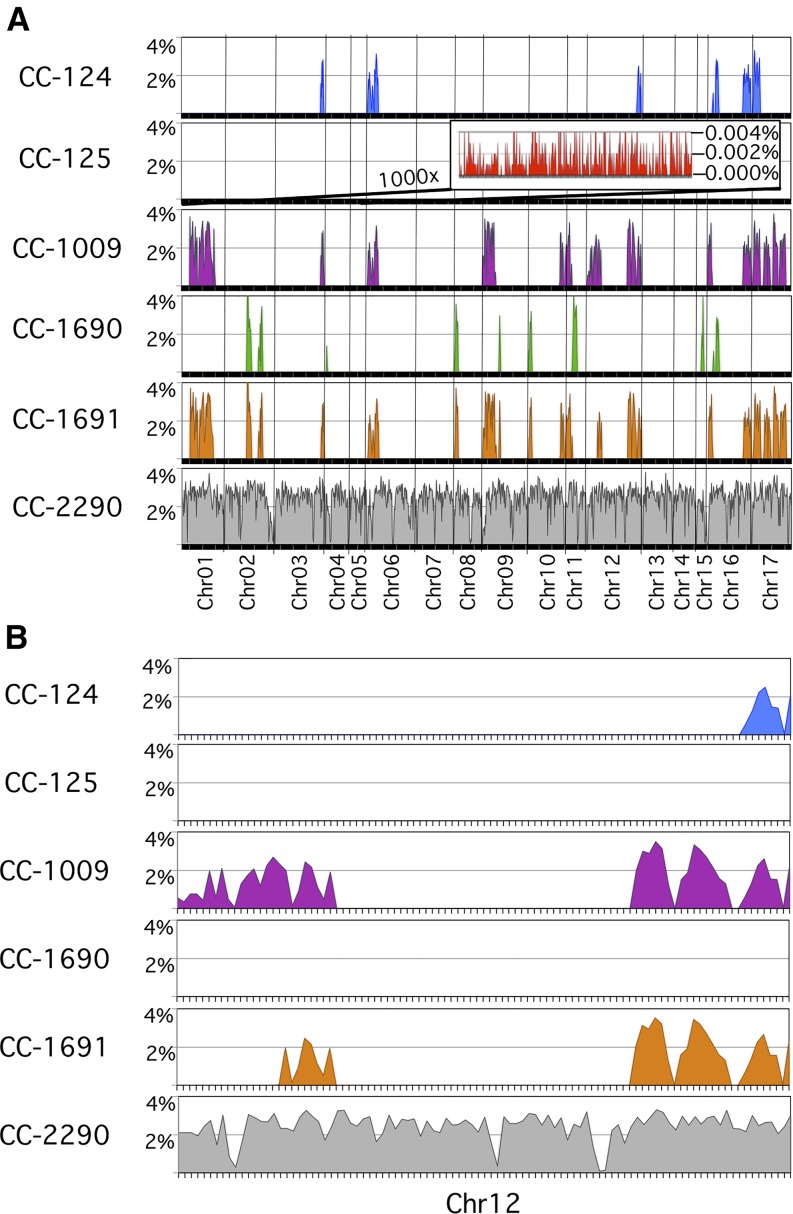
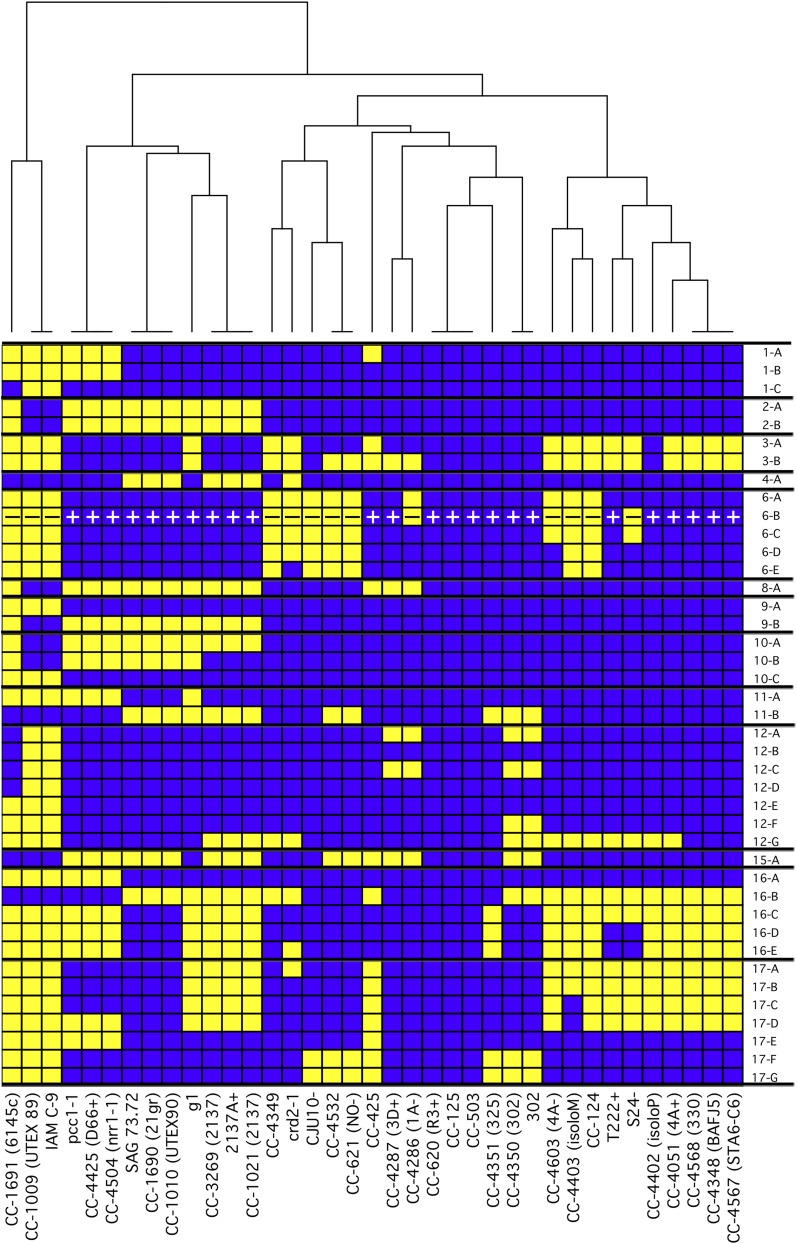
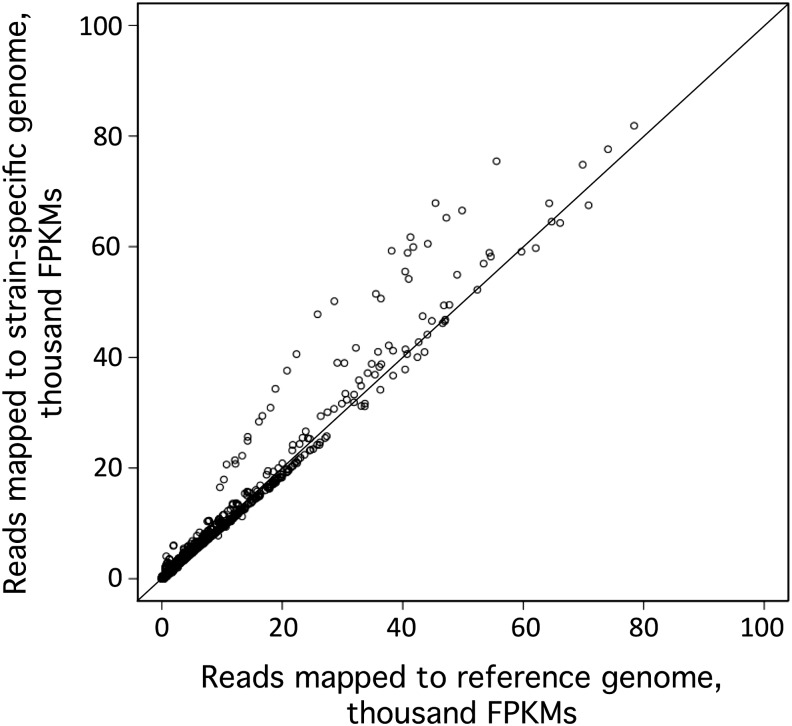
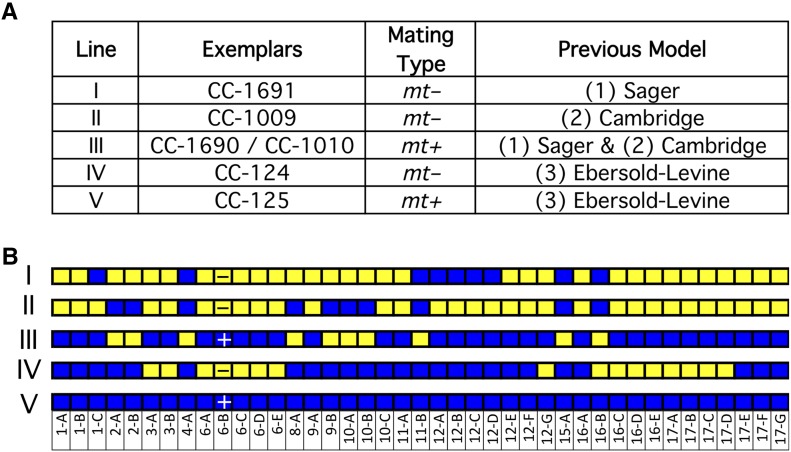
Chlamydomonas reinhardtii is a widely used reference organism in studies of photosynthesis, cilia, and biofuels. Most research in this field uses a few dozen standard laboratory strains that are reported to share a common ancestry, but exhibit substantial phenotypic differences. In order to facilitate ongoing Chlamydomonas research and explain the phenotypic variation, we mapped the genetic diversity within these strains using whole-genome resequencing. We identified 524,640 single nucleotide variants and 4812 structural variants among 39 commonly used laboratory strains. Nearly all (98.2%) of the total observed genetic diversity was attributable to the presence of two, previously unrecognized, alternate haplotypes that are distributed in a mosaic pattern among the extant laboratory strains. We propose that these two haplotypes are the remnants of an ancestral cross between two strains with ∼2% relative divergence. These haplotype patterns create a fingerprint for each strain that facilitates the positive identification of that strain and reveals its relatedness to other strains. The presence of these alternate haplotype regions affects phenotype scoring and gene expression measurements. Here, we present a rich set of genetic differences as a community resource to allow researchers to more accurately conduct and interpret their experiments with Chlamydomonas.


Figures

Figure 1.
Figure 1.
Phenotypic Diversity in Wild-Type Strains. (A) Diversity of cell size. The size of Chlamydomonas cells from the indicated 16 strains were assayed by a cellometer. Results are plotted as a box plot indicating the median cell size (bold horizontal line), the upper and lower quartiles (ends of boxes), and the range (thin horizontal lines) from 1000 cells per sample. (B) Growth of Chlamydomonas cells in a range of iron concentrations. The indicated strains were inoculated to a density of104 cells/mL in 100-mL cultures of TAP media containing iron concentrations ranging from 0.1 to 20 µM. Duplicate cultures were photographed after 5 d of growth. (C) Chlorophyll content in Chlamydomonas cells. Chlorophyll content was measured on a per cell basis for duplicate cultures of the closely related CC-124 and CC-4402 strains in TAP medium plus 20 µM or 0.1 µM iron after 5 d of growth. (D) and (E) Growth rates. Quantification of the number of cells in TAP medium supplemented with 20 µM iron (D) or 0.1 µM iron (E). Cells were counted by a hemocytometer daily for 5 d and plotted. Each point represents the mean (± range) of the cell count for duplicate cultures.
Figure 2.
Figure 2.
Summary of Variants by Type. (A) Identification of variants. We identified 607,117 variants in total, including SNVs, InDels of 40 bp or less (small InDels), and structural variants (insertions, deletions, and inversions >40 bp). The size of each pie chart is proportional to the number of variants in the indicated class. The yellow portion of each pie indicates the percentage of variants in that class that are attributable to a second haplotype inherited from a divergent ancestral parent, referred to in this work as haplotype 2. The blue portion indicates those variants that arose in the laboratory since the original cross. (B) Effect of variants on gene models. Each variant was graded based on what effect it was predicted to have on nearby gene models. Those variants that were rated to have a high impact on at least one gene are included here in proportionately sized pie charts.
Figure 3.
Figure 3.
1000-Fold Range of Pairwise SNVs between Representative Strains. The number of pairwise SNVs for each pair of indicated strains is presented. A gradient from white to dark orange highlights the increasing numbers of SNVs. This figure includes exemplars of the original strains distributed by Smith, as well as the reference strain. A similar comparison of all strains can be found in Supplemental Data Set 4.
Figure 4.
Figure 4.
Uneven Distribution of Variants across the Genome in Representative Strains. (A) Discrete regions with a high variant rate that were found throughout the genome. The percentage of variant nucleotides was plotted for 100,000-bp windows over the length of each of the 17 chromosomes for the indicated strains. CC-2290 is an interfertile, but independent, isolate of Chlamydomonas. It has an average of 2.4% variant rate that is consistent across the genome. The other five strains included are direct descendants of the original strains distributed by Smith and are representative of all of the strains included in this study. Each of these standard laboratory strains has a biphasic variant rate that jumps 1000-fold from a 0.002% basal variant rate up to 2.0% in discrete regions throughout the genome. A representative portion of the basal variant rate for CC-125 is shown in the inset at 1000× magnification. (B) An expanded view of chromosome 12. High variant rate regions are shared in different combinations between the standard laboratory strains.
Figure 5.
Figure 5.
Distribution of Two Haplotypes in Laboratory Strains. Within the population of standard laboratory strains, 25.2% of the genome was found to have either of two haplotypes with 2.0% sequence divergence between them. The haplotype of the reference strain, CC-503, was arbitrarily designated as haplotype 1 and the alternate regions as haplotype 2. We algorithmically determined the boundaries of the regions with two haplotypes and combined them into the fewest number of contiguous regions in which all strains are entirely one or the other haplotype. These are plotted for the indicated strains with blue representing haplotype 1 and yellow representing haplotype 2. The mating locus is indicated by + or –. A dendrogram was constructed to arrange the strains based on the similarity of their haplotypes. The coordinates of each block in version 5 of the Chlamydomonas reference genome are presented in Table 2.
Figure 6.
Figure 6.
Impact of a Strain-Specific Genome on RNA-Seq Expression Estimates. Reads from 16 independent CC-4348 RNA-seq libraries and 16 independent CC-4349 RNA-seq libraries were aligned in parallel to both the reference genome and a strain-specific genome for those regions identified by WGS to be haplotype 2 in the respective strains. The mRNA abundance for each gene in these regions was determined in terms of FPKMs for each library for both sets of alignments. The results are shown as a scatterplot of FPKMs as determined by alignment to the haplotype 1 reference genome (x axis) versus the same reads aligned to the haplotype 2 strain-specific genome (y axis).
Figure 7.
Figure 7.
Improved Model for Gilbert Smith’s Original Strains. (A) Five-strain model. WGS of the strains originally distributed by Smith supports a model with five distinct strains, labeled I to V. The relationship of these strains to the previous three-strain model is shown. (B) The haplotype patterns of the five lineages. The + or – in block 6-B represents the mating type.
Figure 8.
Figure 8.
Model for the Distribution of the Two Haplotypes. The original zygospore that all standard laboratory strains are derived from is hypothesized to be the product of a mating between two strains that were 2% divergent in sequence, depicted here as blue versus yellow. In subsequent crosses, the resulting progeny lost much of this genetic variation so that in extant strains today there is only one haplotype for 74.8% of the genome. The other 25.2% of the genome may have one of two possible haplotypes in each strain, depending on which ancestral parent donated a given locus to that strain. Here, we arbitrarily designated the haplotype of the reference strain as haplotype 1 and the alternate as haplotype 2. Haplotype 2 regions are recognized by the relatively high (2%) frequency of variants relative to the reference strain.

Comment in

References

    1. Blaby I.K., et al. (2013). Systems-level analysis of nitrogen starvation-induced modifications of carbon metabolism in a Chlamydomonas reinhardtii starchless mutant. Plant Cell 25: 4305–4323. - PMC - PubMed
    1. Cakmak T., Angun P., Demiray Y.E., Ozkan A.D., Elibol Z., Tekinay T. (2012). Differential effects of nitrogen and sulfur deprivation on growth and biodiesel feedstock production of Chlamydomonas reinhardtii. Biotechnol. Bioeng. 109: 1947–1957. - PubMed
    1. Castruita M., Casero D., Karpowicz S.J., Kropat J., Vieler A., Hsieh S.I., Yan W., Cokus S., Loo J.A., Benning C., Pellegrini M., Merchant S.S. (2011). Systems biology approach in Chlamydomonas reveals connections between copper nutrition and multiple metabolic steps. Plant Cell 23: 1273–1292. - PMC - PubMed
    1. Chen K., et al. (2009). BreakDancer: an algorithm for high-resolution mapping of genomic structural variation. Nat. Methods 6: 677–681. - PMC - PubMed
    1. Cingolani P., Platts A., Wang L., Coon M., Nguyen T., Wang L., Land S.J., Lu X., Ruden D.M. (2012). A program for annotating and predicting the effects of single nucleotide polymorphisms, SnpEff: SNPs in the genome of Drosophila melanogaster strain w1118; iso-2; iso-3. Fly (Austin) 6: 80–92. - PMC - PubMed

Publication types

Substances