. 2015 Aug 26:6:8093.
doi: 10.1038/ncomms9093.

A caveolin-dependent and PI3K/AKT-independent role of PTEN in β-catenin transcriptional activity

Affiliations

A caveolin-dependent and PI3K/AKT-independent role of PTEN in β-catenin transcriptional activity

Alejandro Conde-Perez et al. Nat Commun. .

Abstract

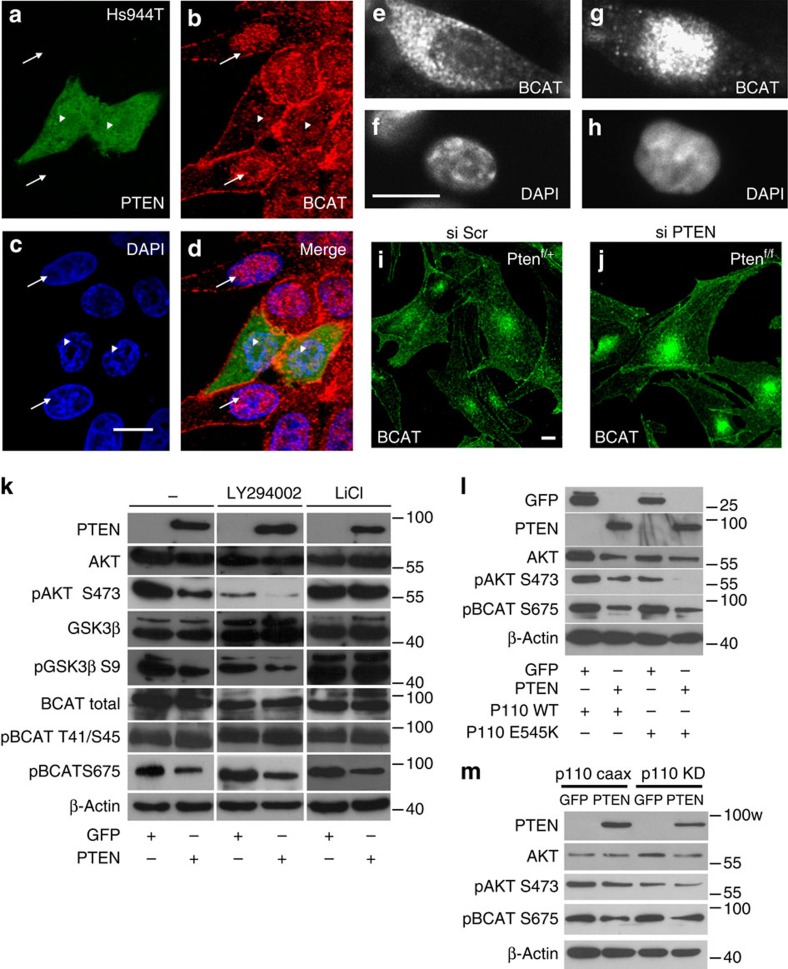
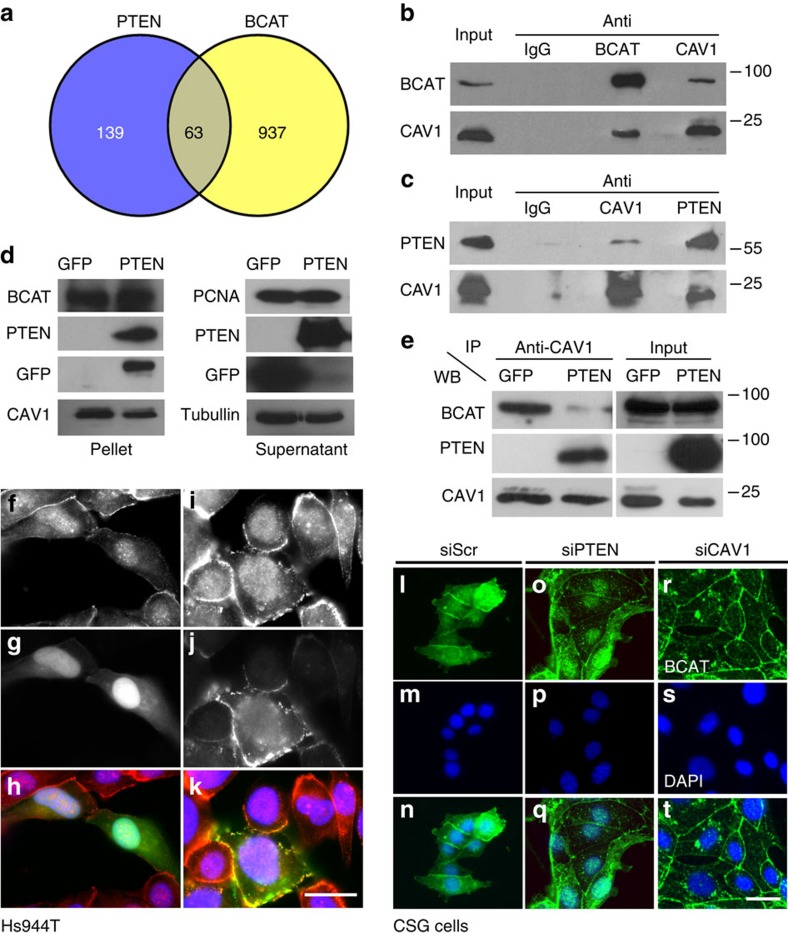
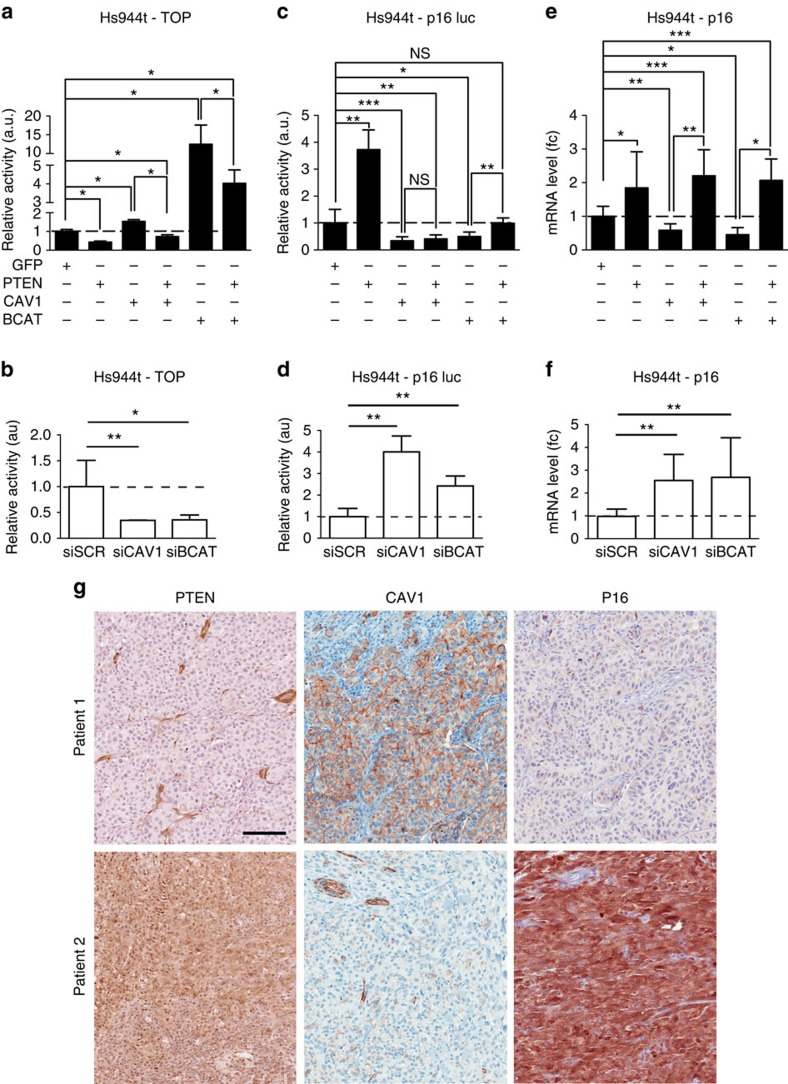
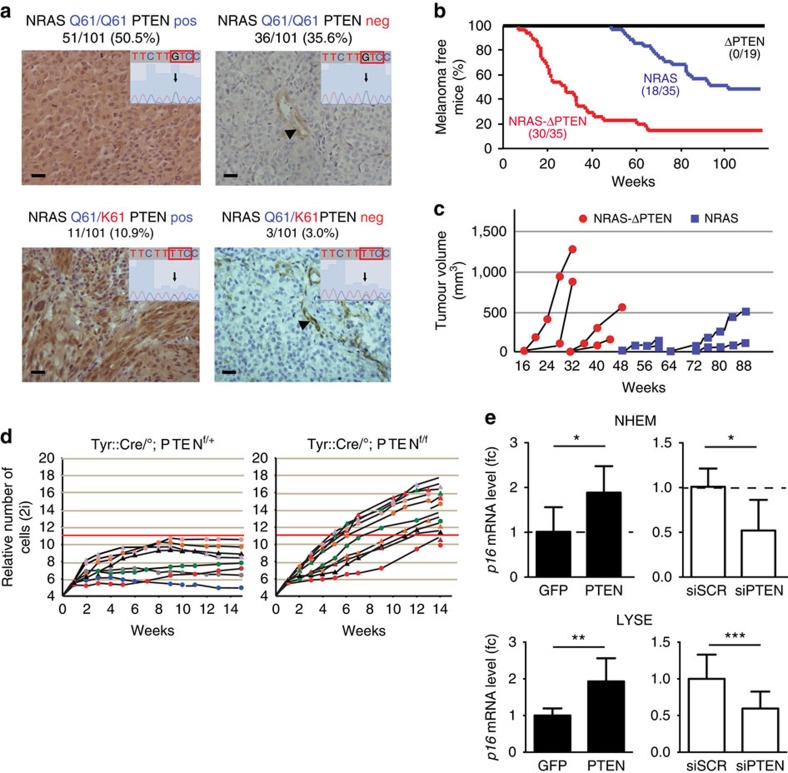
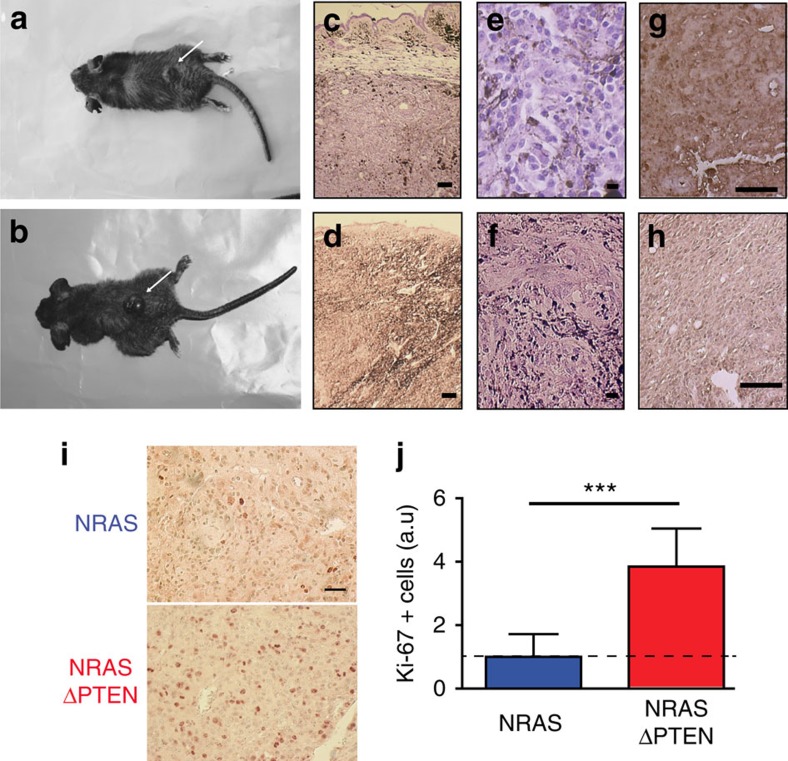
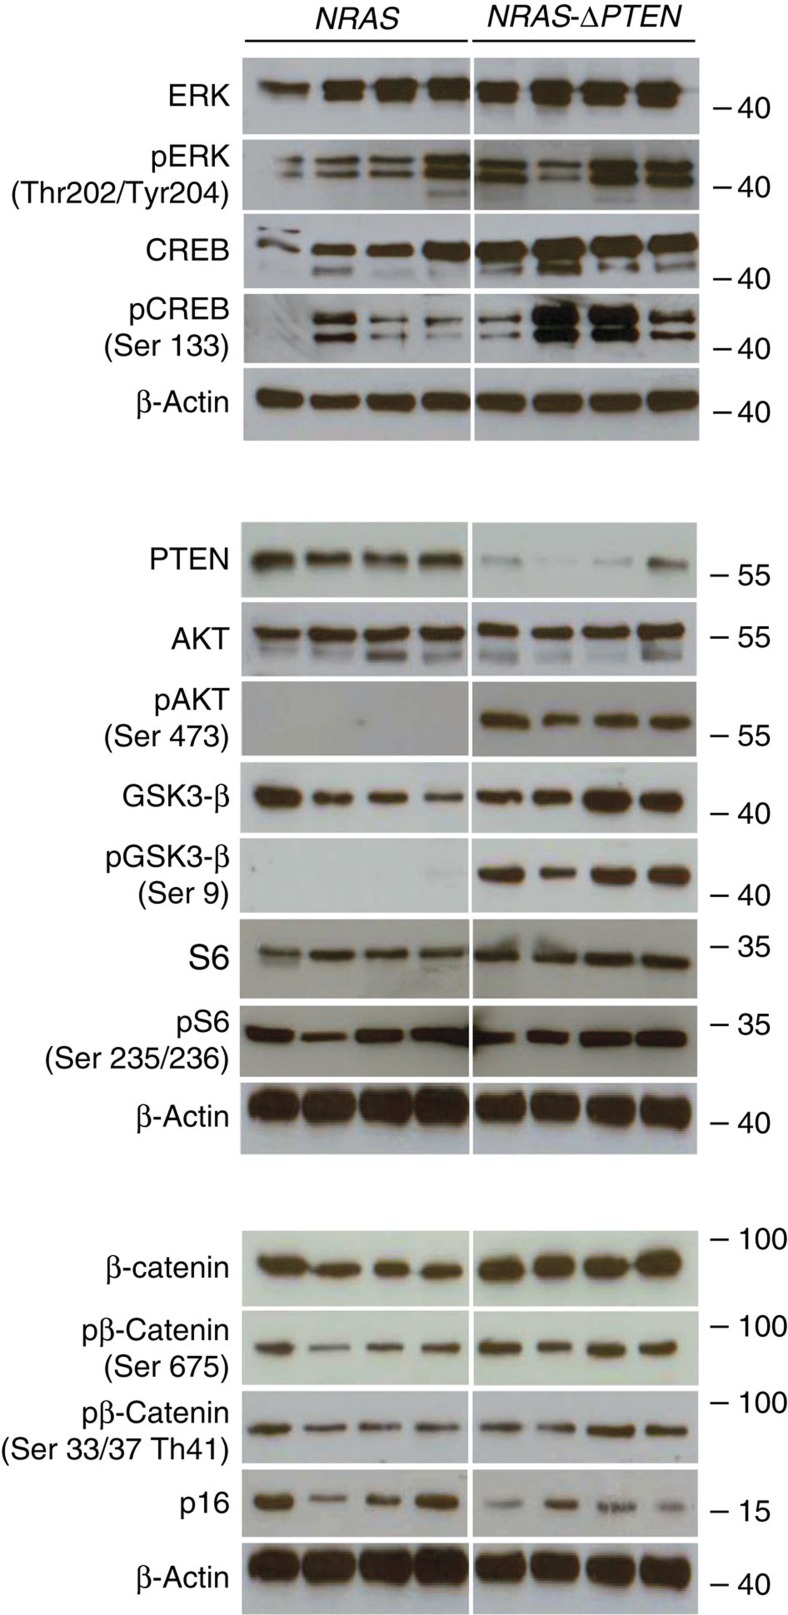
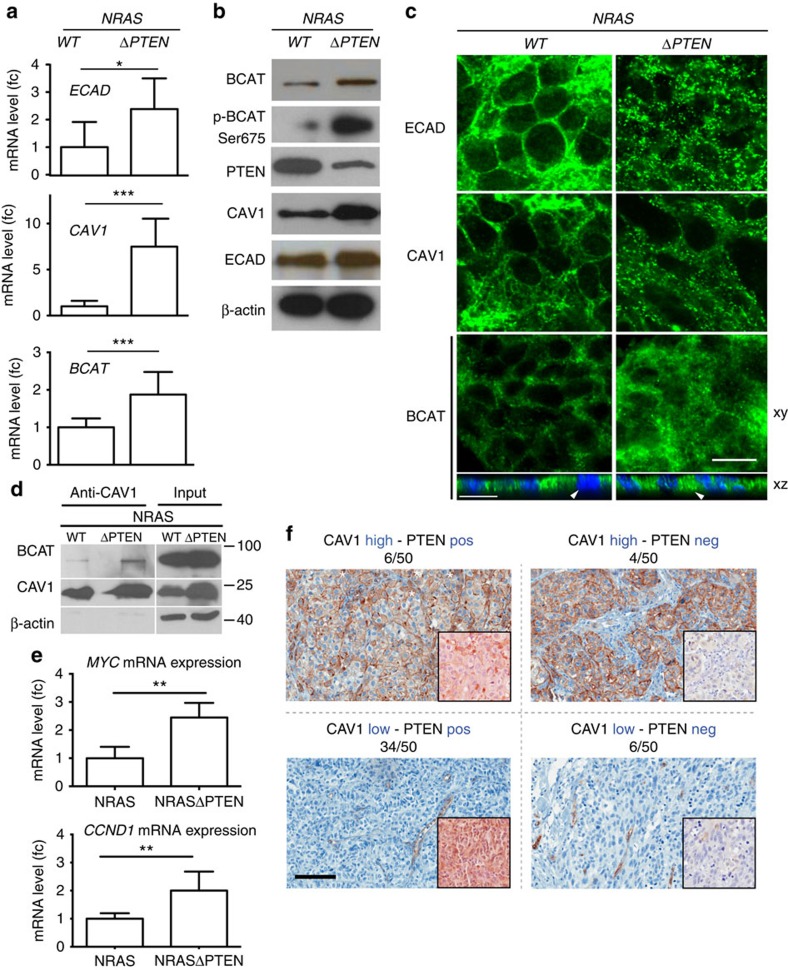
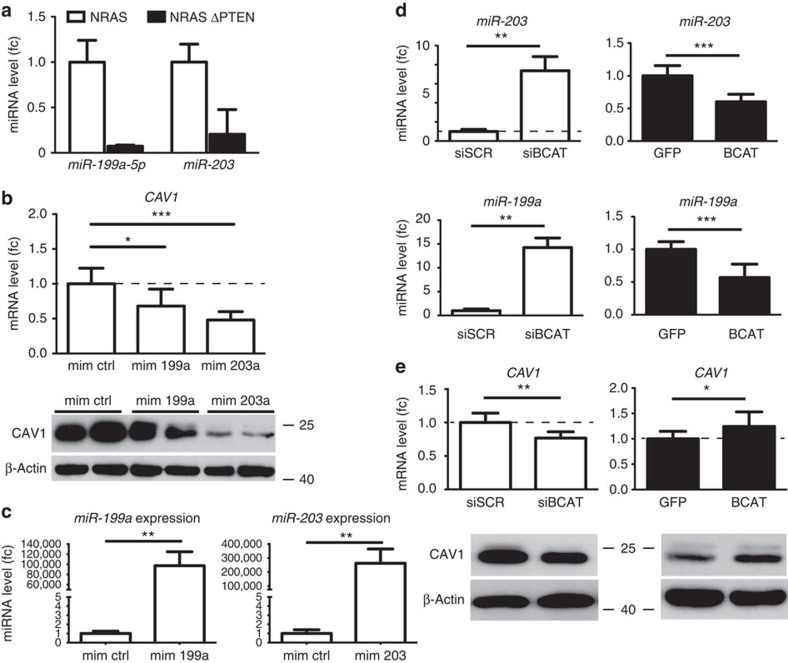
Loss of the tumour suppressor PTEN is frequent in human melanoma, results in MAPK activation, suppresses senescence and mediates metastatic behaviour. How PTEN loss mediates these effects is unknown. Here we show that loss of PTEN in epithelial and melanocytic cell lines induces the nuclear localization and transcriptional activation of β-catenin independent of the PI3K-AKT-GSK3β axis. The absence of PTEN leads to caveolin-1 (CAV1)-dependent β-catenin transcriptional modulation in vitro, cooperates with NRAS(Q61K) to initiate melanomagenesis in vivo and induces efficient metastasis formation associated with E-cadherin internalization. The CAV1-β-catenin axis is mediated by a feedback loop in which β-catenin represses transcription of miR-199a-5p and miR-203, which suppress the levels of CAV1 mRNA in melanoma cells. These data reveal a mechanism by which loss of PTEN increases CAV1-mediated dissociation of β-catenin from membranous E-cadherin, which may promote senescence bypass and metastasis.


Figures

Figure 1
Figure 1. PTEN affects β-catenin nuclear localization.
(a) Confocal microscopy revealed cells (labelled with arrows) with a heavily laden β-catenin (bcat) nuclear staining (b), in contrast to nearby PTEN-GFP-positive cells, where β-catenin staining could seldom be observed within the nucleus, arrowheads. Cells were counterstained with 4,6-diamidino-2-phenylindole (DAPI) (c). Merged is shown (d). Scale bar, 10 μm. Immunofluorescence experiments for the Hs944T cells were performed three times with similar results. (eh) Human melanoma Lyse cells mutated for NRAS (Q61K), which produce PTEN, were transfected with siScr (e,f) and siPTEN (g,h). Cells were labelled for β-catenin (e,g) and counter stained with DAPI (f,h). Scale bar, 10 μm. Immunofluorescence experiments for the Lyse cells were performed two times with similar results. (i,j) Confocal microscopy showing the localization of β-catenin in Tyr::Cre/°;PTENf/+=PTENf/+ (i) and Tyr::Cre/°;PTENf/f=PTENf/f (j) melanocytes. Note the increase of nuclear β-catenin staining in PTENf/f cells. Scale bar, 10 μm. Immunofluorescence experiments for the murine PTENf/+ and PTENf/f cells were performed four times with similar results. (k) Immunoblot analysis of PTEN, AKT (total and phosphorylated form Ser473), GSK3β (total and phosphorylated form Ser9), β-catenin (total, phosphorylated form Thr41/Ser45 and Ser675) and β-actin proteins in Hs944T transfected with either expression vector encoding GFP (CMV::GFP) or PTEN (CMV::PTEN-GFP). Cells expressing either exogenous GFP or PTEN treated with LY294002 or LiCl for 1 h. It is noteworthy that a higher concentration of GSK3β antibody reveals a second upper band. Western blot analyses were performed two times for all antibodies with similar outputs. (l) Immunoblot blot analysis for GFP, PTEN, AKT (total and pSer473), β-catenin pSer675 and β-actin of Hs944T lysates co-transfected with either empty vector GFP or PTEN and WT or constitutively active p110 E545K mutant. Cells were starved for 2 h with 0.1% serum before lysis. Western blot analyses were performed two times for all antibodies with similar outputs. (m) Immunoblot blot analysis for PTEN, AKT (total and pSer473), β-catenin pSer675 and β-actin of Hs944T lysates co-transfected with a constitutive active form of p110 (p110 CAAX) or a kinase-dead form (p110 KD) in the presence of GFP or PTEN. Western blot analyses were performed three to six times, depending on the antibody with similar outputs.
Figure 2
Figure 2. PTEN inhibits the CAV1/β-catenin immunocomplex.
(a) Interactome of PTEN and β-catenin (BCAT) as determined by the in silico Ingenuity Pathway Analysis (IPA). The Venn diagram reveals 63 common members. Interaction of CAV1 with β-catenin (BCAT; b) and PTEN (c) in Rosi human melanoma cells. Extracts from ∼1.5 × 10⁷ cells (corresponding to about 1.5 mg) were immunoprecipitated with control IgG, anti-BCAT, anti-CAV1 or anti-PTEN antibodies. Immune complexes were resolved by SDS–PAGE and blotted with antibodies to BCAT, CAV1 and PTEN. Total protein input corresponds to 2% of the total protein used for immunoprecipitation. One-tenth of the IP sample was loaded to detect BCAT following IP with BCAT antibodies (and similarly for CAV1 and PTEN). This allowed getting a reasonable intensity for the corresponding signals. For the other lanes, the entire IP samples were loaded. (d) GST pulldown using β-catenin–GST fusion Sepharose beads and whole-cell protein lysates (500 μg) from Hs944T cell transfection with GFP or PTEN. Pellet and supernatant fractions were immunoblotted for various antibodies. (e) CAV1-BCAT immunocomplex in GFP transiently transfected Hs944T cells. When transfected with PTEN, the proportion of β-catenin in the immunocomplex is dramatically reduced. Total protein input is shown. For be, experiments were performed three times. (fk) Immunofluorescence of transiently transfected Hs944T human melanoma cell line with CMV::GFP and CMV::CAV1-RFP (CAV1) expression vector. β-Catenin staining (f,i), GFP (g), CAV1 (j) and merged (h,k). Scale bar, 25 μm. Immunofluorescence experiments for Hs944T cells were performed three times with similar results. (lt) Immunofluorescence of mouse carcinoma submandibular gland (CSG) cells transfected with siRNA directed against either negative control (siScr), PTEN (siPTEN) and CAV1 (siCAV1) stained for BCAT (l,o,r), respectively. Cells were counterstained with 4,6-diamidino-2-phenylindole (DAPI) (m,p,s). Merge (n,q,t). Scale bar, 25 μm for all panels. Immunofluorescence experiments for the CSG cells were performed two times with similar results.
Figure 3
Figure 3. CAV1 regulates the transcriptional activity of β-catenin.
(a) TOP-FLASH activity in Hs944T cells in the presence of GFP, PTEN and/or CAV1 β-catenin (BCAT). (b) Similarly, TOP-FLASH activity was measured in the same cells post transfection of siRNA directed against negative control (siSCR), CAV1 (siCAV1), β-catenin (siBCAT). (c) Activity of p16INK4A::luciferase reporter was evaluated post transfection in Hs944T human melanoma cells with GFP, PTEN and/or CAV1 BCAT, and (d) with siSCR, siCAV1 and siBCAT. (ad) All p16INK4A::luciferase and TOP-FLASH reporter assays were evaluated in the presence of an internal control (Renilla luciferase). (e,f) p16 mRNA level as measured by quantitative reverse transcriptase–PCR (fold change), following overexpression of GFP, PTEN and/or CAV1 BCAT, or knockdown of CAV1 and BCAT, with appropriate controls. (g) Eighteen human melanoma tumours were stained for CAV1, PTEN and p16. PTEN and p16 were absent and CAV1 was present for patient 1. Opposite observation was performed for patient 2. Stromal and endothelial cells were used as positive control for PTEN and CAV1, respectively. Scale bar, 100 μm for all panels. Error bars represent s.d. *P-value <0.05, **P-value <0.01 and ***P-value <0.001. Statistical significance was determined by Mann–Whitney test. Each experiment was performed in eight and three biological triplicates for ad, e and f respectively.
Figure 4
Figure 4. NRASQ61K and PTEN loss cooperate during melanoma initiation.
(a) Human melanoma library containing 101 samples was subjected to immunohistochemical analysis for PTEN expression alongside NRAS mutational status. For each case type: the minimized window in the foreground represents the DNA sequence of NRAS at codon 61, while the background picture is the corresponding PTEN immunostaining. Arrowheads indicate blood vessels, internal positive control for PTEN expression. Vertical arrows indicate the location of the G to T mutation. Scale bar, 100 μm. (b) Kaplan–Meier (KM) melanoma-free mice analysis of ΔPTEN (n=19), NRAS (n=35) and NRAS-ΔPTEN mice (n=35). The KM curves between NRAS and NRAS-ΔPTEN are significantly different (P<10−5) using the Mantel–Cox test. NRAS=Tyr::NRASQ61K/°, ΔPTEN=Tyr::Cre/°; PTENf/+ and NRAS-ΔPTEN=Tyr::NRASQ61K/°; Tyr::Cre/°; PTENf/+. The mean number of melanomas per mouse was 1.6 and 2.1 for NRAS and NRAS-ΔPTEN mice, respectively, with a P-value of 0.37 (Student's t-test). (c) Tumour growths were measured and tabulated. The rate of growth of four representative tumours from NRAS and NRAS-ΔPTEN were plotted in relation to size during an 88-week interval. NRAS-ΔPTEN tumours averaged a steeper and earlier growth rate in comparison with NRAS controls. (d) Melanocytes were established from the skins of Tyr::Cre/°; PTENf/+ and Tyr::Cre/°; PTENf/f pups. Cells were directly counted every week and the growth curve was plotted as relative number of cells in log2 form (see Delmas et al.32). Each curve corresponds to the culture established from the back skin of a single pup. Cells with biallelic disruption of the PTEN gene, PTENf/f, bypassed efficiently senescence when comparing the heterozygous, PTENf/+. (e) p16 mRNA as measured by quantitative reverse transcriptase–PCR (fold change) transfection in normal human epithelial melanocyte (NHEM) (top panel) and Lyse human melanoma cell line (bottom panel) with GFP and PTEN expression vectors and with scramble (siScr) and PTEN (siPTEN) siRNA. Error bars represents.d. *P-value <0.05, **P-value <0.01 and ***P-value <0.001. Statistical significance was determined by Mann–Whitney test. Experiments were performed in biological triplicates.
Figure 5
Figure 5. NRAS ΔPTEN melanoma characteristics.
(a,b) Dorsal melanoma appearing in NRAS (a) and NRAS-ΔPTEN (b) mice (arrow). Melanoma arose from different part of the body including hairy part, pinnae and tails/paws (see Supplementary Table 1). (cf) Haematoxylin and eosin staining of an NRAS (c,e) and NRAS-ΔPTEN (d,f) cutaneous melanoma. (e,f) Higher magnification reveals irregularly shaped pigmented cells with diverse sizes and large nuclei. (g,h) Positive immunostaining for melanoma marker S100 in NRAS and NRAS-ΔPTEN tumours. (i) Positive Ki-67 staining of NRAS and NRAS-ΔPTEN tumour sections. (j) Graphical representation of the relative number of Ki-67-positive cells in NRAS and NRAS-ΔPTEN tumour sections. The relative number of Ki-67-positive cells correspond to the ratio of the number of Ki-67+ cells from identical surface in NRAS or NRAS-ΔPTEN tumour sections versus the number of Ki-67+ cells from identical surface in NRAS tumour sections. Statistical significance was determined by Mann–Whitney test. ***P-value <0.001. Five hundred cells were assessed from four fields and four independent experiments for each genotype. Scale bars, 100 μm (c,d), 10 μm (e,f), 50 μm (g,h) and 10 μm (i).
Figure 6
Figure 6. Immunoblot analysis of murine melanoma.
Immunoblot analysis of the MAPK and PI3K/AKT pathways reveals differential regulation of key proteins. Immunoblot analysis of protein lysates from eight murine uncultured melanoma samples: four from NRAS and four from NRAS-ΔPTEN. Western blot analyses were performed between three and six times, depending on the antibody with similar results.
Figure 7
Figure 7. PTEN loss induces ECAD internalization and metastasis.
(a) mRNA levels of ECAD (top), CAV1 (middle) and BCAT (bottom) in NRAS and NRAS-ΔPTEN mouse melanoma as measured by quantitative reverse transcriptase–PCR (fc, fold change). Experiments were performed three times. Error bars represent s.d. *P-value <0.05, **P-value <0.001. Statistical significance was determined by Mann–Whitney test. (b) Western blot analysis of uncultured whole tumour lysates from NRAS and NRAS-ΔPTEN using antibodies against BCAT (total and pSer675), PTEN, CAV1, ECAD and β-actin. Western blot analyses were performed at least two times depending on antibody. (c) Immunofluorescence of serial NRAS and NRAS-ΔPTEN tumour sections, stained for ECAD, CAV1 and BCAT. Scale bar, 10 μm. xz projection from confocal image stacks of β-catenin-stained NRAS and NRAS-ΔPTEN tumours counterstained with 4,6-diamidino-2-phenylindole (DAPI). Arrowheads indicate nucleus. Scale bar, 16 μm. Immunofluorescence experiments for the NRAS and NRAS-ΔPTEN tumour cryosections were performed two times with similar results. (d) Interaction of CAV1 with β-catenin (BCAT) in NRAS and NRAS-ΔPTEN tumour samples. Cell lysates containing 400 μg of total proteins were subjected to IP with an anti-CAV1 antibody. The co-IP of β-catenin with CAV1 was detected by western blotting (WB) using anti-β-catenin and anti-CAV1 antibodies. Total protein input is shown. This experiment was performed twice. (e) mRNA levels of downstream β-catenin target genes c-MYC and CCND1 as measured from NRAS and NRAS-ΔPTEN mouse melanoma by quantitative reverse transcriptase–PCR (fc, fold change). Error bars represent s.d. **P-value <0.01. Statistical significance was determined by Mann–Whitney test. (f) CAV1 and PTEN were detected by immunohistochemistry on a series of 50 human melanoma sections from the second cohort. Sections of patients were either AEC stained (red) for CAV1 (background image) or PTEN (foreground image, lower-right corner) and counterstained with haematoxylin (blue). Staining for CAV1 was scored as high or low, while the amount of PTEN as positive (pos) or negative (neg). Among 50 melanoma biopsies, 34 presented a low amount of CAV1 and a positive staining for PTEN (34/50). Scale bar, 100 μm.
Figure 8
Figure 8. β-catenin induces CAV1 through miR-199a and miR-203.
(a) miR-199a-5p and miR-203 gene expression in NRAS and NRAS-ΔPTEN mouse tumour samples from miRNA expression arrays. (b) CAV1 mRNA expression post transfection with miRNA mimics for miR-199a and miR-203 in human Hs944T melanoma cells (fc, fold change). CAV1 knockdown after miRNA mimics overexpression from whole-cell protein lysates in duplicates was validated through western blotting (below). Statistical significance was determined by Mann–Whitney test. (c) miR-199a-5p and miR-203 gene expression in Hs944T after overexpression with miR mimic 199a-5p and 203, respectively (fold change). Error bars represent s.d. **P-value <0.01. Statistical significance was determined by Mann–Whitney test. (d) miRNA levels as determined by quantitative reverse transcriptase–PCR (fold change) of mir-203 and mir-199a in Hs944T post siRNA-mediated knockdown of β-catenin (siBCAT) or conversely overexpression of BCAT. Statistical significance was determined by Mann–Whitney test. (e) CAV1 mRNA levels after either siBCAT or BCAT overexpression in Hs944T cells. Whole-cell protein lysates were analysed via western blot (see below). Error bars represent s.d. *P-value <0.05, **P-value <0.01 and ***P-value <0.001. Statistical significance was determined by Mann–Whitney test. Experiments were performed in biological triplicates.

References

    1. Dhomen N. et al. Oncogenic Braf induces melanocyte senescence and melanoma in mice. Cancer Cell 15, 294–303 (2009). - PubMed
    1. Michaloglou C. et al. BRAFE600-associated senescence-like cell cycle arrest of human naevi. Nature 436, 720–724 (2005). - PubMed
    1. Ackermann J. et al. Metastasizing melanoma formation caused by expression of activated N-RasQ61K on an INK4a-deficient background. Cancer Res. 65, 4005–4011 (2005). - PubMed
    1. Barradas M. et al. Histone demethylase JMJD3 contributes to epigenetic control of INK4a/ARF by oncogenic RAS. Genes Dev. 23, 1177–1182 (2009). - PMC - PubMed
    1. Shakhova O. et al. Sox10 promotes the formation and maintenance of giant congenital naevi and melanoma. Nat. Cell Biol. 14, 882–890 (2012). - PubMed

Publication types

MeSH terms