. 2015 Aug 25;112(34):E4762-71.
doi: 10.1073/pnas.1423228112. Epub 2015 Aug 11.

Epigenetic mechanisms, T-cell activation, and CCR5 genetics interact to regulate T-cell expression of CCR5, the major HIV-1 coreceptor

Affiliations

Epigenetic mechanisms, T-cell activation, and CCR5 genetics interact to regulate T-cell expression of CCR5, the major HIV-1 coreceptor

German G Gornalusse et al. Proc Natl Acad Sci U S A. .

Abstract

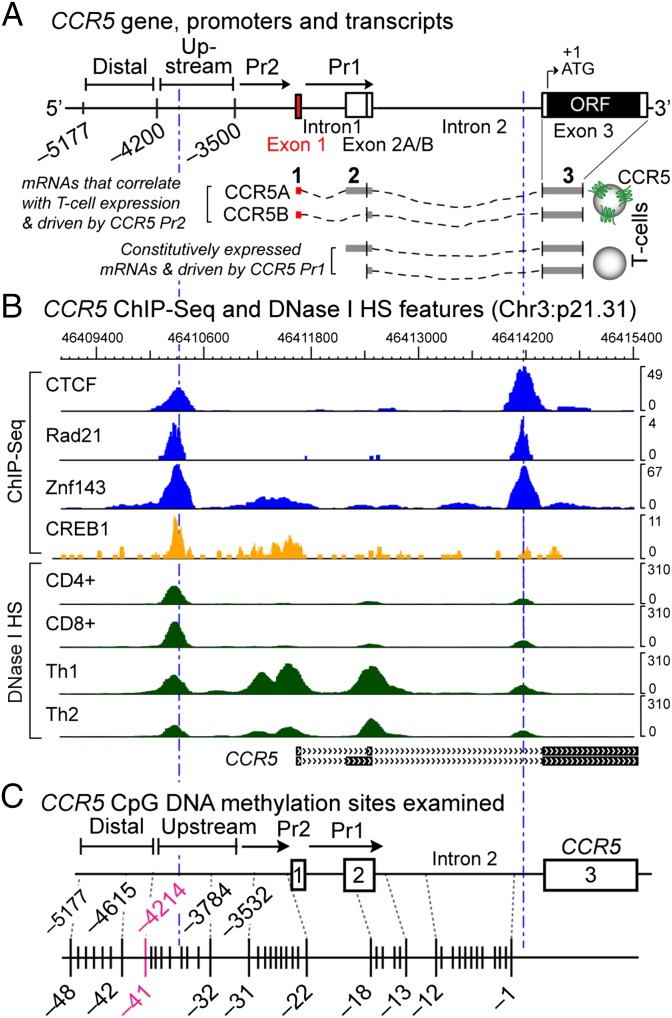
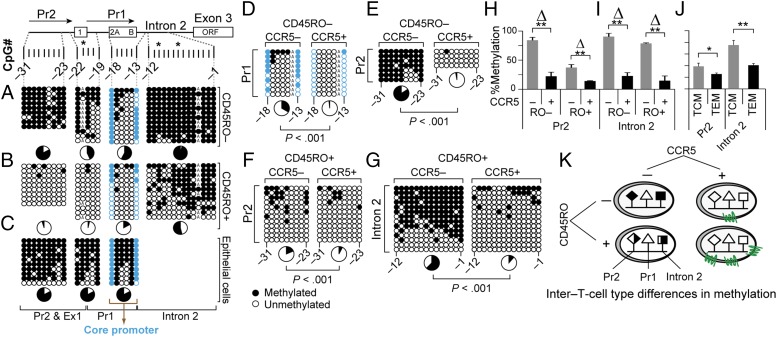
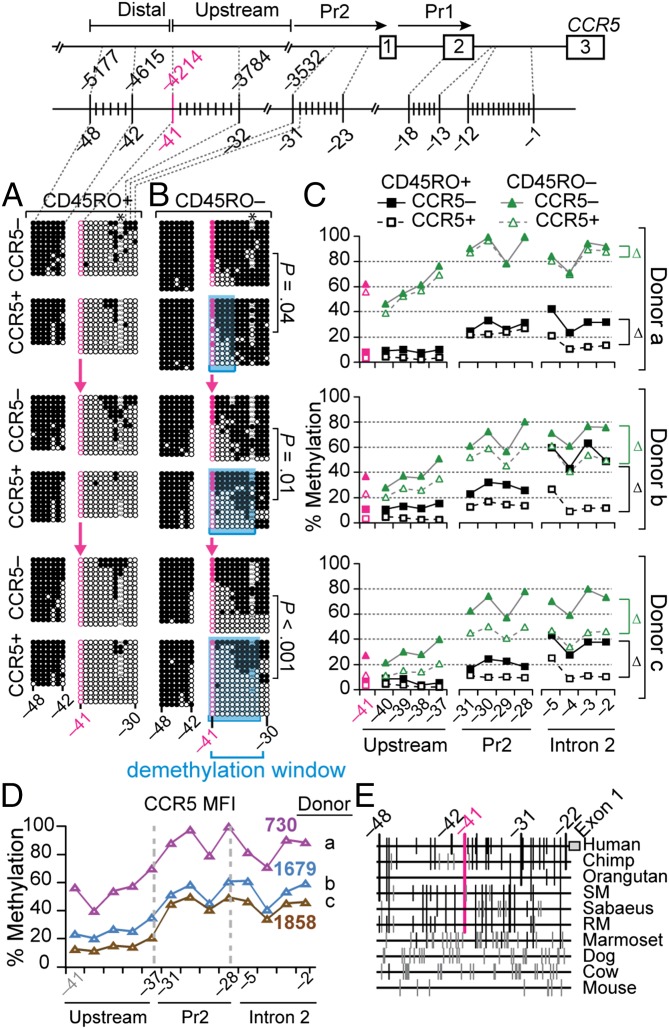
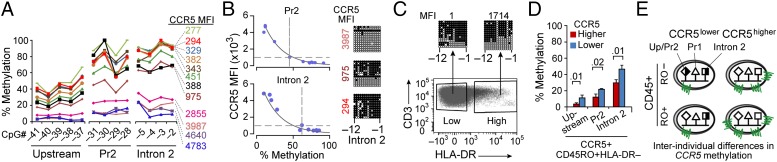
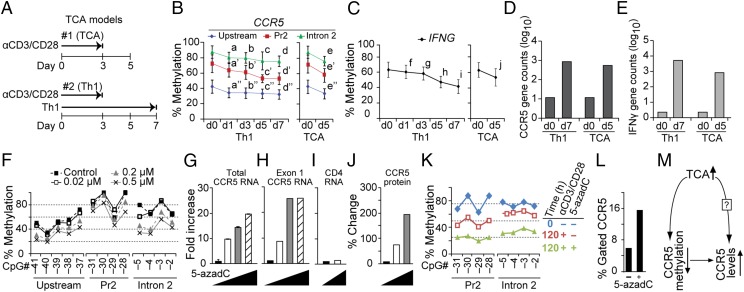
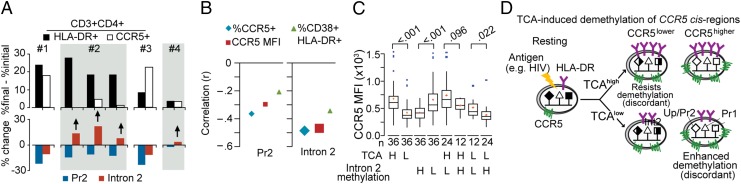
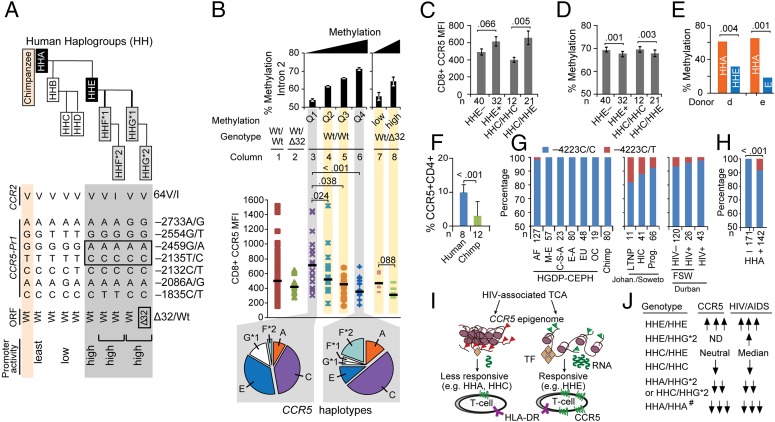
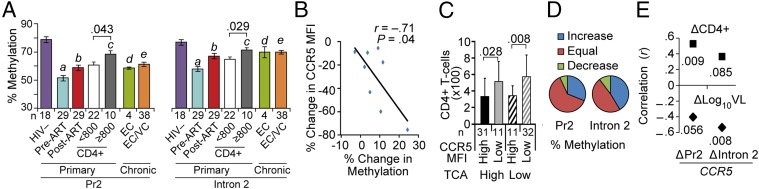
T-cell expression levels of CC chemokine receptor 5 (CCR5) are a critical determinant of HIV/AIDS susceptibility, and manifest wide variations (i) between T-cell subsets and among individuals and (ii) in T-cell activation-induced increases in expression levels. We demonstrate that a unifying mechanism for this variation is differences in constitutive and T-cell activation-induced DNA methylation status of CCR5 cis-regulatory regions (cis-regions). Commencing at an evolutionarily conserved CpG (CpG -41), CCR5 cis-regions manifest lower vs. higher methylation in T cells with higher vs. lower CCR5 levels (memory vs. naïve T cells) and in memory T cells with higher vs. lower CCR5 levels. HIV-related and in vitro induced T-cell activation is associated with demethylation of these cis-regions. CCR5 haplotypes associated with increased vs. decreased gene/surface expression levels and HIV/AIDS susceptibility magnify vs. dampen T-cell activation-associated demethylation. Methylation status of CCR5 intron 2 explains a larger proportion of the variation in CCR5 levels than genotype or T-cell activation. The ancestral, protective CCR5-HHA haplotype bears a polymorphism at CpG -41 that is (i) specific to southern Africa, (ii) abrogates binding of the transcription factor CREB1 to this cis-region, and (iii) exhibits a trend for overrepresentation in persons with reduced susceptibility to HIV and disease progression. Genotypes lacking the CCR5-Δ32 mutation but with hypermethylated cis-regions have CCR5 levels similar to genotypes heterozygous for CCR5-Δ32. In HIV-infected individuals, CCR5 cis-regions remain demethylated, despite restoration of CD4+ counts (≥800 cells per mm(3)) with antiretroviral therapy. Thus, methylation content of CCR5 cis-regions is a central epigenetic determinant of T-cell CCR5 levels, and possibly HIV-related outcomes.

Keywords: CCR5; HIV; T-cell activation; methylation; polymorphism.


Conflict of interest statement

The authors declare no conflict of interest.

Figures

Fig. 1.
Fig. 1.
CCR5 gene, mRNA structure, and transcriptional and DNA methylation landmarks. (A) Three-exon CCR5 gene structure, two promoters, and exon 1-containing (full-length) vs. -lacking (truncated) mRNA isoforms (6). The upstream region starts ∼4.2 kb upstream of the ORF and indicates where increased micrococcal nuclease (Mnase) accessibility is apparent in memory cells compared with naïve cells (6). (B) Wiggle plots depict colocalization of CTCF, cohesin component Rad21, Znf143, and the transcription factor CREB1 (by ChIP-seq in GM12878 lymphoblastoid cells) and DNase I hypersensitivity sites in primary CD4+ and CD8+ T cells and Th1 and Th2 cells; derived from publicly available data. (C) CpG sites examined.
Fig. 2.
Fig. 2.
Distribution of DNA methylation content in CCR5-Pr2, -Pr1, and -intron 2 in T-cell subsets. (AG) Methylation content of the indicated CpGs derived by bisulfite genomic sequencing (BGS) in (A) CD3+CD4+CD45RO− T cells; (B) CD3+CD4+CD45RO+ T cells; (C) oral epithelial cells; and (DG) CCR5− or CCR5+ CD3+CD45RO− and CD3+CD45RO+ T cells. Each column represents the CpG site interrogated, and each row represents a single clone. Closed and open circles represent methylated and unmethylated CpG sites, respectively. The asterisks indicate a haplotype-specific polymorphism; CpG −4 is disrupted in one allele due to a private polymorphism in the donor shown in A and B. Pie charts, % methylation; CpGs −18 and −13 (blue) encompass a core of constitutively demethylated CpGs within CCR5-Pr1 in T cells. (HJ) Methylation content assessed by pyrosequencing of four representative CpGs located within (H) CCR5-Pr2 (CpG −31 to −28) and (I) intron 2 (CpG −5 to −2) in cell-sorted CCR5+ and CCR5− CD3+ T cells and (J) central memory (TCM; CD45RA−CD45RO+CCR7+) and effector memory (TEM; CD45RA−CD45RO+CCR7−) T cells. The pyrosequencing data are depicted as mean percentage methylation and error bars depict the standard error of the mean (SEM). Data are from three donors. **P < 0.01 and *P < 0.05, small vs. larger Δ, relative difference in methylation content. (K) Schema depicting the relative methylation content of CCR5-Pr2 and CCR5-intron 2 in cell-sorted CCR5-positive and CCR5-negative CD45RO+ and CD45RO− T cells, supporting criterion 1.
Fig. 3.
Fig. 3.
Contrasting distribution of methylation content across an evolutionarily conserved CpG site distinguishes CCR5+ vs. CCR5− CD45RO+ or CD45RO− T cells. (A and B) CpG −41 (indicated in pink) is a transitional boundary from high to low methylation in the CCR5 locus in the indicated T-cell subsets. CpGs −41 and −32 demarcate a variable demethylation window shown in blue in CCR5+CD45RA+CD45RO− T cells, the length of which associates with CCR5 levels. Data are from three independent donors (denoted as donors a–c in C and D). P values, by χ2 for comparisons of the methylation content of CCR5+ vs. CCR5− sorted T cells. Closed and open circles represent methylated and unmethylated CpG sites, respectively. Absence of circles indicates polymorphisms or no data available. The asterisks indicate a polymorphism at CpG −33 in selected clones. The pink arrows indicate CpG −41 that marks the transition in methylation status. (C) Percent methylation (assessed by pyrosequencing) of the indicated CpG sites in the same T-cell subsets shown in A and B. Δ refers to the relative differences of methylation levels between CCR5+ vs. CCR5− CD45RA−CD45RO+ or CD45RA+CD45RO− CD8+ T cells in each of the three cis-regions examined. (D) Mean fluorescence intensity (MFI) after sorting of CCR5+CD45RA+CD45RO− CD8+ T cells (same donors as in AC) and corresponding methylation levels (assessed by pyrosequencing) at the indicated CpG sites. (E) Multispecies alignment of CpG sites upstream of exon 1 in CCR5. Chimp, chimpanzee; RM, rhesus macaque; SM, sooty mangabey. Lines connecting the data points in this figure are provided for better visualization of the data.
Fig. 4.
Fig. 4.
Methylation content of CCR5 cis-regulatory regions as a basis for interindividual differences in CCR5 levels on T cells. (A) Methylation content at the indicated CpGs in sorted CCR5+CD3+ T cells obtained from four healthy donors with the indicated postsort levels of CCR5 MFI (four gates per donor), assessed by pyrosequencing of representative sites. Lines connecting the data points are provided for better visualization of the data. (B) Relationship between methylation status of CCR5 cis-regions (promoter 2 and intron 2) and CCR5 levels (MFI). The line of best fit was determined by fitting the data to a generalized linear model using the exponential distribution. CCR5 methylation was calculated as average percent methylation in indicated cis-regions from pooled data from the same donors as in A. (Right) BGS validation of the inverse correlation between CCR5 expression and DNA methylation content of the indicated CpGs in CCR5-intron 2 derived from CCR5+ T cells with the indicated postsort MFI. (C) HLA-DR+ CD3+ T cells were sorted based on HLA-DR MFI using two arbitrarily set cell-sorting gates designated as low and high HLA-DR–expressing T cells. The methylation content in the sorted cells was determined by BGS. The numbers above the BGS data indicate HLA-DR+ MFI in postsorted T-cell fractions. (D) Methylation levels assessed by pyrosequencing of representative CpGs in the indicated CCR5 cis-regions in CCR5+CD45RO+HLA-DR− CD4+ T cells from three HIV− persons with higher and three persons with lower CCR5 expression (for results from CCR5+CD45RO+HLA-DR+ CD4+ T cells, see SI Appendix, Fig. S3A). The mean percentage methylation values are shown and the error bars depict SEM. (E) Model based on criterion 2.
Fig. 5.
Fig. 5.
T-cell activation- and/or 5-azadC–induced demethylation of CCR5 cis-regions. (A) Schema of T-cell activation (TCA) models: in vitro TCA (model 1) and Th1 polarization of naïve T cells (model 2). Durations of culture periods with or without TCR (T-cell receptor) stimulation are shown. (B and C) Methylation levels of the indicated cis-regions of (B) CCR5 and (C) CpG sites in IFNG at the indicated time points after in vitro Th1 polarization (Left) or TCA (Right). For IFNG the average methylation content of the six CpG sites in three independent donors is shown. For CCR5 the CpG sites are the same as those examined in Fig. 4A. Error bars indicate SD. Letters denote significant P values by paired Student’s t test for the comparison of each time point at which methylation was assessed relative to the methylation values at baseline (t = 0) and are as follows: for a–j, 0.006, 0.002, 0.009, 0.002, 0.011, 0.093, 0.017, 0.001, 0.002, and 0.029, respectively; for a′–e′, 0.016, 0.017, 0.014, 0.003, and 0.006, respectively; and for a′′–e′′, 0.001, 0.000, 0.001, <0.0001, and <0.0001, respectively. (D and E) CCR5 and IFNG mRNA expression at the indicated time points post Th1 polarization or TCA. The y axis is the log10-transformed raw gene expression signals obtained by RNA-seq. Data are representative of one of three experiments. (F) 5-AzadC dose-dependent DNA demethylation of CCR5 cis-regions in the Jurkat T-cell line. Methylation was assessed by pyrosequencing at the indicated CpG sites in untreated Jurkat cells (closed squares) and treated with 0.02 (open squares), 0.2 (gray triangles), and 0.5 µM 5-azadC (crosses). (GI) mRNA quantification of (G) total CCR5 mRNA isoforms, (H) CCR5 exon 1-containing transcripts, and (I) CD4 transcripts, all evaluated by quantitative RT-PCR. Data represent fold increase relative to untreated. The error bars in G represent ± SEM. 18S rRNA levels were used for normalization. Increasing concentrations of 5-azadC are represented by triangles (doses are indicated in F). (J) Plots represent the densitometric analysis of CCR5 expression in 5-azadC–treated Jurkat cells. The relative fluorescence intensities were assessed by confocal microscopy (SI Appendix, Fig. S4) and measured using NIH ImageJ software. Signals were normalized relative to actin. (K) Methylation content of the indicated CCR5 CpGs in PBMCs derived from one representative HIV− donor before (blue; t = 0 h) and after 120 h of TCA without 5-azadC (red; t = 120 h) and in the presence of 1 µM 5-azadC (green). (L) CCR5 surface expression (denoted as percent gated cells) after 120 h of TCA in the absence (−) or presence (+) of 1 µM 5-azadC. The data shown are representative of one of three experiments. (M) Three-way relationship between TCA, CCR5 methylation status, and CCR5 surface levels. ?, up-regulation via other mechanisms.
Fig. 6.
Fig. 6.
Interindividual differences in sensitivity of CCR5 cis-regions to HIV- or activation-induced demethylation. (A) In vitro TCR activation-induced demethylation of CCR5 cis-regions and the relationship to CCR5 levels and T-cell activation. Changes in (Top) CCR5 and HLA-DR expression on CD3+CD4+ T cells and (Bottom) % methylation of representative CpGs in CCR5-Pr2 and CCR5-intron 2 obtained by pyrosequencing. Changes were assessed in PBMCs from six representative blood donors stimulated with anti-CD3/CD28 antibodies (19) (the protocol is in Fig. 5A). Data were computed from results at t = 0 h and t = 120 h of the TCA protocol. (B) Correlation (Pearson’s r) between % methylation of CpGs in CCR5-Pr2 (Left) and CCR5-intron 2 (Right) with % CCR5+, CCR5 MFI, and % CD38+HLA-DR+ CD8+ T cells. Large- and small-sized symbols indicate P < 0.01 and P < 0.05, respectively. Data are from 85 HIV+ individuals from the SCOPE (Observational Study of the Consequences of the Protease Inhibitor Era) cohort with ART-induced viral load suppression. (C) Box plots depict the CCR5 levels (MFI) on CD8+ T cells according to whether the activation levels were higher (H) vs. lower (L) than the median TCA in the overall cohort (activation was measured as % CD8+CD38+HLA-DR+ T cells) and/or whether the methylation levels of CCR5-intron 2 were higher vs. lower than median methylation content in this cis-region in the overall cohort. Data are from 72 individuals receiving ART (excluded those bearing the Δ32 mutation). P values are indicated between the groups. Horizontal line in the box, median; ends of the boxes, upper and lower quartiles; red dots in the box, mean; blue dots outside the box, outliers. (D) Model supporting criterion 3.
Fig. 7.
Fig. 7.
Associations among HIV/AIDS-modifying polymorphisms in CCR5 with increased vs. decreased sensitivity of CCR5 cis-regions to undergoing HIV- or activation-associated demethylation. (A) Polymorphisms in the coding regions of CCR5 [wild type (Wt) vs. Δ32] and CCR2 (V64I) and the CCR5 promoter were categorized into CCR5 human haplogroups (HH) A–G*2 using an evolutionarily based strategy (6). HHF*2 and HHG*2 represent the CCR2-64I– and CCR5-Δ32–containing haplotypes, respectively. Relative haplotype-specific promoter activity assessed by transcriptional reporter assays is indicated (Bottom) (8). (B) Association between DNA methylation (assessed by pyrosequencing of representative CpGs in CCR5-intron 2) and CCR5 levels on CD8+ T cells in 85 HIV+ individuals with stably suppressed viral load (from the SCOPE cohort). Before accounting for methylation content, CCR5 levels (MFI; ordinate) were assessed in subjects dichotomized as those lacking CCR5-Δ32 (Wt/Wt; n = 72) vs. those possessing a CCR5-Δ32 allele (Wt/Δ32; n = 13). Wt/Δ32 persons had a haploid range of CCR5 expression compared with Wt/Wt subjects (columns 1 and 2, respectively). CCR5 levels in Wt/Wt individuals were derived according to the quartiles of the average percent methylation of the representative CpGs in intron 2 (Top; columns 3–6). CCR5 levels in persons with the Wt/Δ32 genotype were dichotomized according to the median of the overall methylation content in intron 2 in these individuals (columns 7 and 8; low vs. high). Horizontal black lines indicate the median values of CCR5 MFI in each group. Pie charts show the frequency of the CCR5 haplotypes in individuals with Wt/Wt genotype whose methylation content in CCR5-intron 2 classified to the least (column 3) and most (column 6) methylated quartiles (Left and Right pie charts, respectively). P values are shown for the differences in CCR5 surface expression according to quartiles of intron 2 methylation in Wt/Wt subjects (with Q1 as the reference) and high vs. low methylation in CCR5-Δ32 heterozygotes. The error bars represent SEM. (C and D) Mean CCR5 expression (C) and mean percentage methylation level of representative CpGs in CCR5-intron 2 (D) in the same individuals (n = 72), categorized by whether they possessed (+) or lacked (−) at least one CCR5-HHE haplotype and whether they possessed the HHC/HHC vs. HHC/HHE genotypes. The error bars represent SEM. (E) In two healthy donors with the CCR5-HHA/HHE genotype, HHA-specific and HHE-specific methylation content was determined by bisulfite genomic sequencing after in vitro TCR stimulation (120 h) with anti-CD3/CD28 Abs. The rs2227010 polymorphism was used to discriminate HHA- vs. HHE-derived clones. (F) Percentage of CD4+ T cells expressing CCR5 in chimpanzee and HIV− humans. The error bars represent SEM. (G) Genotype frequency of CCR5 −4223C/T (rs553615728) in (i) the Human Genome Diversity Project (HGDP)-Centre d'Étude du Polymorphisme Humain (CEPH) populations (AF, Africa; C-S-A, Central South Asia; E-A, East Asia; EU, Europeans; M-E, Middle East; OC, Pacific Ocean) and 80 chimpanzee samples previously studied (44) (Left); (ii) black South Africans from Johannesburg/Soweto (Johan./Soweto) categorized as long-term nonprogressors (LTNP), HIV controllers (HIC), and progressors (Prog.), as defined in SI Appendix, Materials and Methods (Middle); and (iii) black female sex workers (FSW) from Durban, KwaZulu-Natal (CAPRISA cohort), South Africa categorized as those who remained HIV-seronegative (≥2 y follow-up; HIV−) vs. those who acquired HIV during follow-up (HIV+) and a separate cohort of women from the same region who were recruited during primary HIV infection (Right). The differences in genotype frequency should be compared separately in the study groups from the Johannesburg/Soweto and Durban sites, because geographic differences in SNP frequency may exist between these two sites. (H) Linkage disequilibrium of −4223T with CCR5-HHA. Data are from persons of African descent shown in G. (I) Model supporting criterion 4. TF, transcription factor. Red and green triangles represent histone marks. (J) Previously described associations of CCR5 haplotype pairs with CCR5 expression and HIV/AIDS susceptibility. #, inferred from chimpanzee. P values are shown for the compared groups in CF and H.
Fig. 8.
Fig. 8.
Associations of DNA methylation status in HIV-infected patients. (A) Methylation status of representative CpGs in CCR5-Pr2 and CCR5-intron 2 assessed by pyrosequencing in PBMCs of (i) HIV-seronegative (HIV−) healthy persons; (ii) HIV+ individuals recruited during acute infection in whom methylation status was evaluated before (pre-ART) and after (post-ART) suppression of viral replication by ART initiated during acute infection; or (iii) elite or viremic controllers (EC/VC) accrued during acute infection (cohort from ii) or chronic infection in the SCOPE cohort. Significance values are for the following comparisons: a, pre-ART HIV+ vs. HIV−; b, pre-ART vs. post-ART; c, post-ART with CD4+ ≥800 cells per μL vs. HIV−; and d and e, EC or EC/VC vs. HIV−; ae were each P < 0.001. Mean percentage methylation is shown and the error bars represent SEM. (B) Relationship between changes in CCR5 levels on CD8+ T cells and CCR5-intron 2 methylation content during ART in eight paired HIV+ subjects from SCOPE. (C) Conjoint impact of CCR5 expression and T-cell activation levels (% CD8+CD38+HLA-DR+ T cells) on current CD4+ T-cell counts in the 85 viral load-suppressed HIV+ subjects from SCOPE. Higher vs. lower activation was defined by whether values were higher vs. lower than the median. The mean cell counts are shown and the error bars represent standard deviation. (D) Changes in methylation content in 29 HIV+ therapy-naïve black women from Durban, South Africa (CAPRISA cohort). The net change in % methylation between two time points during early HIV infection was classified into three groups depending on whether the percent methylation of representative CpG sites in CCR5-Pr2 and CCR5-intron 2 increased or decreased at least 5%; otherwise they were considered to be “equal.” (E) Correlation (Spearman’s r) between net change (Δ) in methylation in CCR5-Pr2 and CCR5-intron 2 (i.e., ΔCCR5-Pr2 and ΔCCR5-intron 2; Bottom) observed in two paired samples with net change in log10 viral load (Bottom; ΔLog10VL) and CD4+ T-cell counts (Top; ΔCD4). Significance values for correlations are indicated.

References

    1. Corbeau P, Reynes J. CCR5 antagonism in HIV infection: Ways, effects, and side effects. AIDS. 2009;23(15):1931–1943. - PubMed
    1. Paxton WA, et al. Reduced HIV-1 infectability of CD4+ lymphocytes from exposed-uninfected individuals: Association with low expression of CCR5 and high production of beta-chemokines. Virology. 1998;244(1):66–73. - PubMed
    1. Reynes J, Baillat V, Portales P, Clot J, Corbeau P. Low CD4+ T-cell surface CCR5 density as a cause of resistance to in vivo HIV-1 infection. J Acquir Immune Defic Syndr. 2003;34(1):114–116. - PubMed
    1. Hladik F, et al. Combined effect of CCR5-delta32 heterozygosity and the CCR5 promoter polymorphism −2459 A/G on CCR5 expression and resistance to human immunodeficiency virus type 1 transmission. J Virol. 2005;79(18):11677–11684. - PMC - PubMed
    1. Catano G, et al. Concordance of CCR5 genotypes that influence cell-mediated immunity and HIV-1 disease progression rates. J Infect Dis. 2011;203(2):263–272. - PMC - PubMed

Publication types