

A Context-Aware EEG Headset System for Early Detection of Driver Drowsiness
- PMID: 26308002
- PMCID: PMC4570452
- DOI: 10.3390/s150820873
A Context-Aware EEG Headset System for Early Detection of Driver Drowsiness
Abstract
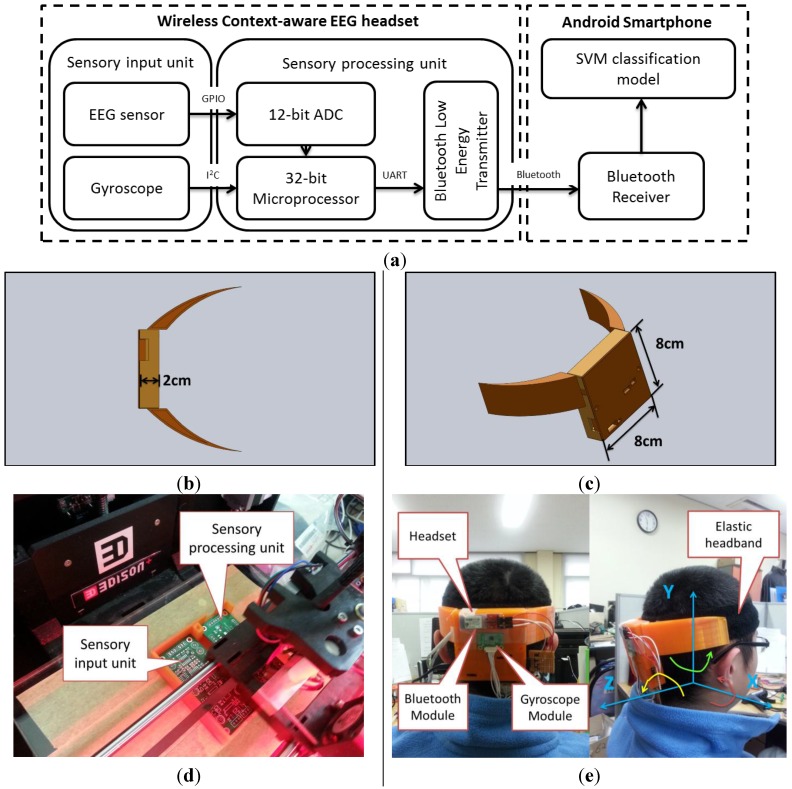
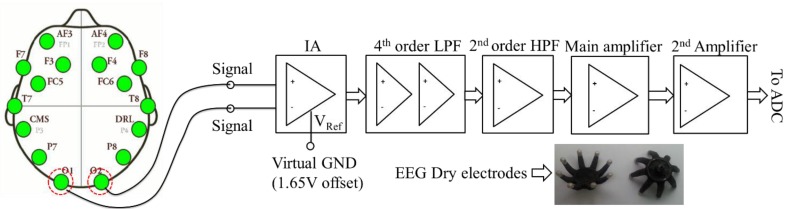
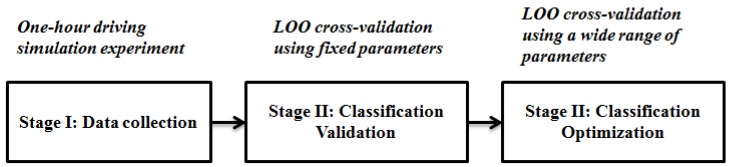
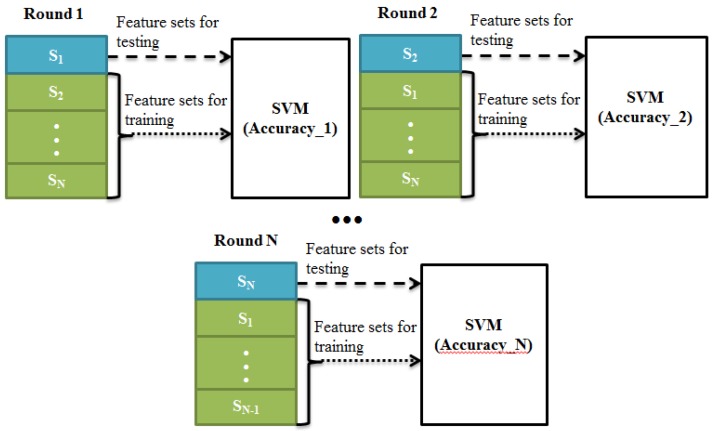
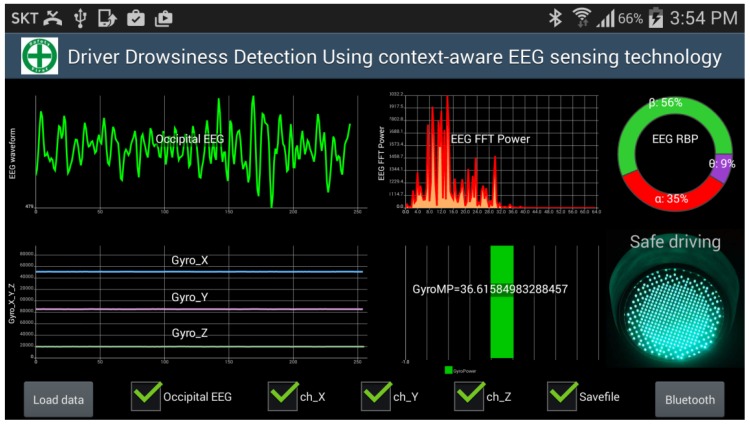
Driver drowsiness is a major cause of mortality in traffic accidents worldwide. Electroencephalographic (EEG) signal, which reflects the brain activities, is more directly related to drowsiness. Thus, many Brain-Machine-Interface (BMI) systems have been proposed to detect driver drowsiness. However, detecting driver drowsiness at its early stage poses a major practical hurdle when using existing BMI systems. This study proposes a context-aware BMI system aimed to detect driver drowsiness at its early stage by enriching the EEG data with the intensity of head-movements. The proposed system is carefully designed for low-power consumption with on-chip feature extraction and low energy Bluetooth connection. Also, the proposed system is implemented using JAVA programming language as a mobile application for on-line analysis. In total, 266 datasets obtained from six subjects who participated in a one-hour monotonous driving simulation experiment were used to evaluate this system. According to a video-based reference, the proposed system obtained an overall detection accuracy of 82.71% for classifying alert and slightly drowsy events by using EEG data alone and 96.24% by using the hybrid data of head-movement and EEG. These results indicate that the combination of EEG data and head-movement contextual information constitutes a robust solution for the early detection of driver drowsiness.
Keywords: EEG; driver drowsiness detection; gyroscope; mobile application; slightly drowsy events.
Figures
Similar articles
-
Electroencephalogram-Based Approaches for Driver Drowsiness Detection and Management: A Review.Sensors (Basel). 2022 Jan 31;22(3):1100. doi: 10.3390/s22031100. Sensors (Basel). 2022. PMID: 35161844 Free PMC article. Review.
-
A Hybrid Approach to Detect Driver Drowsiness Utilizing Physiological Signals to Improve System Performance and Wearability.Sensors (Basel). 2017 Aug 31;17(9):1991. doi: 10.3390/s17091991. Sensors (Basel). 2017. PMID: 28858220 Free PMC article.
-
A portable device for real time drowsiness detection using novel active dry electrode system.Annu Int Conf IEEE Eng Med Biol Soc. 2009;2009:3775-8. doi: 10.1109/IEMBS.2009.5334491. Annu Int Conf IEEE Eng Med Biol Soc. 2009. PMID: 19964814
-
A novel convolutional neural network method for subject-independent driver drowsiness detection based on single-channel data and EEG alpha spindles.Proc Inst Mech Eng H. 2021 Sep;235(9):1069-1078. doi: 10.1177/09544119211017813. Epub 2021 May 24. Proc Inst Mech Eng H. 2021. PMID: 34028321
-
Detecting driver drowsiness based on sensors: a review.Sensors (Basel). 2012 Dec 7;12(12):16937-53. doi: 10.3390/s121216937. Sensors (Basel). 2012. PMID: 23223151 Free PMC article. Review.
Cited by
-
Research on the Relationship between Reaction Ability and Mental State for Online Assessment of Driving Fatigue.Int J Environ Res Public Health. 2016 Nov 24;13(12):1174. doi: 10.3390/ijerph13121174. Int J Environ Res Public Health. 2016. PMID: 27886139 Free PMC article.
-
On-Road Detection of Driver Fatigue and Drowsiness during Medium-Distance Journeys.Entropy (Basel). 2021 Jan 21;23(2):135. doi: 10.3390/e23020135. Entropy (Basel). 2021. PMID: 33494447 Free PMC article.
-
3D Printable Dry EEG Electrodes with Coiled-Spring Prongs.Sensors (Basel). 2020 Aug 21;20(17):4733. doi: 10.3390/s20174733. Sensors (Basel). 2020. PMID: 32825762 Free PMC article.
-
Driver Drowsiness Detection Based on Steering Wheel Data Applying Adaptive Neuro-Fuzzy Feature Selection.Sensors (Basel). 2019 Feb 22;19(4):943. doi: 10.3390/s19040943. Sensors (Basel). 2019. PMID: 30813386 Free PMC article.
-
Electroencephalogram-Based Approaches for Driver Drowsiness Detection and Management: A Review.Sensors (Basel). 2022 Jan 31;22(3):1100. doi: 10.3390/s22031100. Sensors (Basel). 2022. PMID: 35161844 Free PMC article. Review.
References
-
- Kim I.S. The risk of accidents using DMB and smartphone when driving. Traffic. 2012;172:32–36.
-
- Korean Expressway Corporation 24% Decrease in Death in Highway Traffic Accidents Last Year. Yearly Report. [(accessed on 18 August 2014)]. Available online: http://www.ex.co.kr/portal/cus/public_relations/press_release/1197307_39....
-
- Korean Expressway Corporation Significant Decrease in Death in Highway Traffic Accidents. Yearly Report. [(accessed on 18 August 2014)]. Available online: http://www.ex.co.kr/portal/cus/public_relations/press_release/1194829_39....
Publication types
MeSH terms
LinkOut - more resources
Full Text Sources
Other Literature Sources
