. 2015 Aug 26;10(8):e0134386.
doi: 10.1371/journal.pone.0134386. eCollection 2015.

Hypoperfusion of the Adventitial Vasa Vasorum Develops an Abdominal Aortic Aneurysm

Affiliations

Hypoperfusion of the Adventitial Vasa Vasorum Develops an Abdominal Aortic Aneurysm

Hiroki Tanaka et al. PLoS One. .

Abstract

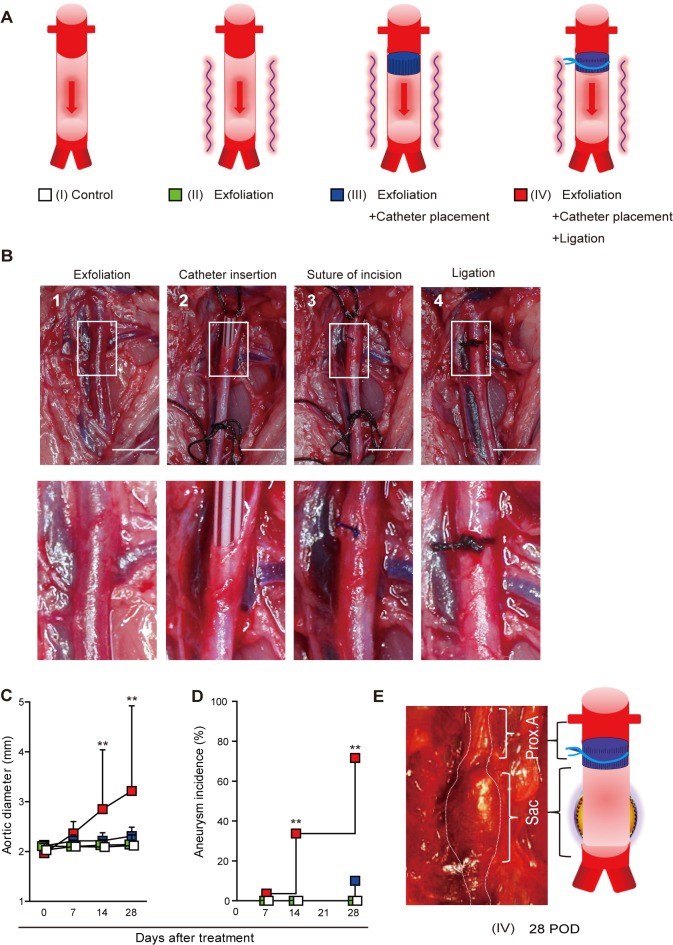
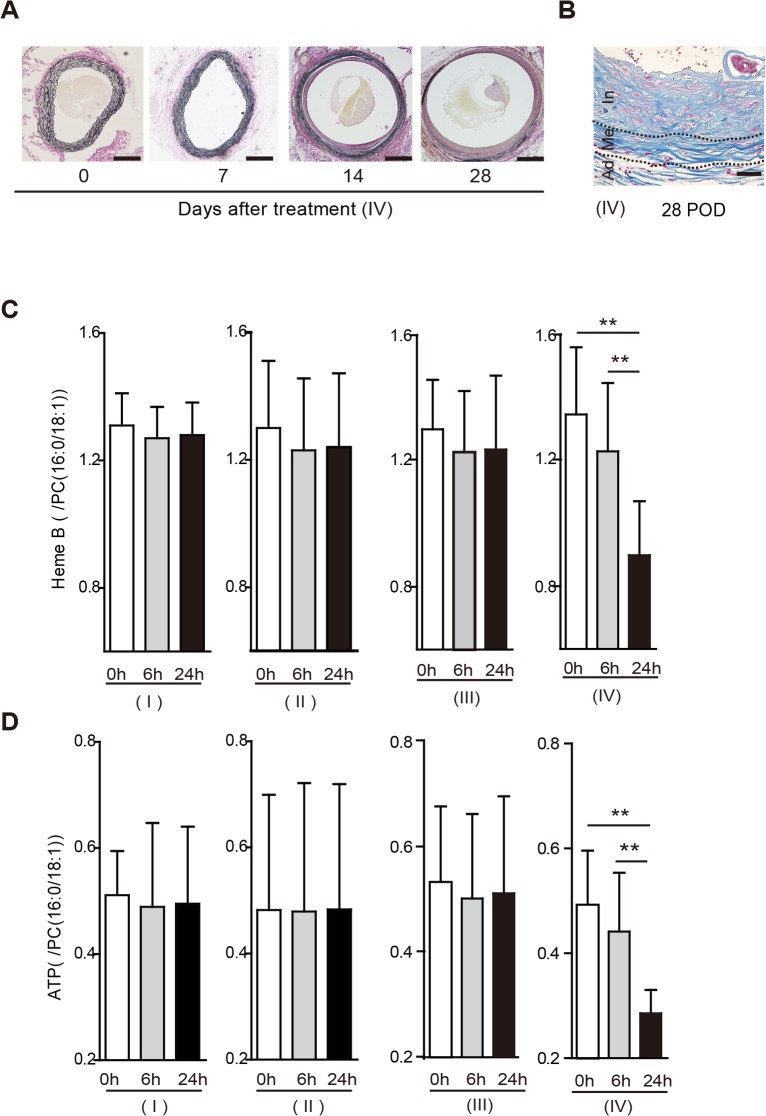
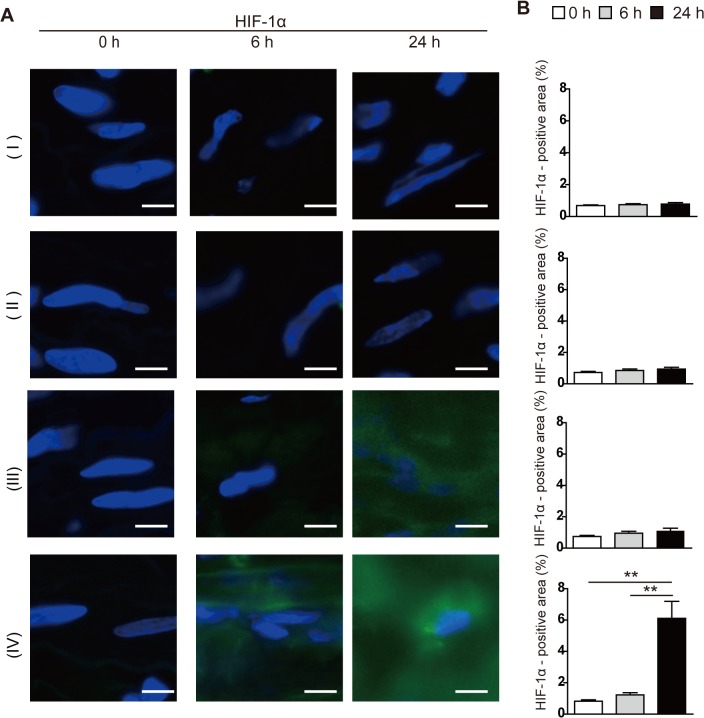
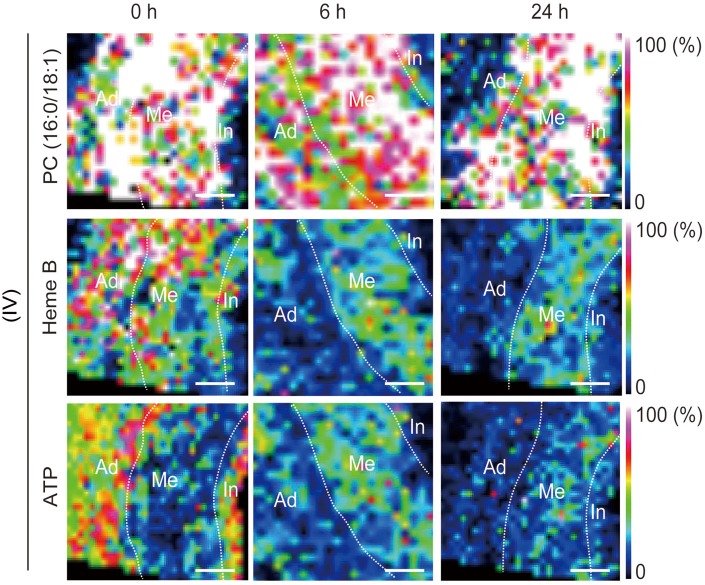
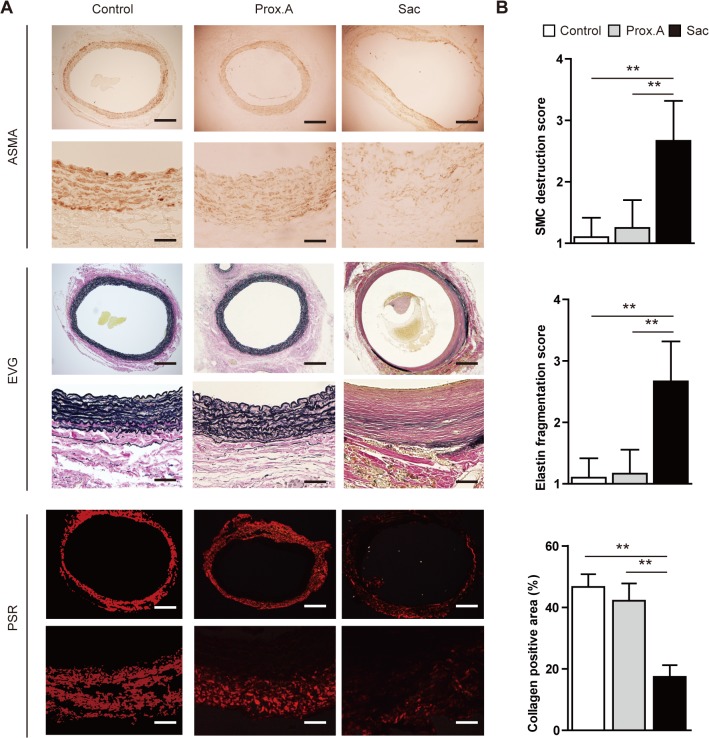
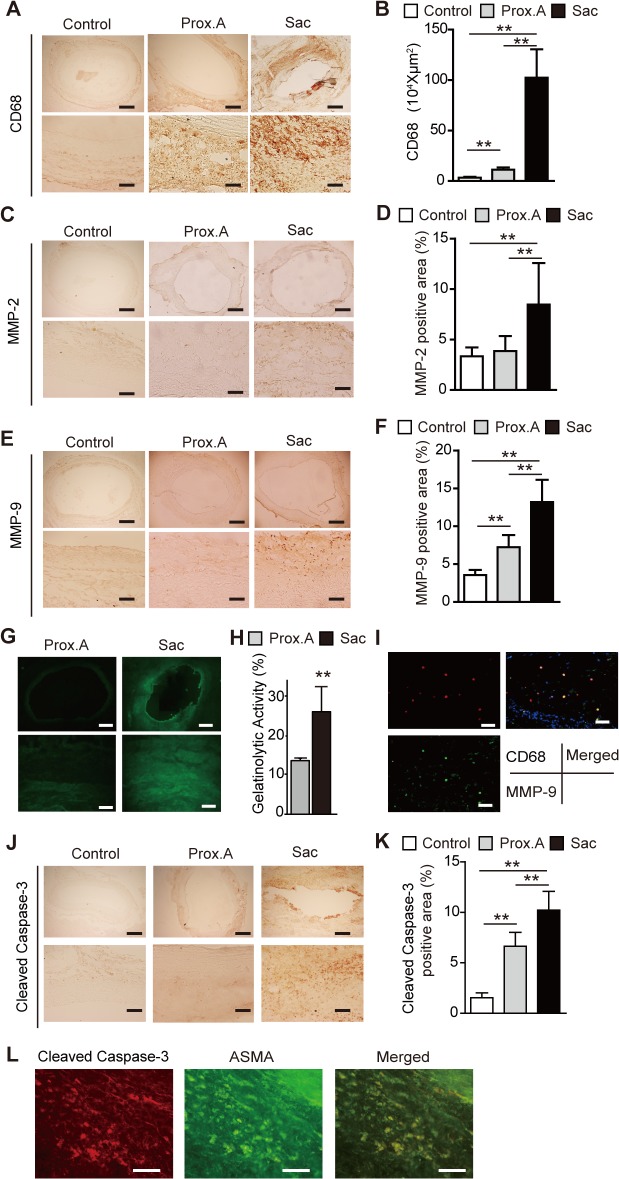
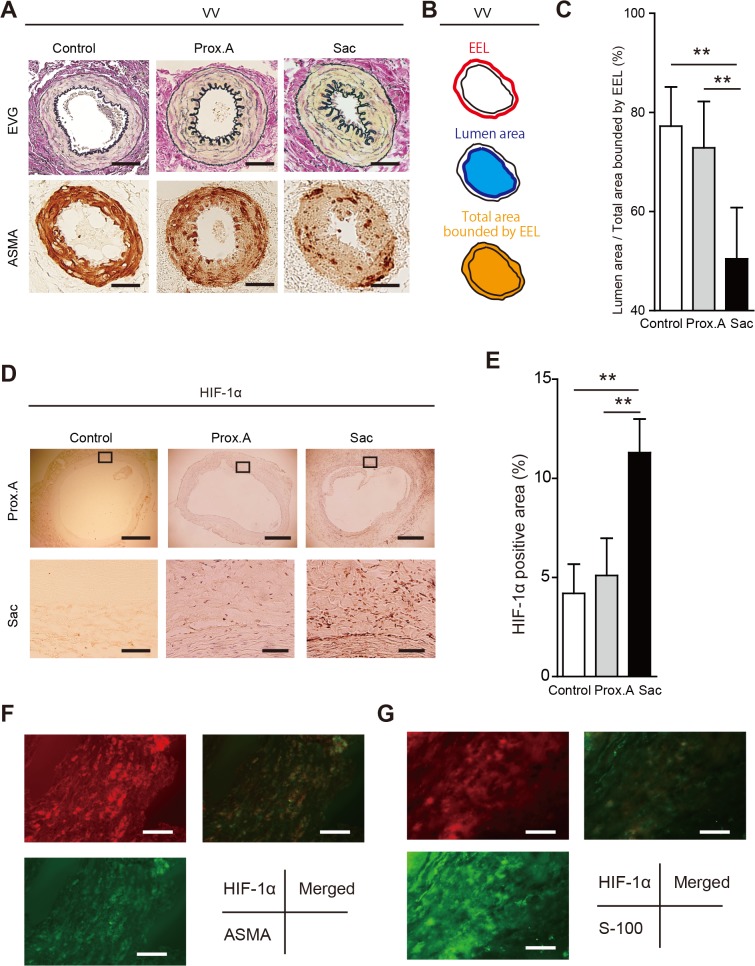
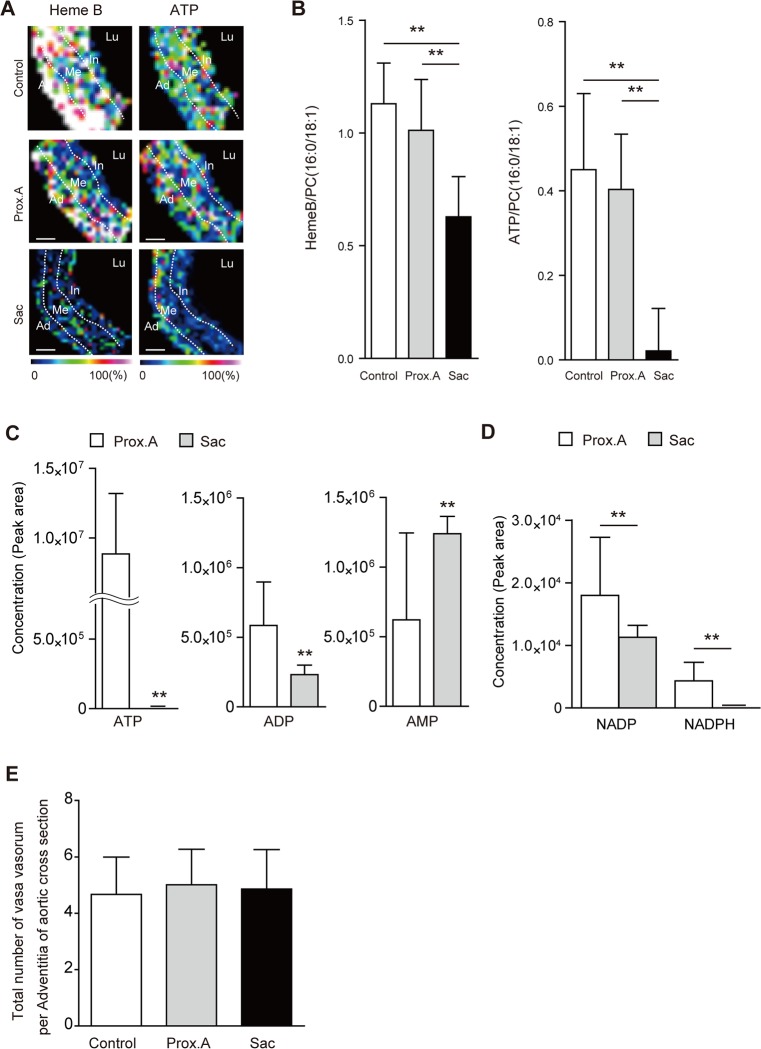
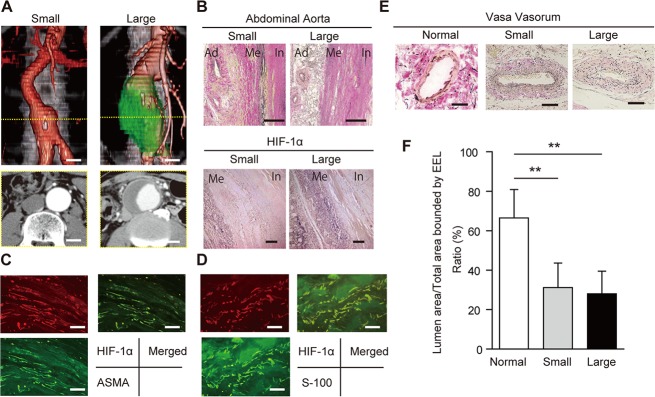
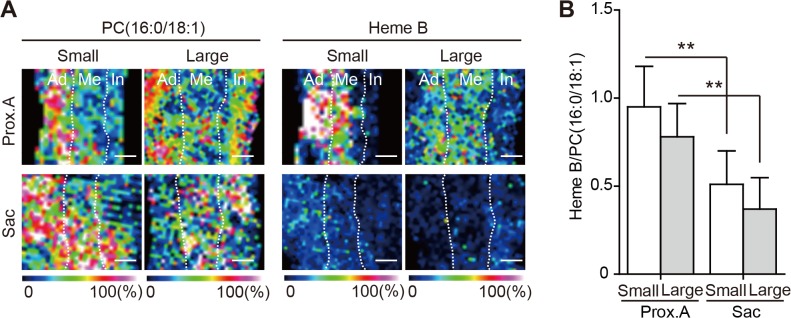
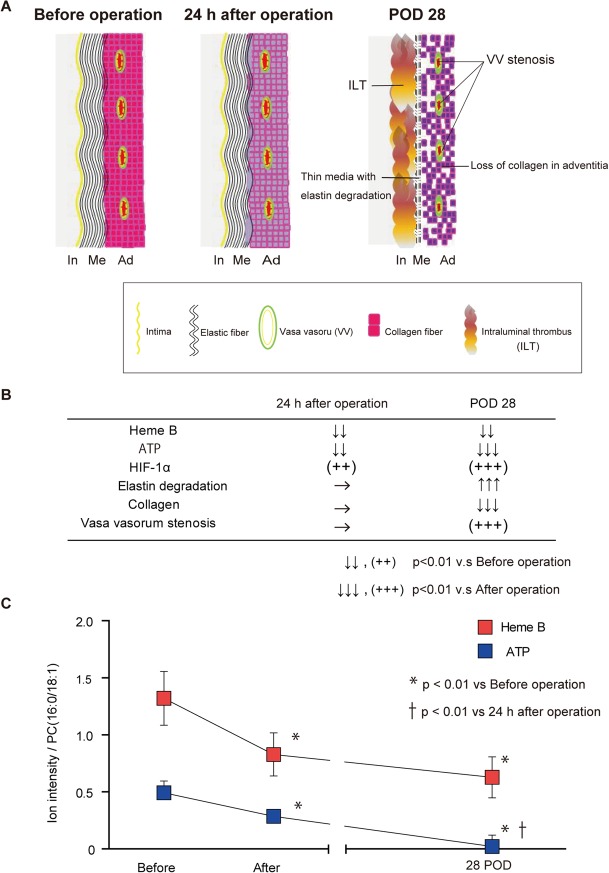
The aortic wall is perfused by the adventitial vasa vasorum (VV). Tissue hypoxia has previously been observed as a manifestation of enlarged abdominal aortic aneurysms (AAAs). We sought to determine whether hypoperfusion of the adventitial VV could develop AAAs. We created a novel animal model of adventitial VV hypoperfusion with a combination of a polyurethane catheter insertion and a suture ligation of the infrarenal abdominal aorta in rats. VV hypoperfusion caused tissue hypoxia and developed infrarenal AAA, which had similar morphological and pathological characteristics to human AAA. In human AAA tissue, the adventitial VV were stenotic in both small AAAs (30-49 mm in diameter) and in large AAAs (> 50 mm in diameter), with the sac tissue in these AAAs being ischemic and hypoxic. These results indicate that hypoperfusion of adventitial VV has critical effects on the development of infrarenal AAA.


Conflict of interest statement

Competing Interests: The authors have declared that no competing interests exist.

Figures

Fig 1
Fig 1. (A) Schematic of the four rat experimental groups. (n = 10 per each group). (B) Steps of the operation performed to induce abdominal aortic aneurysm (AAA) in a rat (group IV). The operation included the following steps: (1) the infra-renal aorta was exfoliated from the surrounding tissue; (2) a polyurethane catheter was inserted through a small incision in the aorta, and cut short to a 5 mm length; (3) the incision was repaired with a 10–0 monofilament suture and blood flow was restarted; (4) the aorta was ligated with a 4–0 silk suture over the inserted catheter. Scale bar = 5 mm. (C) Maximum aortic diameters measured with transabdominal ultrasonography. The aortic diameter steadily increased only in group IV rats. Aortic diameters are given as means ± standard deviation. **P < 0.01 by analysis of variance followed by Tukey’s post-test. (D) Incidence of AAA in rats. An aneurysm was defined as a more than 50% increase in the aortic diameter over baseline level. **P < 0.01 by Kaplan–Meier analysis. (E) Macroscopic view of a group IV rat’s aorta and the illustration on postoperative day 28, showing development of a fusiform AAA above the aortic bifurcation. Prox. A means proximal aorta between the renal artery and the ligation. Scale bar = 10mm.
Fig 2
Fig 2. (A) Representative images of serial ultrasonographic studies (longitudinal and transverse views) of the abdominal aorta in group IV rats immediately after operation (0), and on postoperative days (POD) 7, 14, and 28. The aortic diameter gradually increased. An intraluminal thrombus was first seen at POD 14 and extended to the entire circumference at POD 28. Scale bar = 1mm. (B) Representative images of an aortic wall under high-power magnification with Elastica van Gieson staining in the abdominal aorta of group IV rats immediately after operation (0) and on postoperative days (POD) 7, 14, and 28. The medial elastic lamina became thinner over time. An intraluminal thrombus was first seen at POD 14 and had become thicker by POD 28. Scale bar = 100 μm.
Fig 3
Fig 3. (A) Representative images of aneurysmal tissue with Elastica van Gieson staining in the abdominal aortae of group IV rats immediately after operation (0 days) and 7, 14, and 28 postoperative days (POD). As time passed, the aortic diameter gradually increased and the medial layer became thinner. Scale bar = 500 μm. (B) At POD 28, histological evaluation with Elastica van Gieson staining showed degeneration of the medial elastic lamina, sparse collagen fibers in the aortic adventitia, and marked intimal hyperplasia. Scale bar = 100μm. (C) Measurement of Heme B levels relative to those of phosphatidylcholine(PC16:0/18:1) with matrix-assisted laser desorption/ionization imaging mass spectrometry (MALDI-IMS) in the midpoint of the infra-renal aorta immediately (0h), 6 h, and 24 h after the operation in groups I—IV. MALDI-IMS showed that the ratio of Heme B to PC (16:0/18:1) in group IV had significantly decreased 24h after the operation. Results are the means ± standard deviation of three independent experiments. Statistical analysis was performed using analysis of variance for comparisons among the four groups. Post-hoc comparison was performed using Tukey’s test. **P<0.001 indicates a statistically significant difference. (D) Measurement of adenosine triphosphate (ATP) levels relative to those of PC (16:0/18:1) with MALDI-IMS at the midpoint of the infra-renal aorta immediately (0 h), 6 h, and 24 h after the operation in groups I—IV. MALDI-IMS showed that the ratio of ATP to PC (16:0/18:1) in group IV was significantly decreased at 24 h after the operation. Results are means ± standard deviation of five independent experiments. Statistical analysis was performed using analysis of variance for comparisons among the four groups. Post-hoc comparison was performed using Tukey’s test. **P<0.001 indicates a statistically significant difference.
Fig 4
Fig 4. Immunohistochemical assay for hypoxia-inducible factor-1α (HIF-1α) in rat aortic tissue between the suture ligation and the aortic bifurcation in groups I—IV.
(A) Nuclear and cytoplasmic expression of HIF-1α was observed in the media/adventitia at 24h after the operation in group IV. Scale bar = 100 μm. (B) HIF-1α-positive areas were counted per aortic section (n = 10, per group). Results are means ± standard deviation of five independent experiments at each time point. Statistical analysis was performed using analysis of variance for comparisons among the three groups. Post-hoc comparison was performed using Tukey’s test. **P<0.01 indicates a statistically significant difference.
Fig 5
Fig 5. Representative images obtained by matrix-assisted laser desorption /ionization imaging mass spectrometry (MALDI-IMS) of the abdominal aorta between the infra-renal ligation and the aortic bifurcation in group IV rats.
Distributions of phosphatidylcholine (PC;16:0/18:1), Heme B, and adenosine triphosphate (ATP) in the aortic tissue were visualized. PC (16:0/18:1) was observed ubiquitously immediately after (0) the operation and at 6 h and 24 h following the operation. On the other hand, both Heme B and ATP in the outer media and the adventitia decreased at 6 h and 24 h after the operation. Ad, adventitia; Me, media; In, intima. Scale bar = 100 μm.
Fig 6
Fig 6. Characterization of rats that underwent polyurethane catheter insertion and aortic ligation resulting in aortic aneurysms (group IV).
Data were collected using aortic specimens harvested on postoperative day 28 (n = 10). Group I was used as a control group. The specimens included infra-renal proximal aorta (Prox.A) and aneurysmal sac (Sac). All data are expressed as means ± standard deviation. (A) Representative photomicrographs of smooth muscle cells (SMCs; alpha-smooth muscle cell actin, ASMA), elastin (Elastica van Gieson staining, EVG), and collagen fibers (picrosirius red; PSR). Scale bar in upper panels = 500 μm, in lower panels = 100 μm. (B) Quantitative analysis of SMC, elastin fragmentation and collagen distribution. SMC depletion was scored as mild (1) to severe (5) using a histological grading system. Areas positive for collagen fibers were quantitated per aortic section. Results are means ± standard deviation of three independent experiments. Statistical analysis was performed using analysis of variance for comparisons among the three groups. Post-hoc comparison was performed using Tukey’s test. **P<0.01 indicates a statistically significant difference.
Fig 7
Fig 7. (A) Representative photomicrograph of macrophage (CD68+) infiltration. Scale bar in upper panels = 500 μm, in lower panels = 100 μm. (B) Macrophages within the aortic wall were counted as CD68+ cells. (C) (E) Aortic specimens were stained with antibodies against matrix metalloproteinase MMP-2 and MMP-9. Scale bar in upper panels = 500 μm, in lower panels = 100 μm. (D)(F) Areas positive for MMP-2 and MMP-9 were counted per aortic section (n = 10 per group). Statistical analysis was performed using analysis of variance for comparisons among the three groups. Post-hoc comparison was performed using Tukey’s test. **P<0.01 indicates a statistically significant difference. (G)(H) Representative examples and semiquantitative analysis (percent positive relative to the total area of the section) of gelatinase activity (green) in aortic aneurysms (group IV). Scale bar in upper panels = 500 μm, in lower panels = 100 μm. The experiment was repeated three times. **P < 0.01 by paired t-test. (I) Representative images of immunofluorescence staining for MMP-9 (green), CD68+ cells (macrophages;red), and 4ʹ,6-diamidino-2-phenylindole (blue). Merged images showed that MMP-9 was secreted from macrophages. Scale bar = 20 μm. (J) Representative photomicrograph of cleaved caspase-3. Scale bar in upper panels = 500 μm, in lower panels = 100 μm. (K) Cleaved caspase-3+ cells within the aortic wall were counted. Statistical analysis was performed using analysis of variance for comparisons among the three groups. Post-hoc comparison was performed using Tukey’s test. **P<0.01 indicates a statistically significant difference.
Fig 8
Fig 8. Tissue ischemia and hypoxia in aortic aneurysms induced by a polyurethane catheter insertion and aorta ligation in rats (group IV).
Data were collected using aortic specimens recovered at postoperative day 28 (n = 10). The specimens included group I (Control), infra-renal proximal aorta specimens (Prox.A) and aneurysmal sac specimens (Sac). All data are expressed as means ± standard deviation. (A) Representative adventitial vasa vasorum (VV) with Elastica van Gieson (EVG) staining and alpha-smooth muscle cell actin (ASMA) staining in Prox.A and Sac. Scale bar = 10 μm. (B) Schematic of the measurement method for lumen patency of VV. (C) Lumen patency of VV was measured as the ratio of lumen area to the total area of the VV which was bound by the external elastic lamina (EEL) in each VV. Comparison of the lumen patency of VV between Prox. A and Sac showed significant stenosis in Sac VV. Results are means ± standard deviation of six independent experiments. (D) Immunohistochemistry for HIF-1α in Control, Prox. A, and Sac. The squared area in the upper panels is magnified in lower panels. Scale bar in upper panels = 500 μm, in lower panels = 100 μm. (E) HIF-1α-positive areas were counted per aortic section (n = 10, each group). Results are means ± standard deviation of six independent experiments. Statistical analysis was performed using analysis of variance for comparisons among the three groups. Post-hoc comparison was performed using Tukey’s test. **P<0.01 indicates a statistically significant difference. (F) Representative images of immunofluorescence staining for smooth muscle cells (SMCs; alpha-smooth muscle cell actin, ASMA; green) and HIF-1α (red). Merged images showed that HIF-1α was positive in the medial SMCs. Scale bar = 20 μm. (H) Representative images of immunofluorescence staining for fibroblasts (S-100) (green) and HIF-1α (red). Merged images showed that HIF-1α was positive in the adventitial fibroblasts. Scale bar = 20 μm.
Fig 9
Fig 9. Tissue oxygen metabolism in rats (Group IV).
(A) Representative matrix-assisted laser desorption/ionization imaging mass spectrometry (MALDI-IMS) image showing the distribution of Heme B and adenosine triphosphate (ATP) in Prox.A and Sac. (B) Comparison of the intensity of HemeB relative to PC (16:0/18:1) between Prox.A and Sac. **P < 0.01. Results are means ± standard deviation of three independent experiments. (C) Comparison of tissue levels of ATP, adenosine diphosphate (ADP), and adenosine monophosphate (AMP) between Prox.A and aneurysmal sac specimens (Sac). **P < 0.01 by paired t-test. Results are means ± standard deviation of five independent experiments. (D) Comparison of tissue levels of nicotin-amide adenine dinucleotide phosphate (NADP) and reduced NADP NADPH between Prox.A and Sac. **P < 0.01 by paired t-test. Results are means ± standard deviation of five independent experiments. (E) Comparison of the the number of vasa vasorum per adventitia of the aortic cross sections among the three groups. Results are means ± standard deviation of three independent experiments. Statistical analysis was performed using analysis of variance for comparisons among the three groups. Post-hoc comparison was performed using Tukey’s test.
Fig 10
Fig 10. (A) Preoperative contrast-enhanced 3D-multiple-detector computed tomographic images of a patient with an abdominal aortic aneurysm (AAA). Scale bar = 20 mm. AAAs 30–49 mm in diameter were classified as small, and those more than 50 mm in diameter were classified as large. (B) Upper: representative images of cross-sections of small and large AAAs, (Elastica van Gieson staining). In the small AAAs, medial elastic fibers are relatively well preserved in comparison with the large AAAs. In these large AAAs, the medial elastic lamina is extensively disrupted, with a thick intraluminal thrombus. Ad;,adventitia; Me, media; In, intima. Scale bar = 500 μm. Lower part: representative images from the immunohistochemical assay for hypoxia-inducible factor-1α (HIF-1α) in a small and a large AAA. Nuclear and cytoplasmic expression of HIF-1α was observed in the media/adventitia in both AAAs. Scale bar = 500 μm. (C) Representative images of immunofluorescence staining for smooth muscle cells (SMCs; alpha-smooth muscle cell actin, ASMA) (green) and HIF-1α (red). Merged images showed that HIF-1α was positive in SMCs. Scale bar = 20 μm. (D) Representative images of immunofluorescence staining for fibroblasts (S-100; green) and HIF-1α (red). Merged images showed that HIF-1α was positive in fibroblasts. Scale bar = 20 μm. (E) Patency of the adventitial vasa vasorum (VV) in human tissues (Elastica van Gieson staining). The VVs are patent in the normal aorta but stenotic in the small and larger AAA sacs. Scale bar = 50μm. (F) Lumen patency of the VV was measured as the ratio of the lumen area to the total area, which was bounded by the external elastic lamina (EEL) in each VV. The figure compares lumen patency of adventitial VV among a normal aorta, a small AAA sac, and a large AAA sac adventitial VV. Data were obtained from six cadavers with normal aortae, seven patients with small AAAs, and 30 patients with large AAAs). **P < 0.01.
Fig 11
Fig 11. (A) Distribution of phosphatidylcholine (PC)(16:0/18:1) and Heme B analyzed by 500-μm matrix-assisted laser desorption/ionization imaging mass spectrometry (MALDI-IMS). Ad, adventitia; Me, media; In, intima. Scale bar = 500 μm. PC (16:0/18:1) is distributed ubiquitously in each wall layers of both the proximal aorta (Prox.A) and the aneurysmal sac in both sizes of AAA. On the other hand, Heme B was markedly lower in the outer media and the adventitia in the aneurysmal sac than in the proximal aorta. (B) Comparison of the intensity of Heme B relative to PC (16:0/18:1) in the AAA wall between the proximal aorta and aneurysmal sac. **P < 0.01 (a statistically significant difference). Results are means ± standard deviation of 12 independent experiments.
Fig 12
Fig 12. (A) Schematic illustrations of the changes in the abdominal aortae in group IV rats. Before the operation, the aorta consisted of three layers, namely the intima, media, and adventitia, which receive blood flow via the adventitial vasa vasorum (VV). At 24 h after the operation, the three layers of the aorta were kept intact, although VV hypoperfusion and tissue adenosine triphosphate (ATP) depression occurred. At postoperative day (POD) 28, an intraluminal thrombus (ILT) was present. The medial layer became thin with elastin degradation. The adventitia showed loss of collagen and VV stenosis. (B) Summary of the changes in tissue levels of Heme B and ATP, expression of HIF-1α, the amount of elastin degradation, the amount of collagen, and VV stenosis in the aorta at 24 h after the operation and on POD 28. (C) Changes in the tissue levels of Heme B and ATP in the aorta at 24 h after the operation and on POD 28. The intensities of Heme B or ATP relative to phosphatidylcholine (PC;16:0/18:1) with matrix-assisted laser desorption/ionization imaging mass spectrometry were used for the comparison. *P < 0.01 vs. before operation, ✝ P< 0.01 vs. 24 h after the operation.

References

    1. Baxter BT, Terrin MC, Dalman RL. Medical management of small abdominal aortic aneurysms. Circulation. 2008;117:1883–1889. 10.1161/CIRCULATIONAHA.107.735274 - DOI - PMC - PubMed
    1. Brady AR, Thompson SG, Fowkes FG, Greenhalgh RM, Powell JT. Abdominal aortic aneurysm expansion: risk factors and time intervals for surveillance. Circulation. 2004;110:16–21. 10.1161/01.CIR.0000133279.07468.9F - DOI - PubMed
    1. Gandhi RH, Irizarry E, Cantor JO, Keller S, Nackman GB, Halpern VJ, et al. Analysis of elastin cross-linking and the connective tissue matrix of abdominal aortic aneurysms. Surgery. 1994;115:617–620. - PubMed
    1. Sakalihasan N, Limet R, Defawe OD. Abdominal aortic aneurysm. Lancet. 2005;365:1577–1589. 10.1016/S0140-6736(05)66459-8 - DOI - PubMed
    1. Vorp DA, Lee PC, Wang DH, Makaroun MS, Nemoto EM, Ogawa S, et al. Association of intraluminal thrombus in abdominal aortic aneurysm with local hypoxia and wall weakening. J Vasc Surg. 2001;34:291–299. 10.1067/mva.2001.114813 - DOI - PubMed

Publication types

MeSH terms