. 2015 Aug 26;10(8):e0136365.
doi: 10.1371/journal.pone.0136365. eCollection 2015.

Tomato R2R3-MYB Proteins SlANT1 and SlAN2: Same Protein Activity, Different Roles

Affiliations

Tomato R2R3-MYB Proteins SlANT1 and SlAN2: Same Protein Activity, Different Roles

Claudia Kiferle et al. PLoS One. .

Abstract

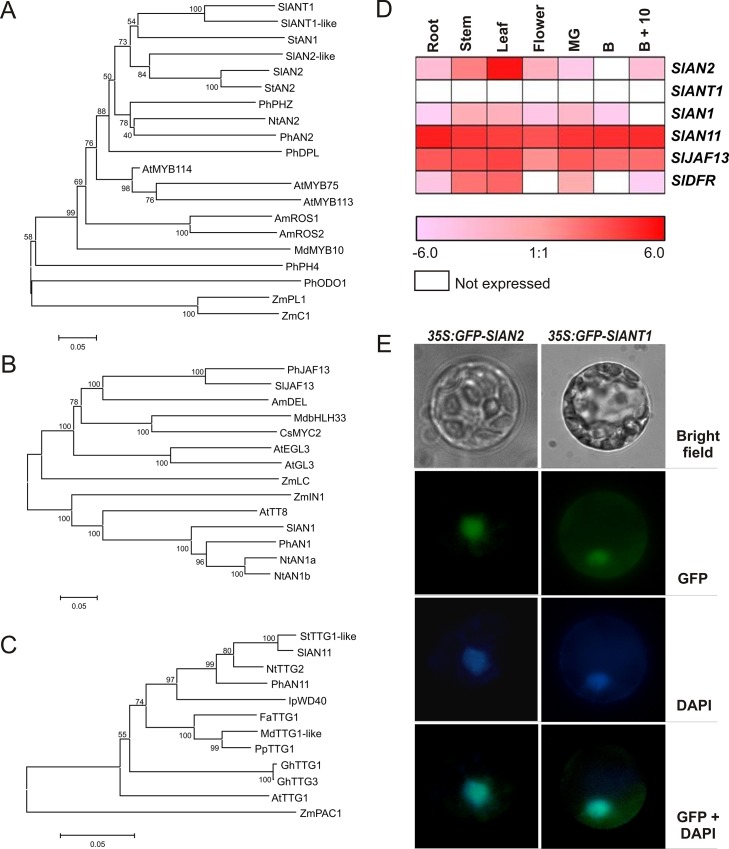
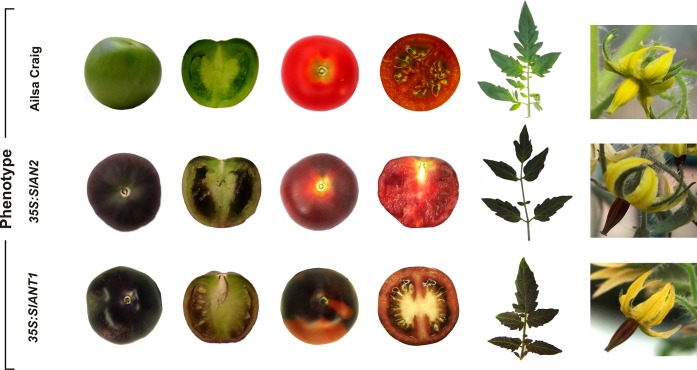
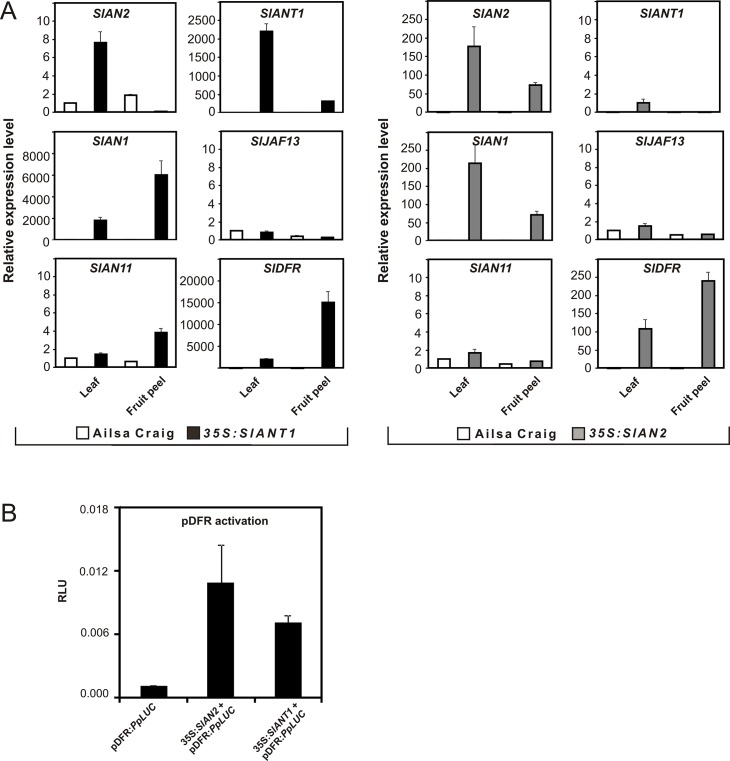
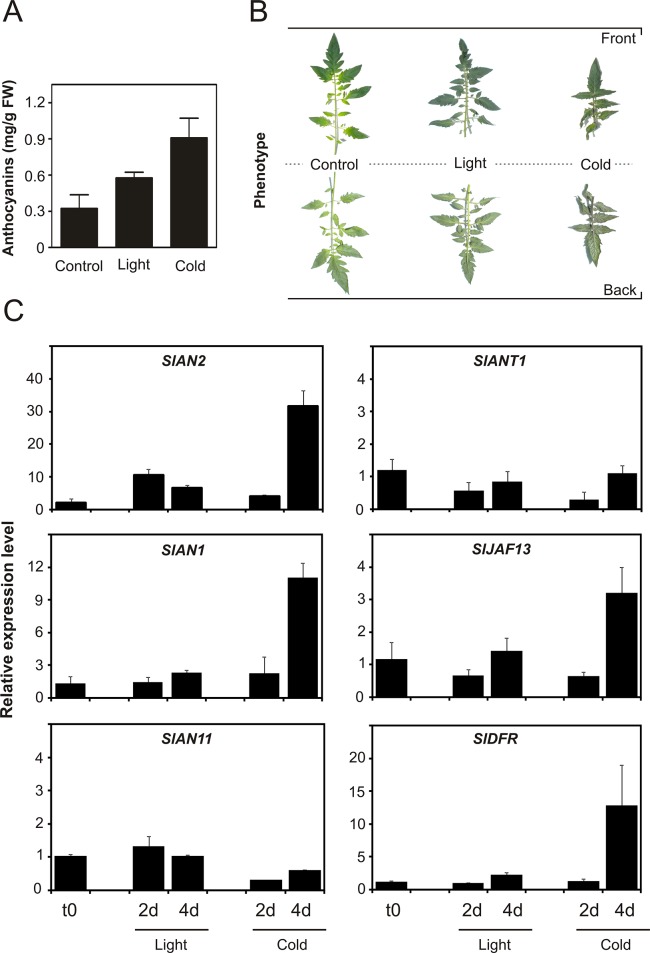
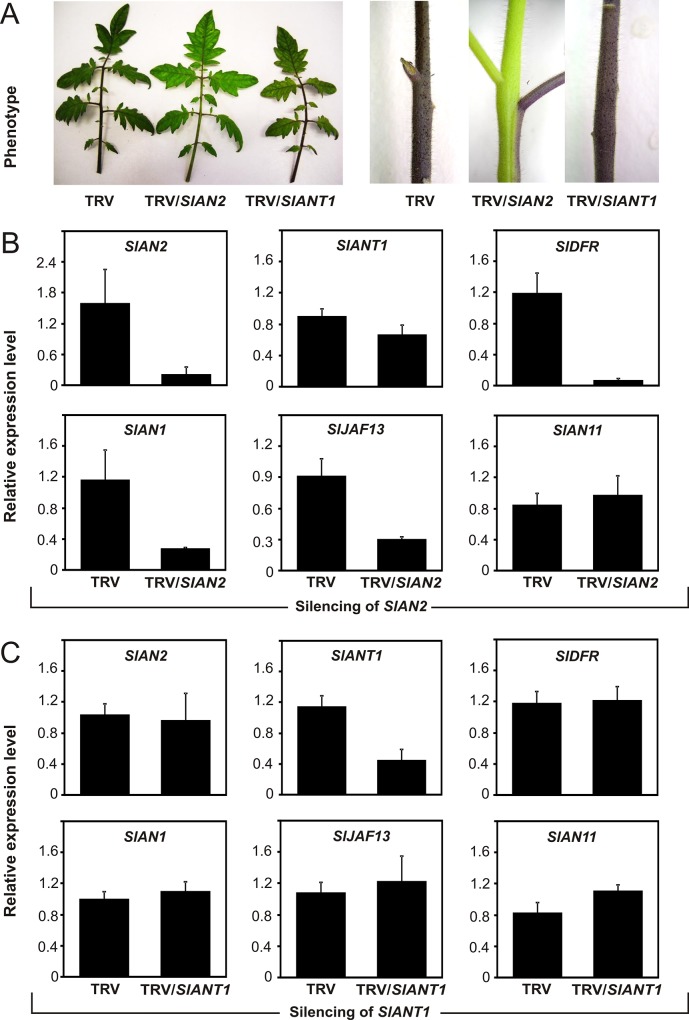
Anthocyanins are water-soluble polyphenolic compounds with a high nutraceutical value. Despite the fact that cultivated tomato varieties do not accumulate anthocyanins in the fruit, the biosynthetic pathway can be activated in the vegetative organs by several environmental stimuli. Little is known about the molecular mechanisms regulating anthocyanin synthesis in tomato. Here, we carried out a molecular and functional characterization of two genes, SlAN2 and SlANT1, encoding two R2R3-MYB transcription factors. We show that both can induce ectopic anthocyanin synthesis in transgenic tomato lines, including the fruit. However, only SlAN2 acts as a positive regulator of anthocyanin synthesis in vegetative tissues under high light or low temperature conditions.


Conflict of interest statement

Competing Interests: The authors have declared that no competing interests exist.

Figures

Fig 1
Fig 1. Identification of possible tomato R2R3-MYB, bHLH, and WDR regulators of anthocyanin synthesis.
Evolutionary relationships of R2R3-MYB (A), bHLH (B) and WDR (C) proteins involved in anthocyanin pigmentation in different plant species. The evolutionary history was inferred using the Neighbor-Joining method [42]. The optimal tree with the sum of branch length (A = 4.04792561, B = 3.00531532, C = 0.83964559) is shown. The percentage of replicate trees in which the associated taxa clustered together in the bootstrap test (1000 replicates) are shown next to the branches [57]. The tree is drawn to scale, with branch lengths in the same units as those of the evolutionary distances used to infer the phylogenetic tree. The evolutionary distances were computed using the p-distance method [58] and are in the units of the number of amino acid differences per site. The analysis involved 20 (A), 14 (B) and 12 (C) amino acid sequences. All ambiguous positions were removed for each sequence pair. There were a total of 790 (A), 364 (B) and 372 (C) positions in the final dataset. Evolutionary analyses were conducted in MEGA6 [41]. Expression heatmap (Log2 scale of FPKM values) of SlAN2, SlANT1, SlAN1, SlAN11, SlJAF13 and SlDFR genes in different tissues of tomato, analyzed by Illumina RNA-Seq (D). MG: Mature Green fruit; B: Breaker fruit; B+10: ripe fruit 10 days after breaker stage. Subcellular localization of GFP-SlANT1 and GFP-SlAN2 fusion proteins in transiently transformed A. thaliana mesophyll protoplasts (E). Pictures were taken with bright field, green fluorescent protein (GFP) and 4’6-diamidino-2-phenylindole (DAPI) filters.
Fig 2
Fig 2. 35S:SlANT1 and 35S:SlAN2 transgenic tomato lines.
Phenotype of 35S:SlAN2 and 35S:SlANT1 lines compared to the control non-transformed plants (Ailsa Craig). Details of immature green fruits, section of the immature green fruits, red ripened fruits, section of the red fruits, leaves, and flowers are shown. 35S:SlANT1 line T9002 and 35S:SlAN2 line R9009 were chosen for the phenotypic analysis.
Fig 3
Fig 3. Effect of the overexpression of SlANT1 and SlAN2 on other genes of the anthocyanin pathway.
Quantitative analysis of transcript levels of SlAN2, SlANT1, SlAN1, SlAN11, SlJAF13 and SlDFR in leaves and peel from green fruits of the 35S:SlANT1 and 35S:SlAN2 lines in comparison with control Ailsa Craig plants (A). Expression levels are shown as relative units, with the value of AC leaves set to one. A sample composed of two biological replicates was analyzed for each plant tissue and data are means of two technical replicates ± SD. 35S:SlANT1 line T9002 and 35S:SlAN2 line R9009 were chosen for the qPCR analysis. Transient transformation experiment in Arabidopsis mesophyll protoplasts showing that both SlAN2 and SlANT1 activated the SlDFR promoter (B). Protoplasts were transfected with the reporter plasmid containing the SlDFR promoter driving firefly luciferase (PpLuc) gene alone (first histogram) or in combination with the effector plasmid containing either the full length SlAN2 or SlANT1 coding sequence (second or third histograms, respectively). A 35S:Renilla-luciferase (RrLuc) plasmid was used as an internal control. Data are expressed as Relative Luc Activity (RLU) (PpLuc/RrLuc) and are means of eight biological replicates ± SE.
Fig 4
Fig 4. Induction of anthocyanin synthesis in tomato plants under high light and low temperatures conditions.
Anthocyanin content in leaves from Ailsa Craig plants treated for 7 days with high light (approx. 300 μmol photons m−2 s−1) or low temperature (15°C) compared to untreated control plants (A) and phenotypes of the same leaves (B). Quantitative analysis of transcript levels of selected anthocyanin genes in vegetative tissues subjected to 2 and 4 days of high light or low temperature treatments (C). Expression levels are shown as relative units, with the value of one of the biological replicates of control untreated samples set to one. Data are means of three biological replicates ± SD.
Fig 5
Fig 5. Virus Induced Gene Silencing of SlAN2 and SlANT1 in vegetative tissues of tomato plants.
Phenotype of SlAN2 and SlANT1 silenced leaves and stems (TRV/SlAN2, TRV/SlANT1, respectively) compared to non-silenced controls (TRV) (A). Quantitative analysis of transcript levels for SlAN2, SlAN1, SlAN11, SlDFR, SlANT1 and SlJAF13 in SlAN2 silenced tomato plants (TRV/SlAN2) (B) and in SlANT1 silenced tomato plants (TRV/SlANT1) (C) compared to non-silenced controls (TRV). Expression levels are shown as relative units, with the value of one of the biological replicates of control TRV samples set to one. Data are means of three biological replicates ± SD.

References

    1. Gould KS. Nature's Swiss army knife: The diverse protective roles of anthocyanins in leaves. J Biomed Biotechnol. 2004; 5: 314–320. - PMC - PubMed
    1. Brunetti C, Di Ferdinando M, Fini A, Pollastri S, Tattini M. Flavonoids as antioxidants and developmental regulators: relative significance in plants and humans. Int J Mol Sci. 2013; 14: 3540–3555. 10.3390/ijms14023540 - DOI - PMC - PubMed
    1. Koes R, Verweij CW, Quattrocchio F. Flavonoids: a colorful model for the regulation and evolution of biochemical pathways. Trends Plant Sci. 2005; 5: 236–242. - PubMed
    1. Petroni K, Tonelli C. Recent advances on the regulation of anthocyanin synthesis in reproductive organs. Plant Sci. 2011; 181: 219–229. 10.1016/j.plantsci.2011.05.009 - DOI - PubMed
    1. Quattrocchio F, Wing J, van der Woude K, Souer E, de Vetten N, Mol J, et al. Molecular analysis of the anthocyanin2 gene of Petunia and its role in the evolution of flower color. Plant Cell 1999; 11: 1433–1444. - PMC - PubMed

Publication types

MeSH terms