. 2015 Nov;35(11):2371-6.
doi: 10.1097/IAE.0000000000000716.

OPTICAL COHERENCE TOMOGRAPHY ANGIOGRAPHY FEATURES OF DIABETIC RETINOPATHY

Affiliations

OPTICAL COHERENCE TOMOGRAPHY ANGIOGRAPHY FEATURES OF DIABETIC RETINOPATHY

Thomas S Hwang et al. Retina. 2015 Nov.

Abstract

Purpose: To describe the optical coherence tomography angiography features of diabetic retinopathy.

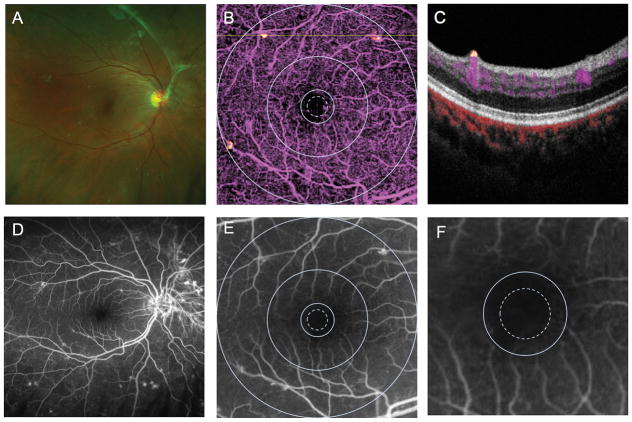
Methods: Using a 70 kHz optical coherence tomography and the split-spectrum amplitude decorrelation angiography algorithm, 6 mm × 6 mm 3-dimensional angiograms of the macula of 4 patients with diabetic retinopathy were obtained and compared with fluorescein angiography for features cataloged by the Early Treatment of Diabetic Retinopathy Study.

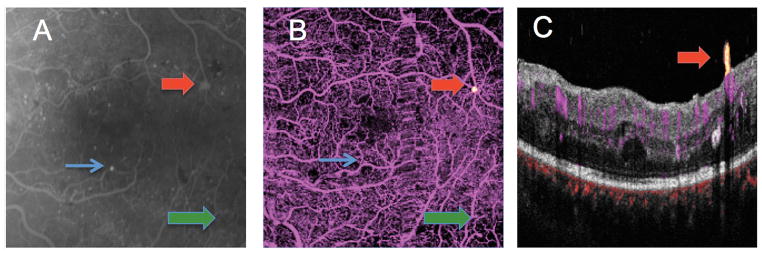
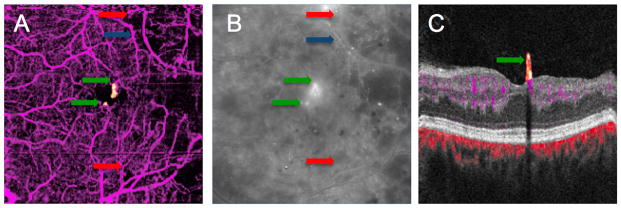
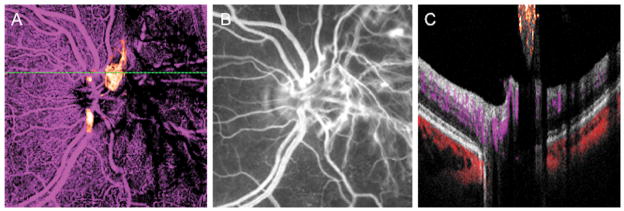
Results: Optical coherence tomography angiography detected enlargement and distortion of the foveal avascular zone, retinal capillary dropout, and pruning of arteriolar branches. Areas of capillary loss obscured by fluorescein leakage on fluorescein angiography were more clearly defined on optical coherence tomography angiography. Some areas of focal leakage on fluorescein angiography that were thought to be microaneurysms were found to be small tufts of neovascularization that extended above the inner limiting membrane.

Conclusion: Optical coherence tomography angiography does not show leakage but can better delineate areas of capillary dropout and detect early retinal neovascularization. This new noninvasive angiography technology may be useful for routine surveillance of proliferative and ischemic changes in diabetic retinopathy.


Figures

Figure 1
Figure 1
Right eye of a patient with diabetic retinopathy with wide-field scanning laser ophthalmoscopy color image (A) fluorescein angiogram (FA) (D). Panel B shows a 6 × 6 mm en face optical coherence tomography (OCT) retinal angiogram with ETDRS grid superposed showing FAZ enlargement temporally between the 300 (dotted) and 500 μm diameter circles. Panel C shows a cross sectional OCT angiogram corresponding to the dotted line on Panel B showing a small area of flow signal above the internal limiting membrane in yellow, consistent with neovascular tissue that was not clinically evident. Panels E and F are FA cropped to 6 × 6 mm with ETDRS superposed and a magnified FA showing FAZ enlargement temporally, respectively.
Figure 2
Figure 2
6 × 6 mm macular images from the left eye of a patient with proliferative diabetic retinopathy (A) early frame fluorescein angiogram. Numerous microaneurysms are seen throughout the macula as punctate areas of hyperfluorescence. The green arrow points to an area of intraretinal microvascular abnormality (IRMA). The red arrow points to a small area of hyperfluorescence that leaked mildly in later frames. (B) En face OCT angiogram showing flow signal above the internal limiting membrane (ILM, yellow dot pointed out by red arrow), consistent with a tuft of neovascularization (NV). The area of IRMA was also identified by OCT angiogram (green arrow). The largest microaneurysm on FA (blue arrow) was not identifiable on the OCT angiogram. A vertical strip of blur temporal to the center represents motion artifact (?). (C) Cross-sectional OCT angiogram at the level of the NV (yellow) shows it to be anterior to the ILM. Retinal circulation is colored in magenta and choroidal circulation (below Bruch’s membrane) is colored red. Clinically, this appeared as a microaneurysm.
Figure 3
Figure 3
OCT angiogram (A) and midphase FA (B) of a diabetic patient discloses areas of capillary dropout in the temporal macula with pruning of the arterioles. In the FA, diffuse leakage obscures an area of capillary drop out seen on OCT angiography (red arrows). An arteriole with wall staining (blue arrow) in the FA is shown to be a barely visible ghost vessel on OCT angiography. Focal areas of leakage near the fovea thought to be large microaneurysms on FA were shown to be NV on OCT angiography (green arrows).
Figure 4
Figure 4
A left eye with neovascularization of the disc (NVD). (A) En face OCT angiogram discloses flow in the abnormal vessels above the disc. The NVD was cropped outside of the OCT scan volume nasal to the disc and is seen as shadows rather than flow. (B) NVD is clearly seen on FA. Clinically the NVD appeared elevated above the retinal surface. (C) A cross-sectional OCT angiogram through the area of the NVD shows flow signal (orange) in the neovascular tissue that is close to the retinal surface. Further nasally, similar shadowing seen in panel A is displayed in cross section.

References

    1. Antonetti D, Klein R, Gardner TW. Diabetic retinopathy. N Engl J Med. 2012;366(13):1227–1239. doi: 10.1056/NEJMra1005073. - DOI - PubMed
    1. American Academy of Ophthalmology Retinal/Vitreous Panel. Preferred Practice Pattern Guidelines. Diabetic Retinopathy. San Francisco, CA: American Academy of Ophthalmology; 2014. pp. 1–65. Available at: www.aao.org/ppp.
    1. Early Treatment Diabetic Retinopathy Study Research Group. Fluorescein Angiographic Risk Factors for Progression. Ophthalmology. 1991;98(Supplement):834–840. doi: 10.1016/S0161-6420(13)38015-4. - DOI - PubMed
    1. Early Treatment Diabetic Retinopathy Study Research Group. Classification of Diabetic Retinopathy from Fluorescein Angiograms: ETDRS Report Number 11. Ophthalmology. 1991;98(Supplement):807–822. doi: 10.1016/S0161-6420(13)38013-0. - DOI - PubMed
    1. Bloome MA. Fluorescein angiography: risks. Vision Res. 1980;20(12):1083–1097. - PubMed

Publication types