. 2015 Aug 26;10(8):e0134400.
doi: 10.1371/journal.pone.0134400. eCollection 2015.

Smart-Phone Based Magnetic Levitation for Measuring Densities

Affiliations

Smart-Phone Based Magnetic Levitation for Measuring Densities

Stephanie Knowlton et al. PLoS One. .

Abstract

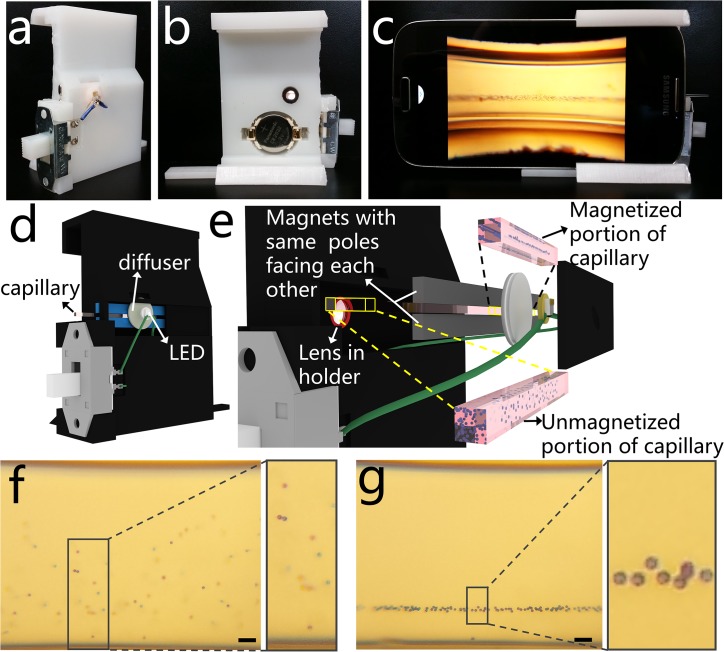
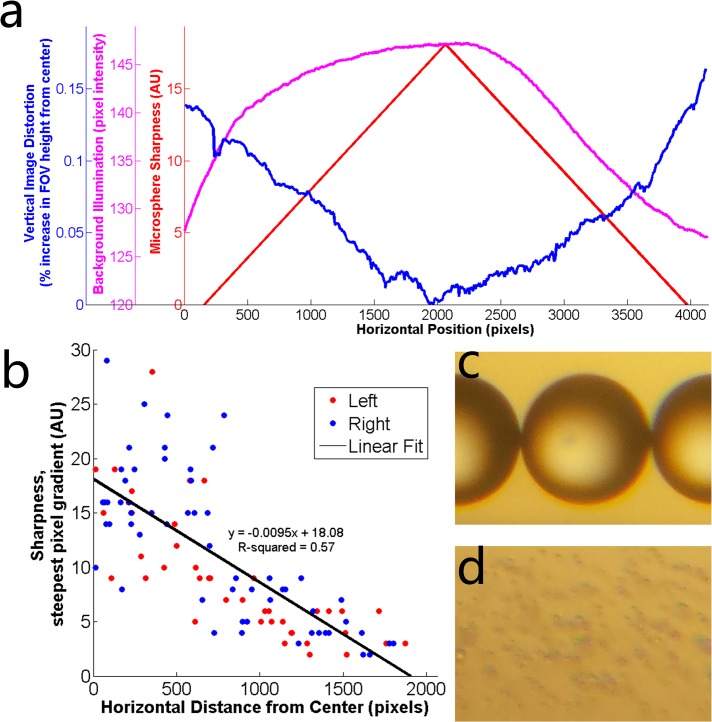
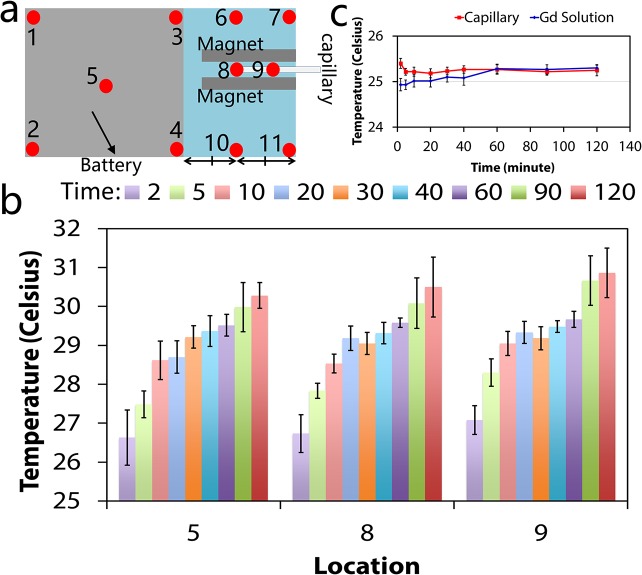
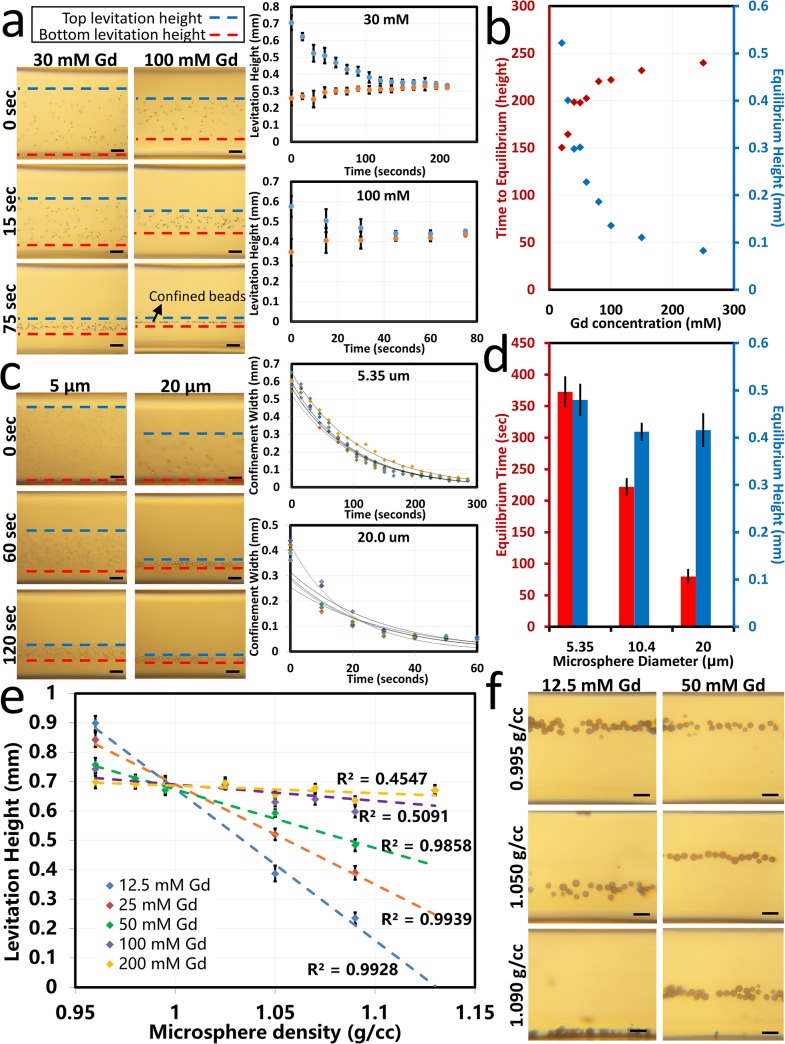
Magnetic levitation, which uses a magnetic field to suspend objects in a fluid, is a powerful and versatile technology. We develop a compact magnetic levitation platform compatible with a smart-phone to separate micro-objects and estimate the density of the sample based on its levitation height. A 3D printed attachment is mechanically installed over the existing camera unit of a smart-phone. Micro-objects, which may be either spherical or irregular in shape, are suspended in a paramagnetic medium and loaded in a microcapillary tube which is then inserted between two permanent magnets. The micro-objects are levitated and confined in the microcapillary at an equilibrium height dependent on their volumetric mass densities (causing a buoyancy force toward the edge of the microcapillary) and magnetic susceptibilities (causing a magnetic force toward the center of the microcapillary) relative to the suspending medium. The smart-phone camera captures magnified images of the levitating micro-objects through an additional lens positioned between the sample and the camera lens cover. A custom-developed Android application then analyzes these images to determine the levitation height and estimate the density. Using this platform, we were able to separate microspheres with varying densities and calibrate their levitation heights to known densities to develop a technique for precise and accurate density estimation. We have also characterized the magnetic field, the optical imaging capabilities, and the thermal state over time of this platform.


Conflict of interest statement

Competing Interests: ST and SK have filed a provisional patent pending related to this technology. Patent number 62133031, titled "Mobile Device-Based System For Medical And Industrial Analyses" was filed on March 13, 2015. This does not alter the authors' adherence to PLOS ONE policies on sharing data and materials.

Figures

Fig 1
Fig 1. A smart-phone attachable lightweight platform to separate micro-objects based on their densities.
(a-b) Front and back views of the 3D printed magnetic levitation platform. (c) Imaging of levitating microspheres using the smartphone camera and the 3D printed attachment. (d) 3D schematic diagram of the smart-phone attachment, where a disposable microcapillary filled with the sample is inserted from the side for imaging. (e) Magnified illustration of the platform showing the LED illumination, a ground glass diffuser, two rare-earth permanent magnets with the same poles facing each other, and 3D printed lens holder. Microspheres in the magnetic field are levitated and confined and those outside of the magnetic field are distributed randomly. (f-g) Captured image of 10 μm polystyrene microspheres (scale bar is 100 μm), (f) at t = 0 and (g) levitated and confined at equilibrium.
Fig 2
Fig 2. Theoretical demonstration of density-based magnetic levitation.
(a) Representative microspheres are suspended in a paramagnetic medium for two cases: when the microspheres are more dense than the suspending medium (left) and when the microspheres are less dense than the suspending medium (right). The magnetic force (Fm), buoyancy or corrected gravitational force (Fg’), and drag force (Fd) acts on microspheres, causing them to approach equilibrium (purple dotted line). Fm exerts a force on the microspheres in the direction of the centerline between the two magnets (orange dotted line) and changes in magnitude depending on the microsphere’s location in the magnetic field. Fg’ exerts either a downward force (in the case of microspheres which are denser than the suspending medium, left) or an upward force (in the case of microspheres which are less dense than the suspending medium, right). Fd acts on the object in a direction opposite the direction of motion until the bead reaches a line of equilibrium below the centerline (as in the case of denser objects, left) or above the centerline (as in the case of less dense objects, right). At equilibrium, Fm and Fg’ are equal and opposite and Fd has zero magnitude. (b) The magnetic field in the cross-section between the magnets demonstrated by the magnetic forces exerted on an object in the field; the forces have directionality toward the centerline between the two magnets and magnitude greatest near the magnets’ surfaces and approaching zero at the centerline. (c) Contour plot of magnitude of the magnetic field strength in the cross-sectional area at z = 0, the center between the two magnets. The magnitude of the magnetic field is constrained between 0 T and 0.4 T. (d-f) Contour plots showing the magnitude of the magnetic field at the back surface of the smart-phone in the (d) x-direction, (e) y-direction, and (f) z-direction. (g) Representative images of polymer microspheres in a 50 mM gadolinium solution levitating and focusing to an equilibrium height over 120 seconds.
Fig 3
Fig 3. Optical quantification of density-based magnetic levitation.
(a) Quantification of image distortion (blue), background illumination (magenta), and microsphere sharpness (red) along the horizontal field of view. Microsphere sharpness is shown as the line of best fit for the data shown in (b). (b) Data points representing sharpness of microspheres located at different distances from the center of the field of view. The line of best fit approximates the decrease in image sharpness as the distance from the centerline increases. Red data points represent microspheres located to the left of the centerline and blue data points represent microspheres located to the right of the centerline. (c) 210 μm and (d) 5.25 μm diameter microspheres demonstrating qualitatively the optical resolution of the platform.
Fig 4
Fig 4. Thermal quantification of the magnetic levitation platform.
(a) Temperatures at several locations at the back surface of the smart phone were measured while the smart-phone density estimation application was running. Location 8 corresponds to the back surface of the phone closest to the end of the microcapillary. Location 9 corresponds to the surface of the smart-phone camera. Full thermal plots are given in S4 Fig (b) Temperature readings over 120 minutes at locations 5, 8, and 9 at running times = 2, 5, 10, 20, 30, 40, 60, 90, and 120 minutes (n = 6). (c) Temperature in the gadolinium solution and capillary as a function of running time with standard deviation (n = 6).
Fig 5
Fig 5. Android-based application running on the same smart phone.
(a) Density Tester application icon. (b) In the smart-phone application, the user is given the option to take an image using the camera application or to choose an existing image from the gallery. The selection of ‘Choose from gallery’ enables access and processing of the images stored in the smart-phone or memory card installed on the smart-phone. ‘Take photo’ directs the user to the camera application. (c) Once an image is taken or chosen from memory, it is loaded into the application. (d) When the user selects ‘Process’, the application performs an analysis to crop the image to the useful field of view and identify the magnet edges (blue), capillary edges (red), and microsphere confinement area (green). It also calculates the Levitation Height and Standard Deviation of the microsphere confinement area as the distance from the bottom magnet (shown as the top magnet in these images) and width of the microsphere distribution, respectively. (e) Screenshots showing the analysis results for microspheres levitated in different concentrations of gadolinium: 25 mM, 50 mM, 100 mM, and 200 mM. (f) Summary of the results obtained in (e), demonstrating the ability of the application to accurately and repeatably detect different levitation heights as a function of the gadolinium concentration in the paramagnetic medium, showing a positive correlation (n = 6).
Fig 6
Fig 6. Experimental demonstration of magnetic levitation of polymer microspheres and quantification of levitation height.
(a) Time-dependent focusing of 10 μm polystyrene microspheres in 30 mM and 100 mM gadolinium solution. Images shown at 0, 15 and 75 seconds after being placed in the magnetic field demonstrate time-dependent focusing of microspheres influenced by the gadolinium concentration. Graphs show the top (blue) and bottom (red) confinement limits of the microspheres over time in 30 mM and 100 mM gadolinium paramagnetic mediums. (b) Quantification of equilibrium time (red) and equilibrium height (blue) for several concentrations of gadolinium. (c) Time-dependent focusing of microspheres with different diameters (5.35 and 20 μm) in 50 mM gadolinium solution. Images shown at 0, 60, and 120 seconds after insertion into the magnetic field demonstrate time-dependent focusing of microspheres influenced by the microsphere size. Graphs show the width of microsphere confinement over time for 6 different trials with exponential decay approximations. (d) Quantification of equilibrium time (red) and equilibrium height (blue) as a function of microsphere size, demonstrating that increasing size decreases the time to equilibrium, but the size has no statistically significant effect on levitation height. (e) Calibration of levitation height to density using eight density standard microspheres. Five different gadolinium concentrations are used to demonstrate the ability to obtain greater resolution at lower gadolinium concentrations. (f) Images representing different levitation heights of three different density standard microspheres in two different concentrations of paramagnetic medium. Scale bars are 100 μm.

References

    1. McCloskey KE, Chalmers JJ, Zborowski M. Magnetic Cell Separation: Characterization of Magnetophoretic Mobility. Anal Chem. 2003;75(24):6868–74. 10.1021/ac034315j - DOI - PubMed
    1. Zborowskia M, Sunb L, Moorea LR, Williamsa PS, Chalmers JJ. Continuous cell separation using novel magnetic quadrupole flow sorter. Journal of Magnetism and Magnetic Materials. 1999;194(1–3):224–30. 10.1016/S0304-8853(98)00581-2 - DOI
    1. Lim B, Reddy V, Hu X, Kim K, Jadhav M, Abedini-Nassab R, et al. Magnetophoretic circuits for digital control of single particles and cells. Nat Commun. 2014;5 10.1038/ncomms4846 - DOI - PubMed
    1. Yang Y, Erb RM, Wiley BJ, Zauscher S, Yellen BB. Imaginary Magnetic Tweezers for Massively Parallel Surface Adhesion Spectroscopy. Nano Letters. 2011;11(4):1681–4. 10.1021/nl200189w - DOI - PubMed
    1. Yang Y, Gao L, Lopez GP, Yellen BB. Tunable Assembly of Colloidal Crystal Alloys Using Magnetic Nanoparticle Fluids. ACS Nano. 2013;7(3):2705–16. 10.1021/nn400118e - DOI - PubMed

Publication types