. 2015 Sep 3;525(7567):56-61.
doi: 10.1038/nature14973. Epub 2015 Aug 26.

The C9orf72 repeat expansion disrupts nucleocytoplasmic transport

Affiliations

The C9orf72 repeat expansion disrupts nucleocytoplasmic transport

Ke Zhang et al. Nature. .

Abstract

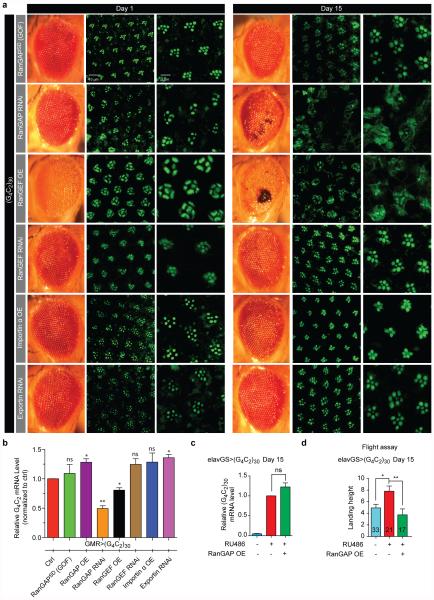
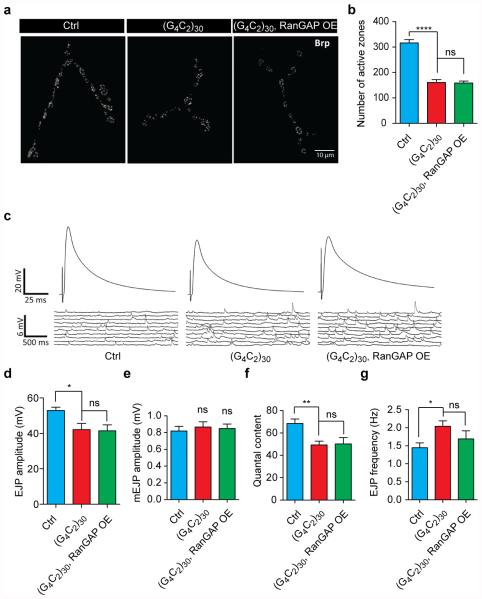
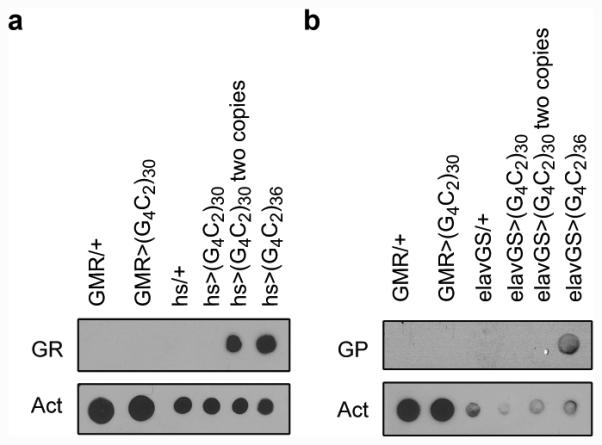
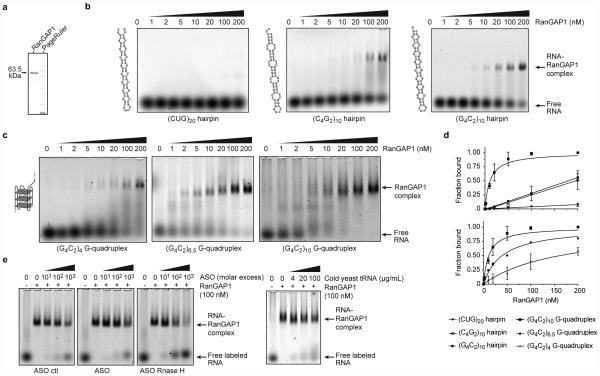
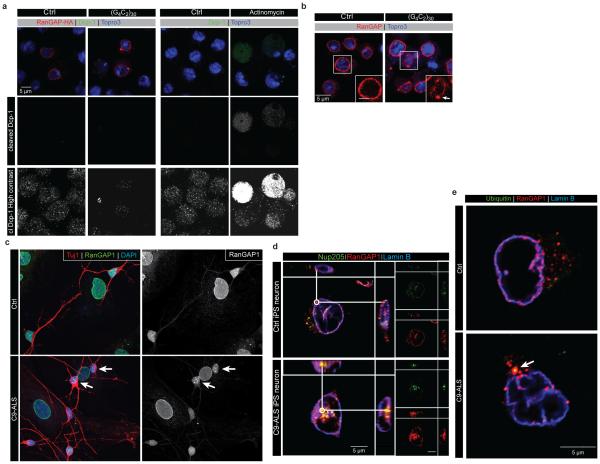
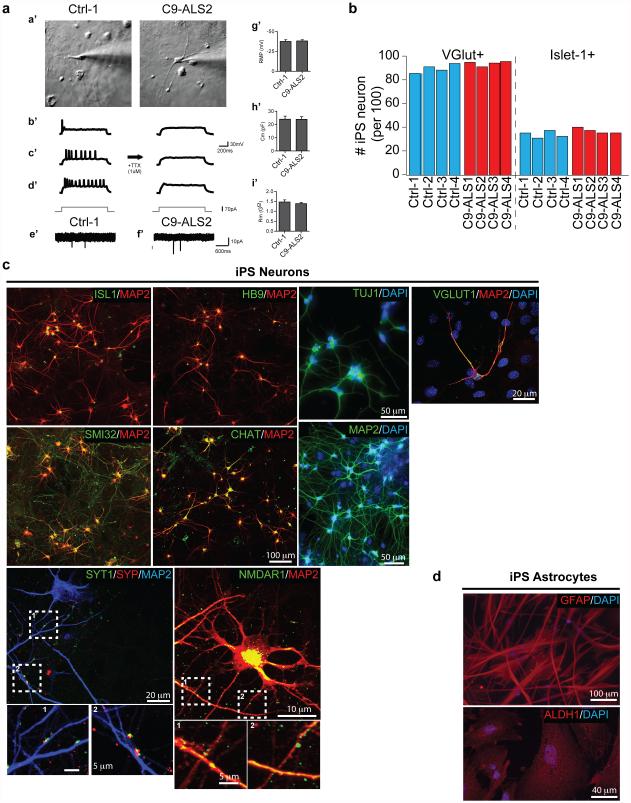
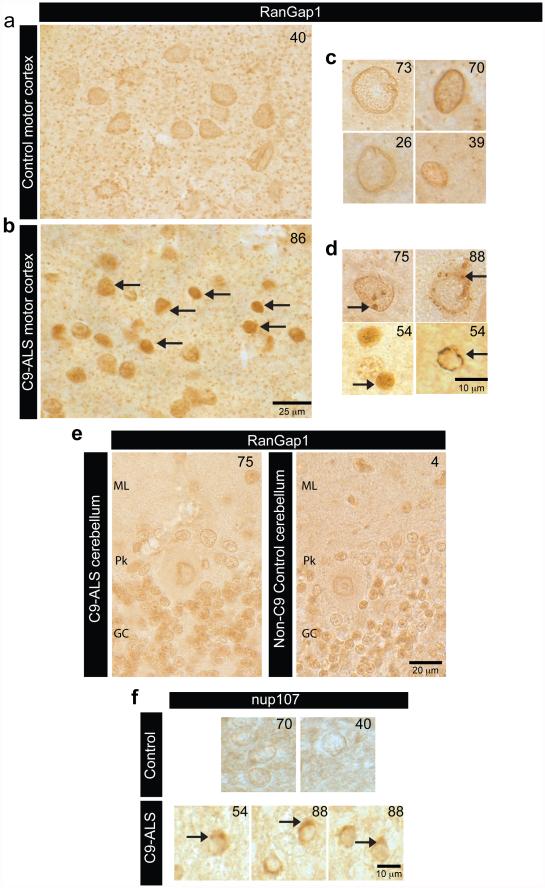
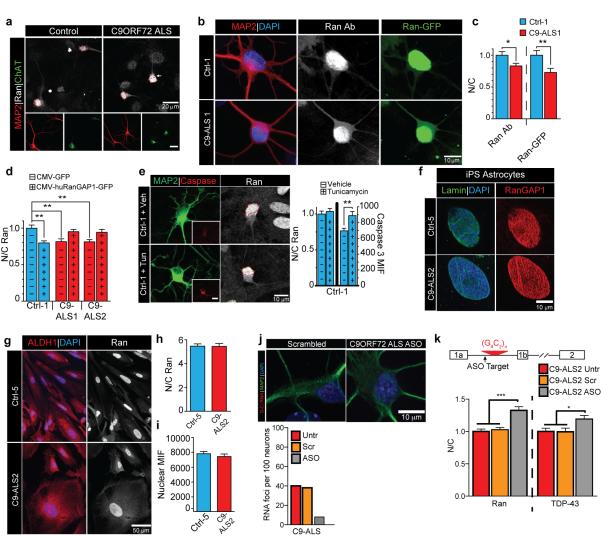
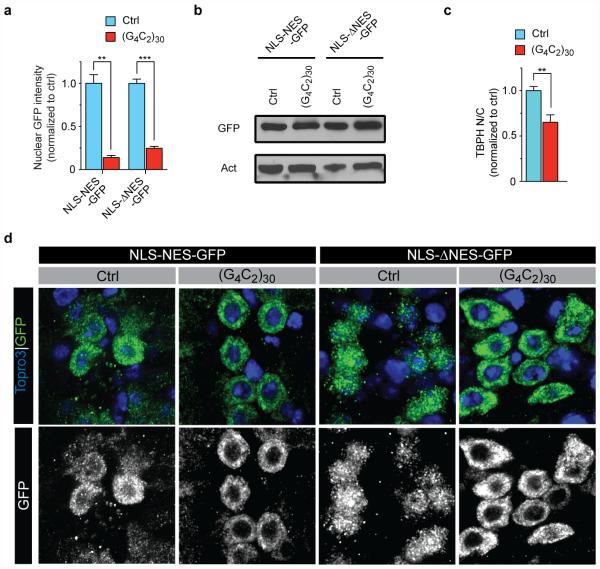
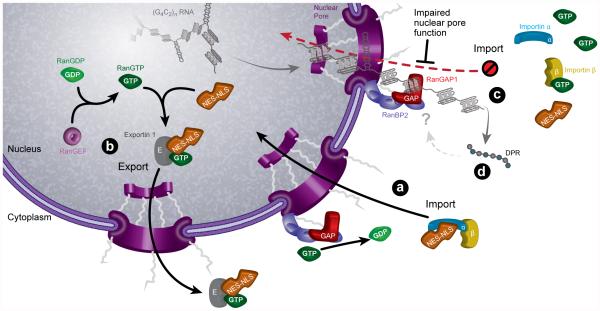
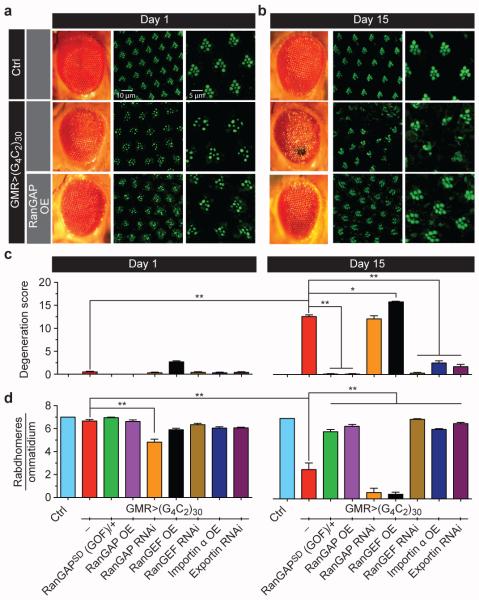
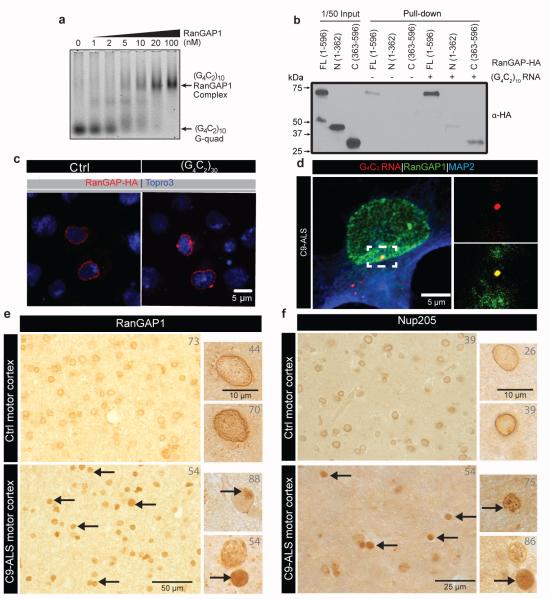
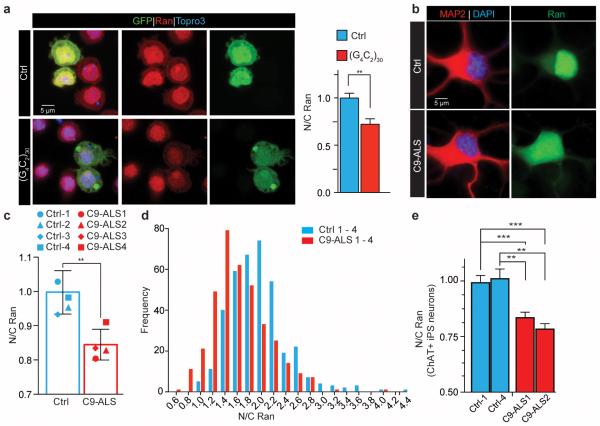
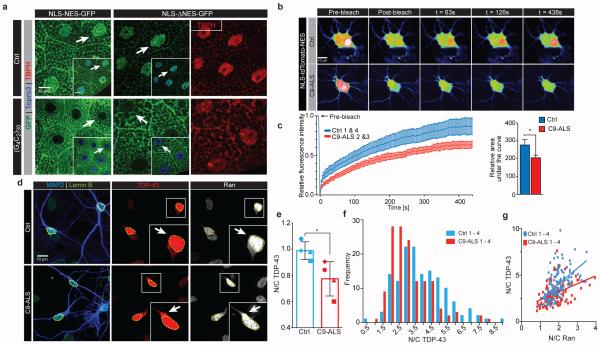
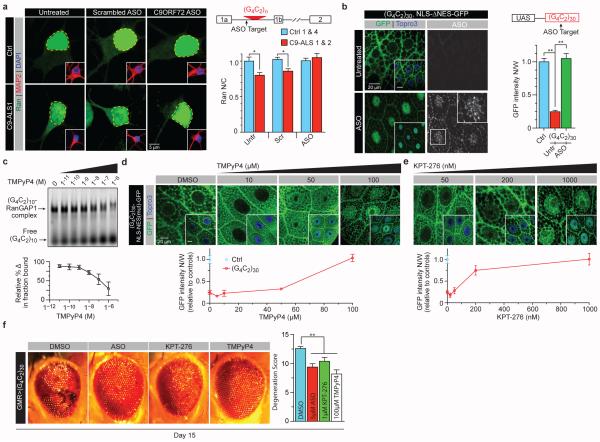
The hexanucleotide repeat expansion (HRE) GGGGCC (G4C2) in C9orf72 is the most common cause of amyotrophic lateral sclerosis (ALS) and frontotemporal dementia (FTD). Recent studies support an HRE RNA gain-of-function mechanism of neurotoxicity, and we previously identified protein interactors for the G4C2 RNA including RanGAP1. A candidate-based genetic screen in Drosophila expressing 30 G4C2 repeats identified RanGAP (Drosophila orthologue of human RanGAP1), a key regulator of nucleocytoplasmic transport, as a potent suppressor of neurodegeneration. Enhancing nuclear import or suppressing nuclear export of proteins also suppresses neurodegeneration. RanGAP physically interacts with HRE RNA and is mislocalized in HRE-expressing flies, neurons from C9orf72 ALS patient-derived induced pluripotent stem cells (iPSC-derived neurons), and in C9orf72 ALS patient brain tissue. Nuclear import is impaired as a result of HRE expression in the fly model and in C9orf72 iPSC-derived neurons, and these deficits are rescued by small molecules and antisense oligonucleotides targeting the HRE G-quadruplexes. Nucleocytoplasmic transport defects may be a fundamental pathway for ALS and FTD that is amenable to pharmacotherapeutic intervention.


Figures

Extended Data Fig. 1
Extended Data Fig. 1. Genetic interaction between G4C2 repeats and components of the nucleocytoplasmic transport machinery
External eye morphology of 1-day-old (a, left column) and 15-day-old (b, left column) flies. Phalloidin staining of the retina of newly eclosed (a, mid column, magnified in right column) and 15-day-old (b, mid column, magnified in right column) flies. Flies expressing 30 G4C2 repeats together with (from top row) RanGAP(GOF), RanGAP RNAi, RanGEF overexpression, RanGEF RNAi, importin α overexpression, or Exportin RNAi. Genotypes (from top row): 1) GMR-GAL4, UAS-(G4C2)30/RanGAPSD; 2) GMR-GAL4, UAS-(G4C2)30/+; UAS-RanGAP RNAi/+; 3) GMR-GAL4, UAS-(G4C2)30/+; UAS-RanGEF/+; 4) GMR-GAL4, UAS-(G4C2)30/UAS-RanGEF RNAi; 5) GMR-GAL4, UAS-(G4C2)30/UAS-imp-α2; 6) GMR-GAL4, UAS-(G4C2)30/+; UAS-Exportin RNAi/+ (BL31353). (c) Quantification of G4C2 mRNA levels by qRT-PCR. (d) Flight assay. The top of the graduated cylinder is “0”, and thus decreased landing height represents better flight ability. Genotypes (from left lane): 1 and 2) UAS-(G4C2)30/+; elavGS-GAL4/+; 3) UAS-(G4C2)30/+; elavGS-GAL4/UAS-RanGAP. (*p<0.05, **p<0.01)
Extended Data Fig. 2
Extended Data Fig. 2. RanGAP does not rescue developmental defects caused by G4C2 repeats
(a) Staining of the active zone component Bruchpilot (Brp) was used to identify active zones in the Type Ib NMJ of muscle 4 in abdominal segments 3 and 4. (b) Quantification of active zone number. (c) Electrophysiology recording of NMJ in muscle 6/7 of abdominal segments 3 and 4. Evoked junctional potential (EJP) (d), miniature EJP (mEJP) amplitude (e), quantal content (f), and mEJP frequencies (g) are shown. Genotypes: 1) Ctrl: OK371-GAL4/+; 2) (G4C2)30: OK371-GAL4/+; UAS-(G4C2)30/+; 3) (G4C2)30 RanGAP OE: OK371-GAL4/+; UAS-(G4C2)30/UAS-RanGAP. (*p<0.05, **p<0.01, ****p<0.0001)
Extended Data Fig. 3
Extended Data Fig. 3. Dot blot of GR and GP dipeptide proteins
Dot blot of GR (a) and GP (b) compared with Actin control. “hs” indicates heat-shock GAL4, and a heat-shock was required to induce detectable polyGR as described. A transgenic line UAS-(G4C2)36 previously shown to generate polyGR and polyGP DPRs under certain conditions was used as a positive control.
Extended Data Fig. 4
Extended Data Fig. 4. RanGAP/RanGAP1 binds to G4C2 repeats
(a) SDS PAGE showing purified human RanGAP1. (b) EMSA for RanGAP1 with (CUG)20, (C4G2)10, or (G4C2)10 RNA hairpins. (c) EMSA for RanGAP1 with increasing length of repeats that were annealed in the presence of K+ to promote RNA G-quadruplex formation. (d) Plot of the fraction bound from the EMSAs performed with RanGAP1 and RNA repeats shown in (b) and (c). Similar RNA nucleotide lengths but different binding preferences indicate RanGAP1 has a structure- and sequence-dependent RNA binding mode (top panel). All data was fit using a hyperbolic and linear regression, then the RanGAP1 binding model determine based on the r2 values for the best fit (n=2). The length-dependent binding of RanGAP1 fits best to a hyperbolic regression, which demonstrates specific binding to the (G4C2)n G-quadruplex conformation, and the fraction bound increases with increasing nucleotide length (bottom panel). The fraction bound for the RNA hairpins fit best to a linear regression, which indicates nonspecific or less specific binding to RanGAP1. The k1/2s for specific binding of RanGAP1 to the G-quadruplex RNA conformation are 162, 39, and 11 nM for (G4C2)4, (G4C2)6.5, and (G4C2)10, respectively. (e) The RanGAP1•(G4C2)10 RNA G-quadruplex complex is resistant to nonspecific RNA competitors and ASOs (n=1).
Extended Data Fig. 5
Extended Data Fig. 5. RanGAP/RanGAP1 is mislocalized in C9-ALS S2 and iPS cells
(a) S2 cells transfected with RanGAP-HA (first column) or RanGAP-HA and (G4C2)30 (second column) are co-stained with HA (red), cleaved Dcp-1 (green), TO-PRO3 (blue). As a control, S2 cells treated with DMSO (third column) or actinomycin (right column) are co-stained with cleaved Dcp-1 (green) and TO-PRO3 (blue). (b) S2 cells transfected with G4C2 were co-stained with a Ran antibody (red) and TO-PRO3 (blue). (c) Abnormal aggregated RanGAP1varibaly observed in C9-ALS iPS neurons that is largely absent from control iPS neurons. Arrows, abnormal RanGAP1 staining. (d) Single microscopic plane of aggregated RanGAP1 colocalized with Nup205 at the nuclear membrane (Lamin B) in C9-ALS iPS neurons. Single immuno-label view in right panels for nup205, RanGap1 and Lamin B, with x-y and x-z projections. (e) Cytoplasmic RanGAP1 aggregates can colocalize with ubiquitin in C9-ALS iPS neurons.
Extended Data Fig. 6
Extended Data Fig. 6. Electrophysiological and immunocytochemical characterization of iPS neurons and astroglia
(a) (a’), IR-DIC images of iPSC neurons from control (left panel) and C9ORF72 (right panel) patient cells. b’-d’, Representative action potentials in response to somatic current injections (70pA) in iPSC neurons. The majority of cells from both groups displayed either single, adaptive or repetitive responses as demonstrated previously. These action potentials were blocked by TTX treatment. (b) Quantification of iPSNs markers showing glutamatergic and islet1+ iPS neurons. (c) iPS cells differentiated into neurons include phenotypic markers such as islet-1, HB9, ChAT (choline acetyl transferase, motor neuron); Tuj1, MAP2, SMI32 (cytoskeletal), VGLUT1 (vesicular glutamate transporter 1), NMDAR1 (NMDA receptor), SYT1, SYP (synaptophysin, synaptotagmin, synaptic markers). (d) Astroglia markers include ALDH1 (universal astroglial marker) and GFAP (reactive astroglia). (e,f) Normal (e’) and C9ORF72 (f’) patient cells displayed mEPSCs that were sensitive to NBQX treatment, suggesting functional synaptic input. (g’-i’), Resting membrane potential, membrane capacitance, and membrane resistance were comparable in both groups.
Extended Data Fig. 7
Extended Data Fig. 7. Additional human RanGAP1 and nup 107 pathology in C9-ALS brain
(a) High power images of motor cortex reveals aberrant nuclear localization of RanGAP1 ,compared to non C9 control tissue, including various nuclear aggregate pathologies (right panels) (b) Aberrant RanGAP1 nuclear aggregates were not readily observed in C9-ALS cerebellar cortex molecular layer (ML), Purkinje cells (PK) or granule cell (GL) layer when compared to non C9-ALS control cerebellum. Number in upper right of each panel identifies autopsy specimen (Supplemental Table 2). (c) Nup107 was also aggregated at the nuclear membrane in C9-ALS motor cortex cells when compared to non C9-control tissues.
Extended Data Fig. 8
Extended Data Fig. 8. C9ORF72 HRE disrupts the cytoplasmic/nuclear Ran gradient
(a) Representative images of disrupted N/C Ran gradient in C9-ALS ChAT+ iPS neurons. (b-c) Representative images and quantification of control (top row) or C9-ALS iPS neurons (bottom row) expressing Ran-GFP that are co-stained with Ran and MAP2. Both Ran antibody and Ran-GFP indicate a reduced N/C Ran ratio. (d) Overexpression of RanGAP1-GFP rescues the N/C Ran ratio in C9-ALS iPS neurons. (e) Control iPS neurons treated with Tunicamycin show enhanced level of activated Caspase 3 in the soma but no change in N/C Ran localization compared to controls with vehicle treatment. (f) RanGAP1 is not aggregated in Ctrl and C9-ALS iPS astroglia. (g) Representative image of N/C Ran in C9-ALS astrocytes when identified using the pan astroglial ALDH1 marker. (h) N/C Ran is not altered in C9-ALS astroglia when comparing astrocytes of a similar size. (i) Mean intensity fluorescence (MIF) of nuclear Ran does not differ in ctrl or C9-ALS astroglia. (j) Representative image of C9-ALS iPS neuron with G4C2 RNA foci in approximately 40% of MAP2+ neurons at 50 - 70 DIV. Number of C9-ALS iPS neurons with RNA foci is reduced with C9ORF72 RNA targeting ASOs compared to scrambled/non-targeting ASOs to <10% of iPS neurons. (k) ASOs that reduce G4C2 RNA foci also enhance N/C Ran and N/C TDP-43 ratios. (*, p<0.05; **, p<0.01; ****, p<0.0001).
Extended Data Fig. 9
Extended Data Fig. 9. C9orf72 HRE causes nucleocytoplasmic transport defects
(a) Quantification of the nuclear GFP intensity in Fig. 4a. (b) Immunoblot of the GFP levels in Fig. 4a. (c) Quantification of the TBPH N/C ratio in Fig. 4a. (d) Wild type control and (G4C2)30 -expressing motor neurons expressing NLS-NES-GFP (left two columns) or NLS-ΔNES-GFP (right two columns) are co-stained with a GFP antibody (green) and TO-PRO3 (blue) (top row). The GFP signal is shown separately in the bottom row. Genotypes (from left): 1) OK371-GAL4/UAS-NLS-NES-GFP (II); 2) OK371-GAL4/UAS-NLS-NES-GFP; UAS-(G4C2)30/+; 3) OK371-GAL4/+; UAS-NLS-NES(P12)-GFP/+; 4) OK371-GAL4/+; UAS-NLS-NES(P12)-GFP/UAS-(G4C2)30. (e) The N/C TDP-43 ratio directly correlates with the N/C Ran GTPase ratio in both control and C9-ALS iPS neurons over two differentiations. N/C TDP-43 vs. N/C Ran - Ctrl #2: p<0.0001, r2= 0.58; C9-ALS #3 Dif #1: p<0.0001, r2=0.55; C9-ALS #3 Dif #2: p<0.0001, r2=0.69.
Extended Data Fig. 10
Extended Data Fig. 10. Model
(a) In normal cases, RanGAP is tethered onto the NPC via RanBP2, where it activates Ran[GTP] hydrolysis to produce Ran[GDP]. Ran[GDP] dissociates from and activates Importin αβ complex to import NLS-NES containing protein cargos such as TDP-43. (b) In the nucleus, RanGEF converts Ran[GDP] to Ran[GTP] that is required for the dissociation of the NLS-Importin αβ complex and the export of NES protein cargos. (c) In C9-ALS, G4C2 HRE binds and sequesters RanGAP1, leading to an increase in cytoplasmic Ran[GTP]. High cytoplasmic Ran[GTP] prevents the formation of the NLS-Importin αβ complex thereby disrupting the N/C Ran gradient and impairing nuclear import of NLS-containing proteins. (d) Dipeptide repeat proteins translated from the G4C2 RNA can be toxic when expressed at high levels but it is unclear whether they contribute to nucleocytoplasmic trafficking deficits in the Drosophila since they are not detected at the time of degeneration. The C9ORF72 HRE sense strand appears to be contributing to nucleocytoplasmic trafficking deficits in human iPS neurons and fly model systems as small molecules and antisense oligonucleotides targeting the sense RNA substantially suppress the nuclear import phenotypes and neurodegeneration as a result of the G4C2 repeat RNA expression. Overall, the data are most consistent with an RNA-mediated mechanism with evidence that includes: 1) RanGAP1 was identified as one of 19 sequence-specific interactors of G4C2 RNA; 2) RanGAP1 is a strong genetic modifier of G4C2 RNA-mediated degeneration in Drosophila under conditions in which polyGR and polyGP are not detected; 3) RanGAP1 directly and potently interacts with HRE RNA and 4) G4C2 RNA foci can colocalize with RanGAP1.
Fig. 1
Fig. 1. Genetic interaction between G4C2 repeats and nucleocytoplasmic transport machinery
External eye morphology of 1-day-old (a, left panels) and 15-day-old (b, left panels) flies. Phalloidin staining of the retina of 1-day-old (a, mid panels, magnified in right panels) and 15-day-old (b, mid panels, magnified in right panels) flies. Wild type control (top row); flies expressing 30 G4C2 repeats (mid row); flies expressing 30 G4C2 repeats and overexpressing RanGAP (bottom row). Genotypes: (top row) GMR-GAL4/+; (mid row) GMR-GAL4, UAS-(G4C2)30/+; (bottom row) GMR-GAL4, UAS-(G4C2)30/+; UAS-RanGAP/+. Quantification of external morphology (c) and rhabdomere number (d). (*, p<0.05; **, p<0.01)
Fig. 2
Fig. 2. RanGAP binds to G4C2 repeats and is mislocalized along with NPC components
(a) EMSA of human RanGAP1 and repeat RNA in the G-quadruplex conformation. (b) RanGAP-HA pull-down in the absence (lane 4-6) or presence (lane 7-9) of biotinylated G4C2 RNA repeats, immunoblotted with a HA antibody. Lane 1-3: 1/50 input. (c) Wild type control (left) and G4C2 -HRE (right) S2 cells expressing RanGAP-HA co-stained with an antibody against HA (red) and TO-PRO3 (blue). (d) RanGAP1 co-localization with G4C2 RNA foci (dotted box; projected view, single plane, high magnification) in a C9-ALS iPS neuron in confocal single plane image.(e) RanGAP1 immunostaining in non-neurological control and C9ORF72 ALS motor cortex and cerebellum showing intense nuclear localization and aberrant nuclear aggregates, (individual patient identifier in upper right corner, Supplemental Table 2). (f) Abnormal nuclear localization of nup205 in C9ORF72 human motor cortex cells.
Fig. 3
Fig. 3. C9ORF72 HRE disrupts the nuclear/cytoplasmic Ran gradient
(a) S2 cells co-transfected with GFP and (G4C2)30 (bottom row) or control (top row) and stained with a Ran antibody (red) and TO-PRO3 (blue). (b) iPSNs from control and C9-ALS patients showing mislocalization of Ran to the cytoplasm in C9-ALS. (c) Quantification of N/C Ran gradient in neurons from four control and four C9-ALS iPS lines when normalized to control. N/C Ran ratio is reduced in C9-ALS neurons. Each symbol represent mean of up to 228 neurons per line (see Supplemental Table 4). Bar indicates mean N/C Ran of four control or C9-ALS lines; error bars indicate SEM (d) N/C Ran histogram shows higher frequency of lower N/C ratios in four C9-ALS lines as compared to the four control lines. N/C ratios are presented as raw values. (e) C9-ALS ChAT+ neurons show similar reduction of N/C Ran. N/C Ran is normalized to controls and up to 60 neurons were tested per line (see Supplemental Table 4), (**, p<0.01****, p<0.0001).
Fig. 4
Fig. 4. C9ORF72 HRE causes nucleocytoplasmic transport defects
(a) Salivary glands expressing NLS-NES-GFP or NLS-ΔNES-GFP are co-stained for GFP , TBPH (red), and nuclei (blue, insets). (b) Representative images of NLS-tdTomato-NES FRAP analysis in control and C9-ALS iPS neurons (control, n=34; C9-ALS n=29). (c) Quantification of nuclear recovery (FRAP) of two C9-ALS and control iPS lines. Error bars indicate SEM. (d) Representative images of control and C9-ALS iPS neurons. Arrows indicate higher cytoplasmic Ran and TDP-43 signals. (e) Quantification of mean N/C ratio of TDP-43 of four control and four C9-ALS lines when normalized to controls. Each symbol represents up to 49 neurons per line (see Supplemental Table 4). Error bars indicate SD. (f) Histogram shows higher frequency of lower N/C TDP-43 ratio. N/C ratios are presented as raw values. (g) N/C TDP-43 directly correlates with N/C Ran ratio across all lines tested. N/C TDP-43 vs. N/C Ran - Control: p<0.0001, r2= 0.2980; C9-ALS: p<0.0001, r2=0.1657. (*, p<0.05; **, p<0.01; ***, p<0.001)
Fig. 5
Fig. 5. Pharmacological rescue of nucleocytoplasmic transport defects
(a) Neuronal N/C Ran ratio in control and two C9-ALS iPS lines show increased cytoplasmic Ran levels in untreated and scrambled ASO-treated C9-ALS iPS neurons (n=50 neurons/line; see Supplemental Table 4). (b) Salivary glands of larvae expressing G4C2 HRE and NLS-ΔNES-GFP are untreated (top row) or treated with 5μM ASO and are co-stained for GFP (green), TO-PRO3 (blue) and ASO (white). (c) EMSA of RanGAP1 and repeat RNA in the presence of TMPyP4 (top panel) and relative change in fraction bound (bottom panel). (d-e) salivary glands of larvae expressing G4C2 HRE and NLS-ΔNES-GFP are treated with (d) different concentrations of TMPyP4 or (e) KPT-276 versus vehicle control and are co-stained for GFP (green) and TO-PRO3 (blue). (f) The effects of ASO, KPT-276, and TMPyP4 on the external morphology of eyes expressing G4C2 repeats. (*, p<0.05; **, p<0.01)

Comment in

References

    1. Majounie E, et al. Frequency of the C9orf72 hexanucleotide repeat expansion in patients with amyotrophic lateral sclerosis and frontotemporal dementia: a cross-sectional study. Lancet Neurol. 2012;11:323–330. - PMC - PubMed
    1. Dejesus-Hernandez M, et al. Expanded GGGGCC hexanucleotide repeat in noncoding region of C9ORF72 causes chromosome 9p-linked FTD and ALS. Neuron. 2011;72:245–256. - PMC - PubMed
    1. Renton AE, et al. A hexanucleotide repeat expansion in C9ORF72 is the cause of chromosome 9p21-linked ALS-FTD. Neuron. 2011;72:257–268. - PMC - PubMed
    1. Ash PE, et al. Unconventional translation of C9ORF72 GGGGCC expansion generates insoluble polypeptides specific to c9FTD/ALS. Neuron. 2013;77:639–646. - PMC - PubMed
    1. Mori K, et al. The C9orf72 GGGGCC repeat is translated into aggregating dipeptide-repeat proteins in FTLD/ALS. Science. 2013;339:1335–1338. - PubMed

Publication types

MeSH terms