. 2015 Sep 10;525(7568):261-4.
doi: 10.1038/nature14971. Epub 2015 Aug 26.

A spatial model predicts that dispersal and cell turnover limit intratumour heterogeneity

Affiliations

A spatial model predicts that dispersal and cell turnover limit intratumour heterogeneity

Bartlomiej Waclaw et al. Nature. .

Abstract

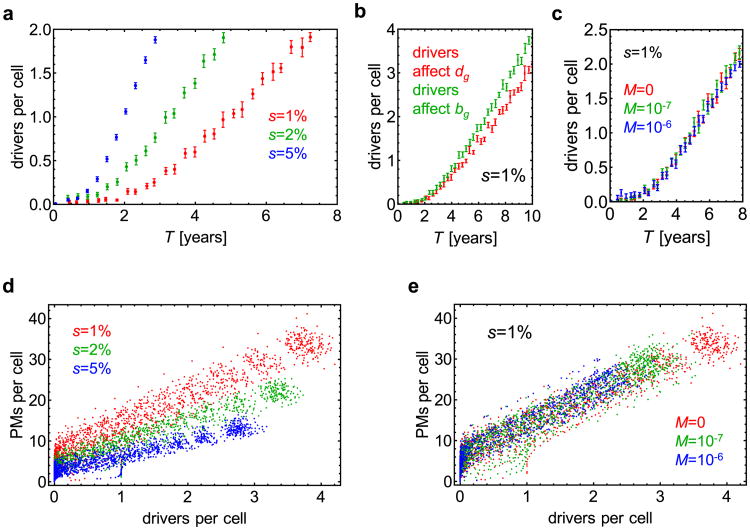
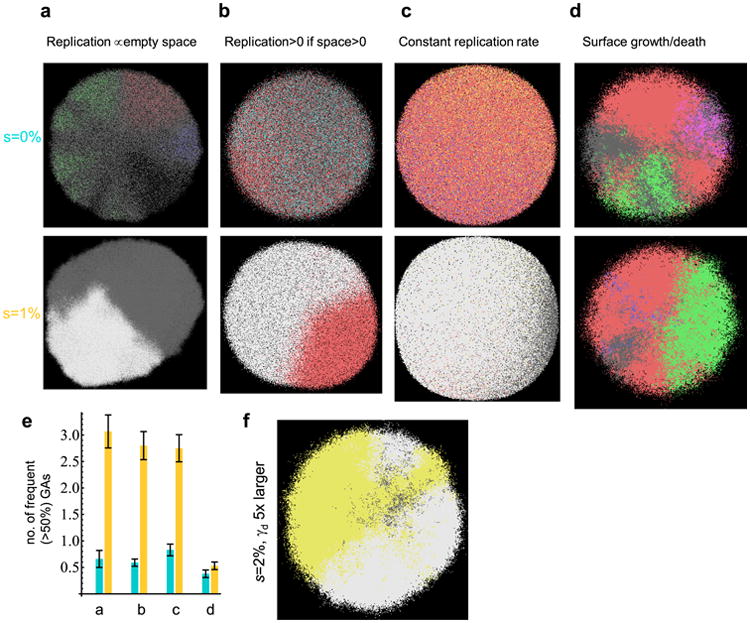
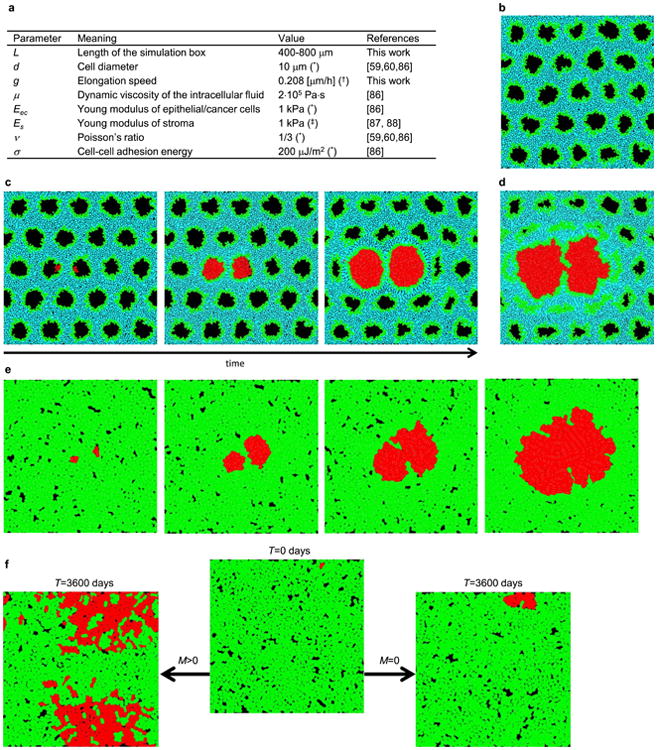
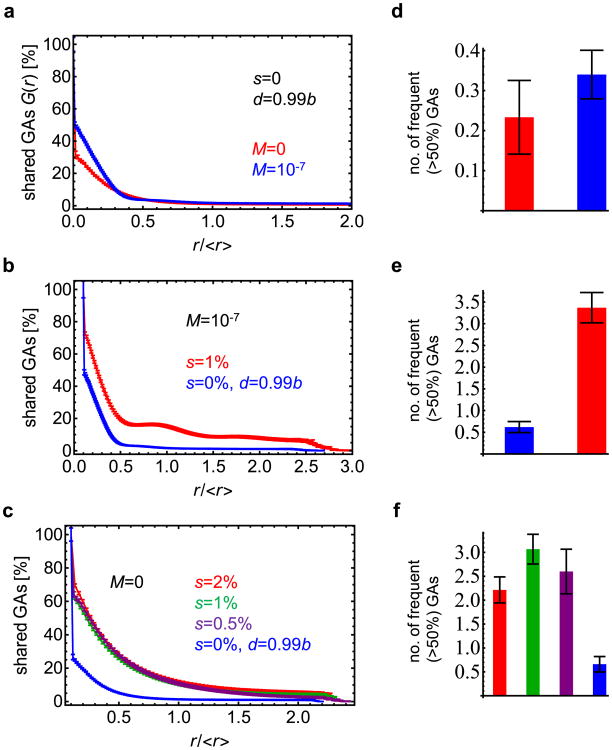
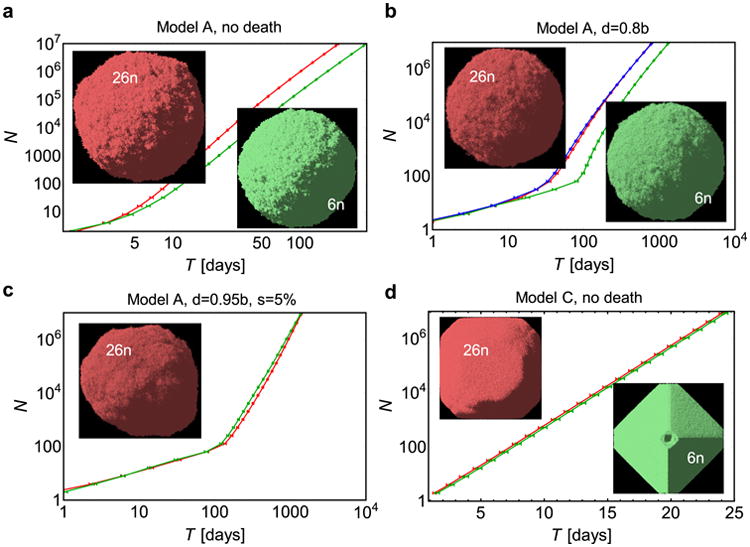
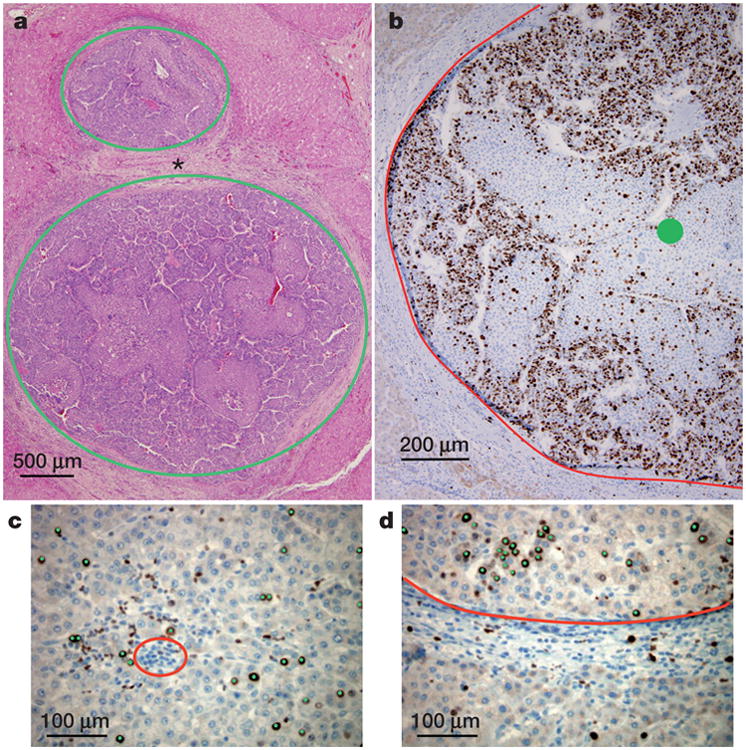
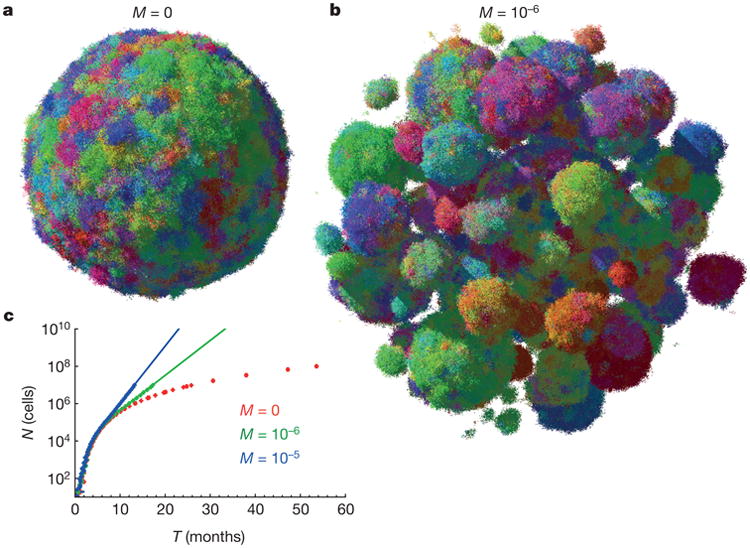
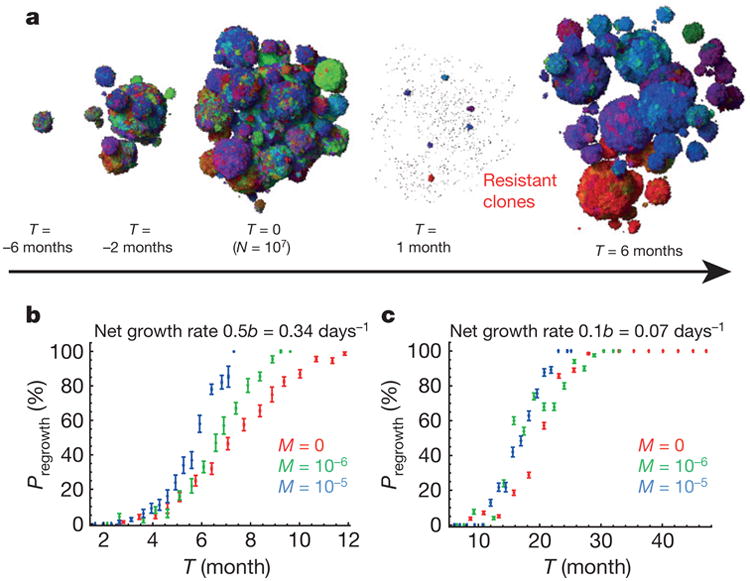
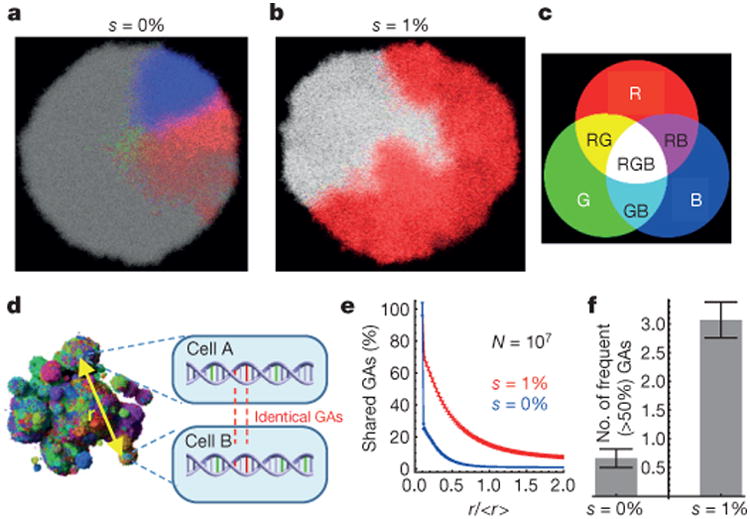
Most cancers in humans are large, measuring centimetres in diameter, and composed of many billions of cells. An equivalent mass of normal cells would be highly heterogeneous as a result of the mutations that occur during each cell division. What is remarkable about cancers is that virtually every neoplastic cell within a large tumour often contains the same core set of genetic alterations, with heterogeneity confined to mutations that emerge late during tumour growth. How such alterations expand within the spatially constrained three-dimensional architecture of a tumour, and come to dominate a large, pre-existing lesion, has been unclear. Here we describe a model for tumour evolution that shows how short-range dispersal and cell turnover can account for rapid cell mixing inside the tumour. We show that even a small selective advantage of a single cell within a large tumour allows the descendants of that cell to replace the precursor mass in a clinically relevant time frame. We also demonstrate that the same mechanisms can be responsible for the rapid onset of resistance to chemotherapy. Our model not only provides insights into spatial and temporal aspects of tumour growth, but also suggests that targeting short-range cellular migratory activity could have marked effects on tumour growth rates.


Figures

Extended Data Figure 1
Extended Data Figure 1. Details of the model
a, A sketch showing how dispersal is implemented: (1) A ball of cells of radius Ri, in which the centre is at Xi, is composed of tumour cells and normal cells (blue and empty squares in the zoomed-in rectangle (2)). A cell at position xi with respect to the centre of the ball attempts to replicate (3). If replication is successful, the cell migrates with probability M and creates a new microlesion (4). The position Xj of this new ball of cells is determined as the endpoint of the vector that starts at Xi and has direction xi and length Ri. b, Overlap reduction between the balls of cells. When a growing ball begins to overlap with another ball (red), they are both moved apart along the line connecting their centres of mass (green line) by as much as necessary to reduce the overlap to zero. The process is repeated for all overlapping balls as many times as needed until there is no overlap. c, Summary of all parameters used in the model. If, for a given parameter, many different values have been used in different plots, a range of values used is shown. Birth and death rates can also depend on the number of driver mutations, see Methods. Asterisk, parameter estimated from other quantities available in the literature.
Extended Data Figure 2
Extended Data Figure 2. Simulation snapshots
a, b, A few snapshots of tumour growth for no dispersal, and d = 0 (a) and d = 0.9b (b). To visualize clonal sectors, cells have been colour-coded by making the colour a heritable trait and changing each of its RGB components by a small random fraction whenever a cell mutates. The initial cell is grey. Empty space (white) are non-cancer cells mixed with extracellular matrix. Note that images are not to scale. c, Tumour shapes for N = 1 × 10⁷, d = 0.9b, and different dispersal probability M. Images not to scale; the tumour for M = 1 × 10⁻⁵ is larger than the one for M = 0.
Extended Data Figure 3
Extended Data Figure 3. Tumour size as a function of time
a, Growth of a tumour without dispersal (M = 0), for d = 0.8b. For large times (T), the number of cells grows approximately as const × T3. The tumour reaches size N = 1 × 10⁹ cells (horizontal line) after about 100 months (8 years) of growth. b, The same data are plotted in the linear scale, with N replaced by ‘linear extension’ N1/3. c, Tumour size versus time when drivers affect the dispersal probability. In all cases, d = 0.9b, and (1, black) drivers increase the dispersal rate tenfold (q = 9) but have no effect on the net growth rate; (2, red) drivers increase both the net growth rate (s = 10%) and M; (3, green) drivers either (with probability 1/2) increase M tenfold (q = 9) or increase the net growth rate by s = 10%; (4, blue) drivers increase only the net growth rate by s = 10%; and (5, black dashed line) neutral case with M = 1 × 10⁻⁷, which is indistinguishable from (1). In all cases (1–3) the initial dispersal probability M = 1 × 10⁻⁷. Points represent average value over 40–100 simulations per data point, error bars are s.e.m.
Extended Data Figure 4
Extended Data Figure 4. Simulation of targeted therapy
a–c, The total number of cells in the tumour (black) and the number or resistant cells (red) versus time, during growth (T < 0) and treatment (T > 0), for ∼100 independent simulations, for d = 0.5b for T<0. Therapy begins when N = 1 × 10⁶ cells. After treatment, many tumours die out (N decreases to zero) but those with resistant cells will regrow sooner or later. a, M = 0 for all cells at all times. b, M = 0 for all cells for T<0 and M = 10−4 for resistant cells for T>0. c, M = 0 for non-resistant and M = 10−5 for resistant cells at all times. In all three cases, Pregrowth is very similar: 36±5% (mean 6 s.e.m.) (a), 25±4% (b), and 27 ± 6% for (c). dg, Regrowth probability for four treatment scenarios not discussed in the main text. Data points correspond to three dispersal probabilities: M = 0 (red), M = 1 × 10⁻⁵ (green), and M = 1 × 10⁻⁴ (blue). The probability is plotted as a function of tumour size N just before the therapy commences. d, Before treatment, cells replicate only on the surface. Cells in the core are quiescent and do not replicate. Therapy kills cells on the surface and cells in the core resume proliferation when liberated by treatment. e, As in d, but drug is cytostatic and does not kill cells but inhibits their growth. The results for Pregrowth are identical if the drug is cytotoxic and the tumour has a necrotic core (cells die inside the tumour and cannot replicate even if the surface is removed). f, Before treatment, cells replicate and die on the surface. The core is quiescent. Therapy kills cells on the surface (cytotoxic drug). g, As in f, but therapy only inhibits growth (cytostatic drug). In all cases (dg) error bars represent s.e.m. from 8–1,000 simulations per point.
Extended Data Figure 5
Extended Data Figure 5. Accumulation of driver and passenger genetic alterations
ac, The number of drivers per cell in the primary tumour plotted as a function of time (10–100 simulations per point, error bars denote s.e.m.). a, M = 0 and three different driver selective advantages. For s = 1%, cells accumulate on average one driver mutation within 5 years. The time can be significantly lower for very strong drivers (s >1%). b, The rate at which drivers accumulate depends mainly on their selective advantage and not on whether they affect death or birth rate. c, Dispersal does not affect the rate of driver accumulation. d, e, The number of passenger mutations (PMs) per cell versus the number of driver mutations per cell. More passenger mutations are present for smaller driver selective advantage (d), and this is independent of the dispersal probability M(e) in the regime of small M. Data points correspond to independent simulations.
Extended Data Figure 6
Extended Data Figure 6. Genetic diversity in a single lesion for different models
ad, Representative simulation snapshots, with genetic alterations colour-coded asin Fig. 4. Top: s = 0, bottom: s = 1%. a, Model A from the main text in which cells replicate with rates proportional to the number of empty nearby sites. b, Model B, the replication rate is constant and non-zero if there is at least one empty site nearby, and zero otherwise. c, Model C, cells replicate at a constant rate and push away other cells to make space for their progeny. d, Model D, cells replicate/die only on the surface, the interior of the tumour (‘necrotic core’) is static. In all cases, N = 1 × 10⁷, d = 0.99b. e, Number of genetic alterations present in at least 50% of cells for identical parameters as in ad. In all cases except surface growth (d), drivers increase genetic homogeneity, as measured by the number of most frequent genetic alterations. Results averaged over 50–100 simulations, error bars denote s.e.m. f, Model D, with γd = 2 × 10⁻⁴ instead of 4 × 10⁻⁵, that is, drivers occur five times more often. In this case, driver mutations arise earlier than in d, and the tumour becomes more homogeneous.
Extended Data Figure 7
Extended Data Figure 7. The off-lattice model
a, Summary of all parameters used in the model. Asterisk, typical value, varies between different types of tissues; dagger symbol, equivalent to 24 h minimal doubling time; double dagger symbol, based on the assumption that macroscopic elastic properties of tissues such as liver, pancreases or mammary glands are primarily determined by the elastic properties of stroma. b, Simulation snapshot of a normal tissue before the invasion of cancer cells. c, Two balls of cancer cells in two nearby ducts repel each other as they grow as a consequence of mechanical forces exerted on each other. d, The balls coalesce if growth is able to break the separating extracellular matrix. e, If the balls are not encapsulated, they quickly merge. f, Isolated balls of cells are not required to speed up growth; migration (left) can cause the tumour to expand much faster even if individual microlesions merge together, as opposed to the case with no migration (right).
Extended Data Figure 8
Extended Data Figure 8. Genetic diversity quantified
a, Tumours are much more genetically heterogeneous in the absence of driver mutations (s = 0) (see Fig. 4). The plot shows the fraction G(r) of genetic alterations (GAs) shared between the cells as function of their separation (distance r) in the tumour. The fraction quickly decreases with increasing r. The distance in the figure is normalized by the average distance <r> between any two cells in the tumour. For a spherical tumour, <r> is approximately equal to half of the tumour diameter. b, Fraction of shared genetic alterations for s = 1% and s = 0%, N = 1 × 10⁷, and M = 1 × 10⁻⁷. In the presence of drivers, G(r) decays slower, indicating more homogeneous tumours. c, The exact value of the selective advantage of driver mutations is not important (all curves G(r) look the same, except for s = 0) as long as s>0. df, Number of genetic alterations present in at least 50% of cells for identical parameters as in ac, correspondingly. Drivers substantially increase the level of genetic homogeneity. In all panels the results have been averaged over 30–100 simulations, with error bars as s.e.m.
Extended Data Figure 9
Extended Data Figure 9. Growth curves for the 26-nearest neighbours (26n, red curves) and the 6-nearest neighbours (6n, green curves) models
a, Model A (as in the main text), no death. The tumour grows about twice as slow in the 6n model. Pictures show tumour snapshots for both models; there is no visible difference in the shape. b, Model A, death d = 0.8b. The additional blue curve is for the 6n model, with modified replication probability to account for missing neighbours as explained in the Supplementary Information. c, Model A, with death d = 0.95b, and drivers s = 5%. There is very little difference in the growth curves between the 6n and 26n models. A small asymmetry in the shape is caused by faster-growing cells with driver mutations. d, Model C (exponential growth). Growth is the same in both 6n and 26n models, but the shape is more aspheric for the 6n model. This is probably caused by shifting cells along the coordinate axes and not along the shortest path to the surface when making space for new cells. All plots show the mean (average over 50–100 simulations) and s.e.m.
Figure 1
Figure 1. Structure of solid neoplasms
a, Hepatocellular carcinoma composed of balls of cells (circled in green) separated by non-neoplastic tissue (asterisk). b, Adjacent section of the bottom tumour in a immunolabelled with the proliferation marker Ki67. The edge of the tumour is delineated in red; the centre is marked with a green circle. Proliferation is decreased in the centre when compared to the edge of the neoplasm. c, d, Higher magnification of the centre (c) and the edge (d) with each proliferating neoplastic cell marked by a green dot. The blue nuclei without green dots are non-proliferating. The red circle in c demonstrates an example of cells (inflammatory cells) that were not included in the count of neoplastic cells. The neoplastic tissue in d is above the red line; non-neoplastic (normal liver) is below the red line. Comparison of c with d shows that proliferation of neoplastic cells is decreased in the centre as compared to the edge of the lesion (quantified in Extended Data Table 1).
Figure 2
Figure 2. Short-range dispersal affects size, shape and growth rate of tumours
a, b, A spherical lesion in the absence of dispersal (M = 0) (a) and a conglomerate of lesions (b), each initiated by a cell that has migrated from a previous lesion, for low but non-zero migration (M = 10−6). Colours reflect the degree of genetic similarity; cells with similar colours have similar genetic alterations. The death rate is d = 0.8b, which corresponds to a net growth rate of 0.2b = 0.14 days−1, and N = 107 cells. c, Dispersal (M = 0) causes the tumour to grow faster in time. Each point = 100 samples, error bars (too small to be visible) are s.e.m. Continuous lines (extrapolation) are 6,000 × 100.43T (green), 1,000 × 100.7T (blue).
Figure 3
Figure 3. Treatment success rates depend on the net growth rate of tumours
a, Time snapshots before and during therapy (M = 10−6). Resistant subpopulations that cause the tumour to regrow after treatment can be seen at T = 1 month. b, c, Probability of tumour regrowth (Pregrowth) as a function of time after treatment initiation, for different dispersal probabilities (M) and net growth rates of the resistant cells. A higher net growth rate (b) leads to a high regrowth probability, so that 50% of tumours regrow 6 months after treatment is initiated when M = 10−5. c, Tumours with lower net growth rates require >20 months to achieve the same probability of regrowth. Number of samples = 1 to 800 per point (282 on average). Error bars are s.e.m. See Methods for details.
Figure 4
Figure 4. Genetic diversity is strongly reduced by the emergence of driver mutations
af, For all, M = 0 and the initial net growth rate = 0.007 days−1 (d = 0.99b). The three most abundant genetic alterations (GAs) have been colour-coded using red (R), green (G) and blue (B) (c). Each section is 80 cells thick. Combinations of the three basic colours correspond to cells having two or three of these genetic alterations. a, No drivers—separated, conical sectors emerge in different parts of the lesion, each corresponding to a different clone. b, Drivers with selective advantage s = 1% lead to clonal expansions and many cells have all three genetic alterations (white area). d, Genetic diversity can be determined quantitatively by randomly sampling pairs of cells separated by distance r and counting the number of shared genetic alterations. e, The number of shared genetic alterations versus the normalized distance r/<r> decreases much more slowly for the case with (red) than without (blue) driver mutations. f, The total number of genetic alterations present in at least 50% of all cells is much larger for s = 1% than for s = 0%. Number of samples = 50 per data point. Error bars are s.e.m.

Comment in

  • Cancer: A moving target.
    Komarova NL. Komarova NL. Nature. 2015 Sep 10;525(7568):198-9. doi: 10.1038/nature15210. Epub 2015 Aug 26. Nature. 2015. PMID: 26308890 No abstract available.

References

    1. Vogelstein B, et al. Cancer genome landscapes. Science. 2013;339:1546–1558. - PMC - PubMed
    1. Yachida S, et al. Distant metastasis occurs late during the genetic evolution of pancreatic cancer. Nature. 2010;467:1114–1117. - PMC - PubMed
    1. Sottoriva A, et al. Intratumor heterogeneity in human glioblastoma reflects cancer evolutionary dynamics. Proc Natl Acad Sci USA. 2013;110:4009–4014. - PMC - PubMed
    1. Navin N, et al. Tumour evolution inferred by single-cell sequencing. Nature. 2011;472:90–94. - PMC - PubMed
    1. Gerlinger M, et al. Intratumor heterogeneity and branched evolution revealed by multiregion sequencing. N Engl J Med. 2012;366:883–892. - PMC - PubMed

Publication types