

Sleep modulates cortical connectivity and excitability in humans: Direct evidence from neural activity induced by single-pulse electrical stimulation
- PMID: 26309062
- PMCID: PMC6869089
- DOI: 10.1002/hbm.22948
Sleep modulates cortical connectivity and excitability in humans: Direct evidence from neural activity induced by single-pulse electrical stimulation
Abstract
Sleep-induced changes in human brain connectivity/excitability and their physiologic basis remain unclear, especially in the frontal lobe. We investigated sleep-induced connectivity and excitability changes in 11 patients who underwent chronic implantation of subdural electrodes for epilepsy surgery. Single-pulse electrical stimuli were directly injected to a part of the cortices, and cortico-cortical evoked potentials (CCEPs) and CCEP-related high-gamma activities (HGA: 100-200 Hz) were recorded from adjacent and remote cortices as proxies of effective connectivity and induced neuronal activity, respectively. HGA power during the initial CCEP component (N1) correlated with the N1 size itself across all states investigated. The degree of cortical connectivity and excitability changed during sleep depending on sleep stage, approximately showing dichotomy of awake vs. non-rapid eye movement (REM) [NREM] sleep. On the other hand, REM sleep partly had properties of both awake and NREM sleep, placing itself in the intermediate state between them. Compared with the awake state, single-pulse stimulation especially during NREM sleep induced increased connectivity (N1 size) and neuronal excitability (HGA increase at N1), which was immediately followed by intense inhibition (HGA decrease). The HGA decrease was temporally followed by the N2 peak (the second CCEP component), and then by HGA re-increase during sleep across all lobes. This HGA rebound or re-increase of neuronal synchrony was largest in the frontal lobe compared with the other lobes. These properties of sleep-induced changes of the cortex may be related to unconsciousness during sleep and frequent nocturnal seizures in frontal lobe epilepsy.
Keywords: CCEP; consciousness; frontal lobe epilepsy; high-gamma activity; non-REM; sleep.
© 2015 Wiley Periodicals, Inc.
Figures


 N = 11) and other lobes (
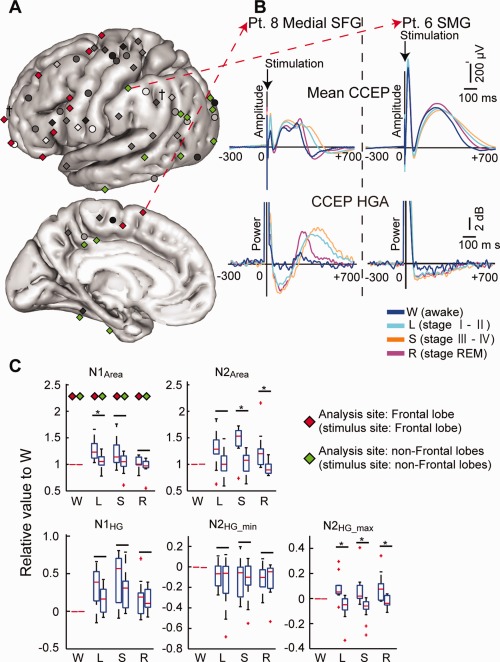
 N = 13). B: Representative CCEP waveform and its HGA counterpart in the frontal (superior frontal gyrus [SFG] of Pt. 8) and parietal (the supramarginal gyrus [SMG] of Pt. 6) lobes. C: Values relative to W were calculated in the sleep stages (L, S, R) for each index, and these values were compared between the Frontal lobe and the non‐Frontal lobes. In each sleep stage, the left column denotes values of the Frontal sites and the right column denotes values of the non‐Frontal sites (N = 11 in L, S, R for Frontal sites; and N =13 in L, S and N =11 in R for non‐Frontal sites). *Statistically significant at P < 0.05, Mann–Whitney U test, corrected by FDR = 0.05. Note the significant difference in N2HG_max (L, S, R) between Frontal and non‐frontal sites. The direction of the change was opposite: increase in frontal sites and decrease in non‐Frontal sites. The other conventions including the box plots are the same as for Figure 2.
Similar articles
-
Phasic REM Transiently Approaches Wakefulness in the Human Cortex-A Single-Pulse Electrical Stimulation Study.Sleep. 2017 Aug 1;40(8). doi: 10.1093/sleep/zsx077. Sleep. 2017. PMID: 28482107
-
A systematic exploration of parameters affecting evoked intracranial potentials in patients with epilepsy.Brain Stimul. 2020 Sep-Oct;13(5):1232-1244. doi: 10.1016/j.brs.2020.06.002. Epub 2020 Jun 3. Brain Stimul. 2020. PMID: 32504827 Free PMC article.
-
Probabilistic functional tractography of the human cortex revisited.Neuroimage. 2018 Nov 1;181:414-429. doi: 10.1016/j.neuroimage.2018.07.039. Epub 2018 Jul 17. Neuroimage. 2018. PMID: 30025851 Free PMC article.
-
Single pulse electrical stimulation to probe functional and pathological connectivity in epilepsy.Seizure. 2017 Jan;44:27-36. doi: 10.1016/j.seizure.2016.11.003. Epub 2016 Nov 14. Seizure. 2017. PMID: 27939100 Free PMC article. Review.
-
Intraoperative Brain Mapping by Cortico-Cortical Evoked Potential.Front Hum Neurosci. 2021 Feb 18;15:635453. doi: 10.3389/fnhum.2021.635453. eCollection 2021. Front Hum Neurosci. 2021. PMID: 33679353 Free PMC article. Review.
Cited by
-
Sleep and wake in a model of the thalamocortical system with Martinotti cells.Eur J Neurosci. 2024 Feb;59(4):703-736. doi: 10.1111/ejn.15836. Epub 2022 Nov 9. Eur J Neurosci. 2024. PMID: 36215116 Free PMC article.
-
Cortical Responses to Input From Distant Areas are Modulated by Local Spontaneous Alpha/Beta Oscillations.Cereb Cortex. 2019 Feb 1;29(2):777-787. doi: 10.1093/cercor/bhx361. Cereb Cortex. 2019. PMID: 29373641 Free PMC article.
-
Consciousness and complexity: a consilience of evidence.Neurosci Conscious. 2021 Aug 30;2021(2):niab023. doi: 10.1093/nc/niab023. eCollection 2021. Neurosci Conscious. 2021. PMID: 38496724 Free PMC article. Review.
-
Spatial-Temporal Functional Mapping Combined With Cortico-Cortical Evoked Potentials in Predicting Cortical Stimulation Results.Front Hum Neurosci. 2021 Apr 14;15:661976. doi: 10.3389/fnhum.2021.661976. eCollection 2021. Front Hum Neurosci. 2021. PMID: 33935673 Free PMC article.
-
Differential cortical network engagement during states of un/consciousness in humans.Neuron. 2023 Nov 1;111(21):3479-3495.e6. doi: 10.1016/j.neuron.2023.08.007. Epub 2023 Sep 1. Neuron. 2023. PMID: 37659409 Free PMC article.
References
-
- Braun AR, Balkin TJ, Wesensten NJ, Gwadry F, Carson RE, Varga M, Baldwin P, Belenky G, Herscovitch P (1998): Dissociated pattern of activity in visual cortices and their projections during human rapid eye movement sleep. Science 279:91–95. - PubMed
Publication types
MeSH terms
LinkOut - more resources
Full Text Sources
Other Literature Sources
