

Associations between Meteorological Parameters and Influenza Activity in Berlin (Germany), Ljubljana (Slovenia), Castile and León (Spain) and Israeli Districts
- PMID: 26309214
- PMCID: PMC4550247
- DOI: 10.1371/journal.pone.0134701
Associations between Meteorological Parameters and Influenza Activity in Berlin (Germany), Ljubljana (Slovenia), Castile and León (Spain) and Israeli Districts
Abstract
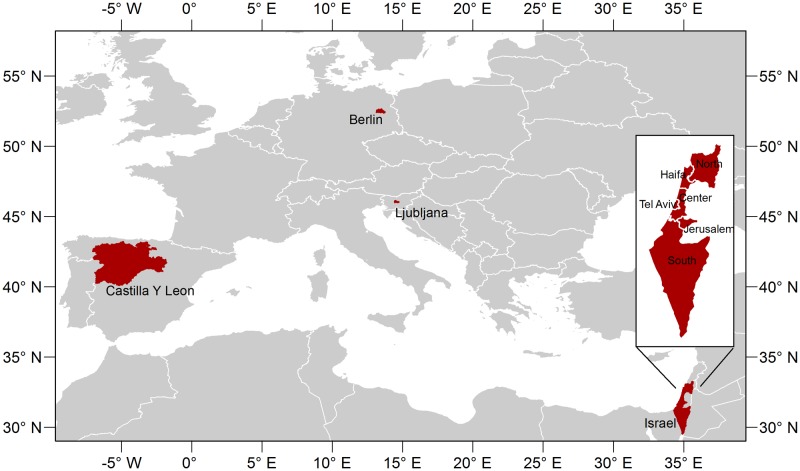
Background: Studies in the literature have indicated that the timing of seasonal influenza epidemic varies across latitude, suggesting the involvement of meteorological and environmental conditions in the transmission of influenza. In this study, we investigated the link between meteorological parameters and influenza activity in 9 sub-national areas with temperate and subtropical climates: Berlin (Germany), Ljubljana (Slovenia), Castile and León (Spain) and all 6 districts in Israel.
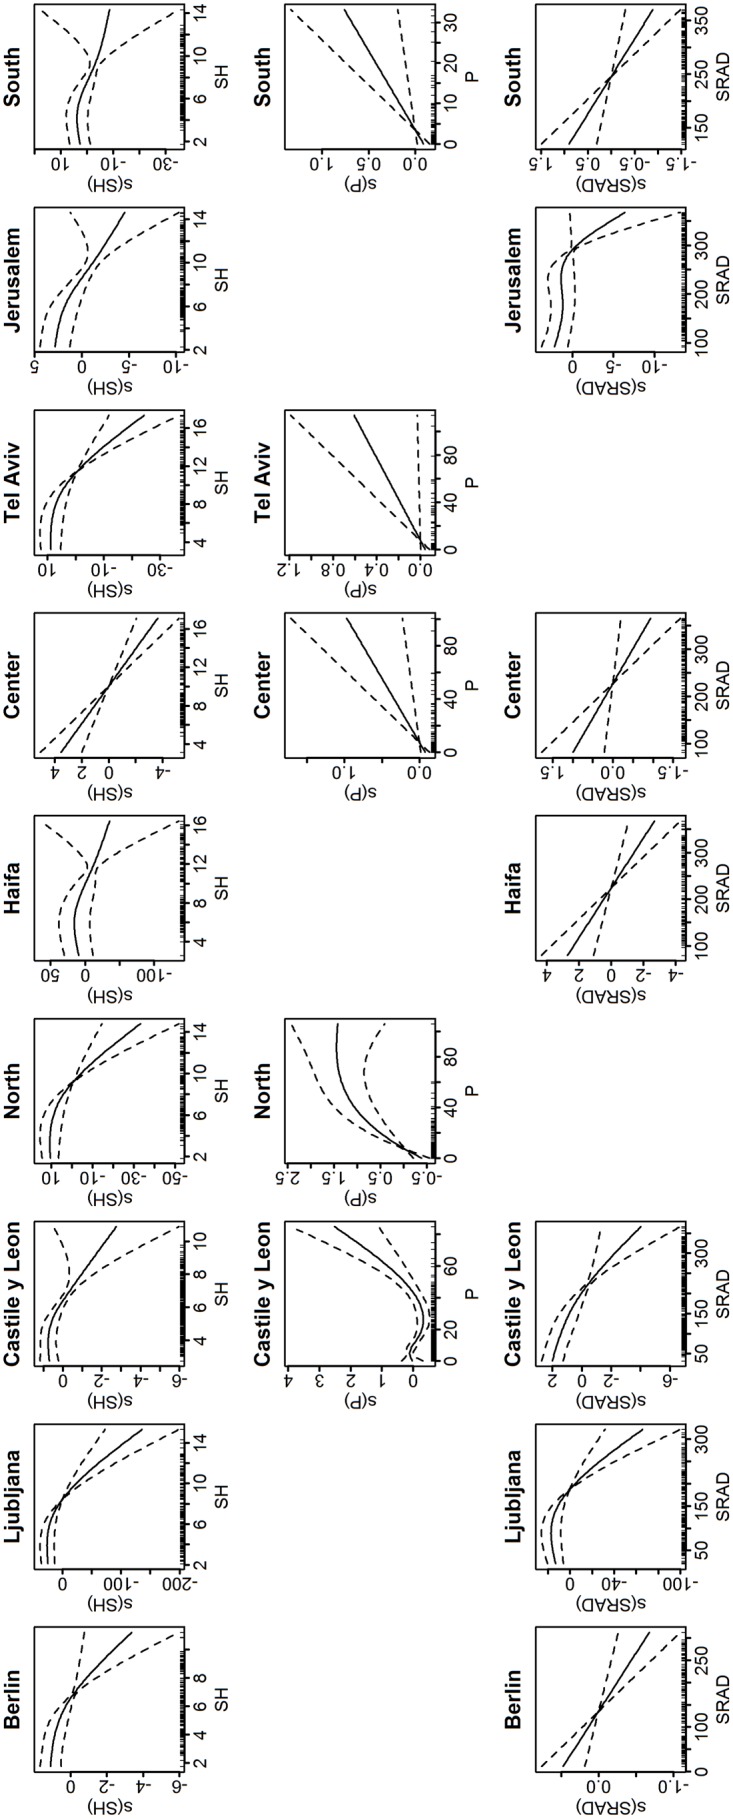
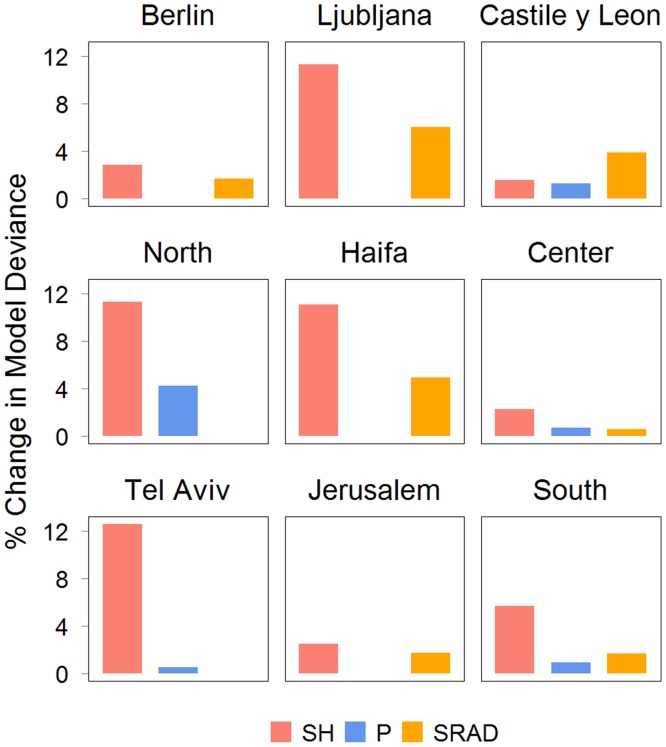
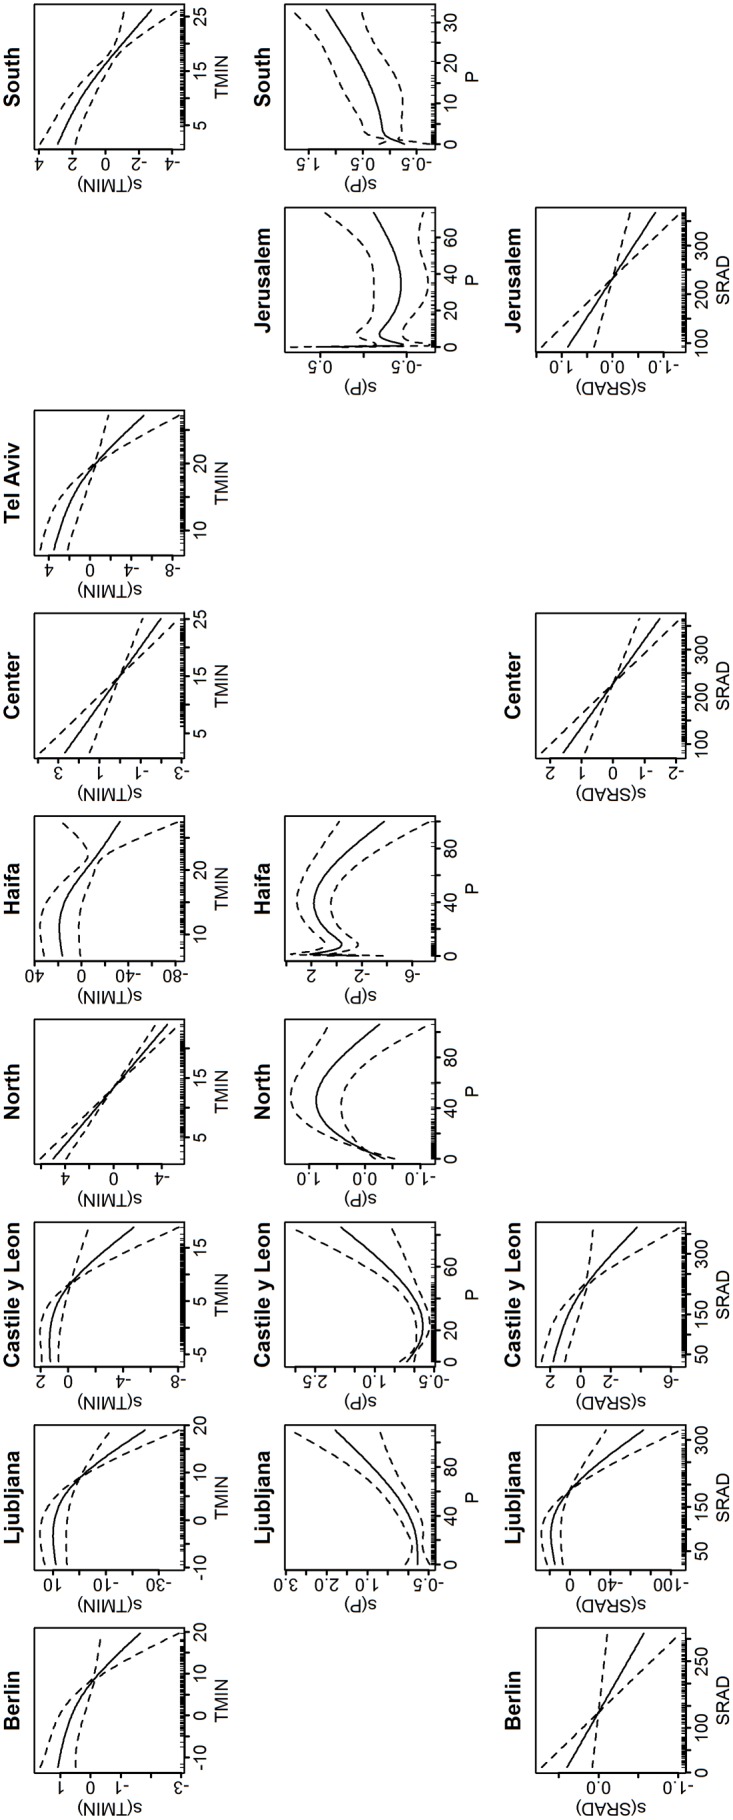
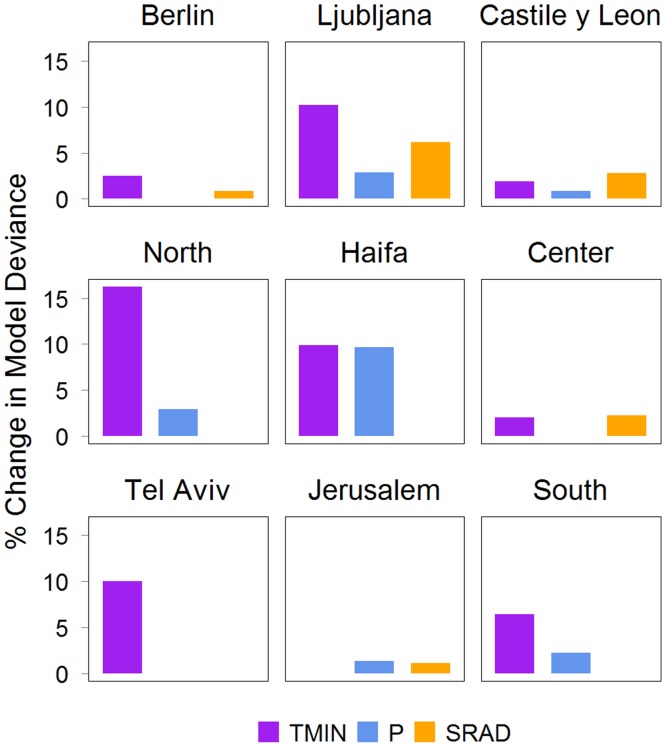
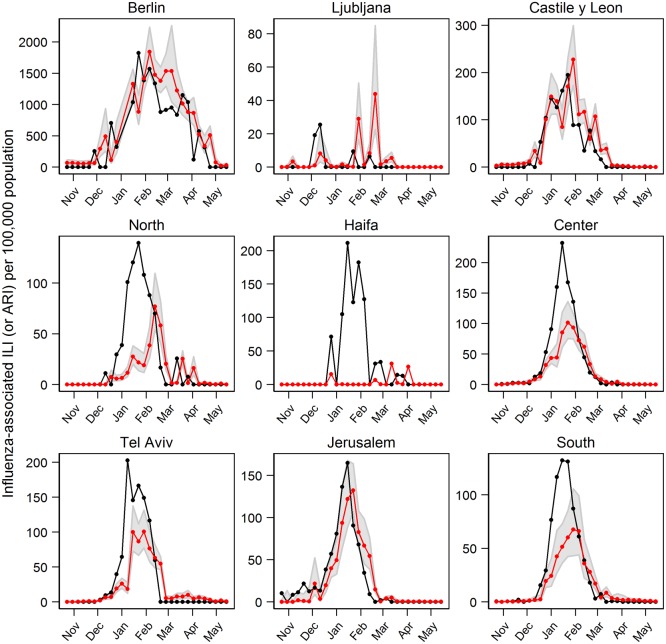
Methods: We estimated weekly influenza-associated influenza-like-illness (ILI) or Acute Respiratory Infection (ARI) incidence to represent influenza activity using data from each country's sentinel surveillance during 2000-2011 (Spain) and 2006-2011 (all others). Meteorological data was obtained from ground stations, satellite and assimilated data. Two generalized additive models (GAM) were developed, with one using specific humidity as a covariate and another using minimum temperature. Precipitation and solar radiation were included as additional covariates in both models. The models were adjusted for previous weeks' influenza activity, and were trained separately for each study location.
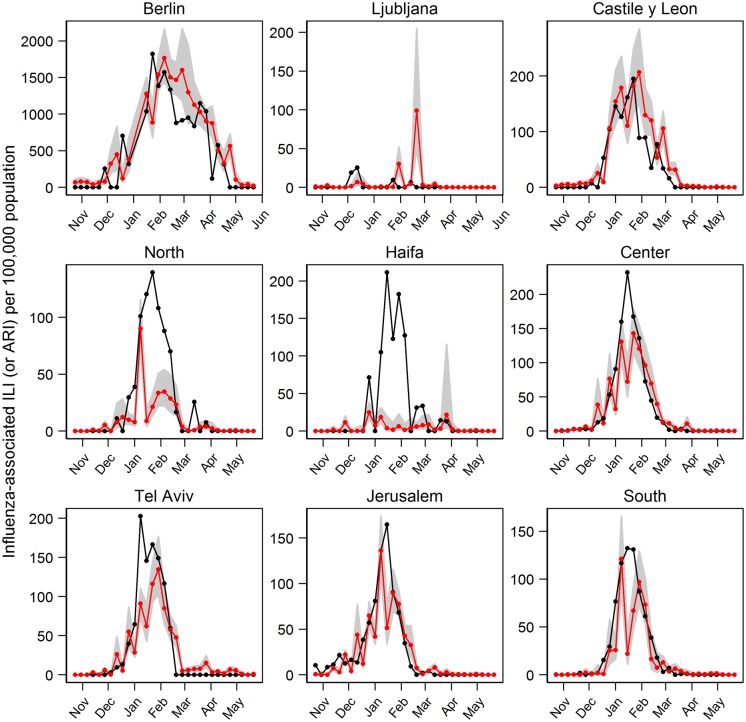
Results: Influenza activity was inversely associated (p<0.05) with specific humidity in all locations. Minimum temperature was inversely associated with influenza in all 3 temperate locations, but not in all subtropical locations. Inverse associations between influenza and solar radiation were found in most locations. Associations with precipitation were location-dependent and inconclusive. We used the models to estimate influenza activity a week ahead for the 2010/2011 period which was not used in training the models. With exception of Ljubljana and Israel's Haifa District, the models could closely follow the observed data especially during the start and the end of epidemic period. In these locations, correlation coefficients between the observed and estimated ranged between 0.55 to 0.91and the model-estimated influenza peaks were within 3 weeks from the observations.
Conclusion: Our study demonstrated the significant link between specific humidity and influenza activity across temperate and subtropical climates, and that inclusion of meteorological parameters in the surveillance system may further our understanding of influenza transmission patterns.
Conflict of interest statement
Figures
References
-
- WHO (2009) Influenza (Seasonal)—Fact Sheet No 211. Available: http://www.who.int/mediacentre/factsheets/fs211/en/.
-
- ECDC (2013) Factsheet for health professionals. Available: http://ecdc.europa.eu/en/healthtopics/seasonal_influenza/basic_facts/pag....
-
- WHO Global Influenza Surveillance Network (2011) Manual for the laboratory diagnosis and virological surveillance of influenza. Available: http://whqlibdoc.who.int/publications/2011/9789241548090_eng.pdf.
-
- Hampson AW (1999) Epidemiological data on influenza in Asian countries. Vaccine 17: 19–23. - PubMed
Publication types
MeSH terms
Grants and funding
LinkOut - more resources
Full Text Sources
Other Literature Sources
Medical
