Review
. 2015 Aug 25:4:38.
doi: 10.1186/s13742-015-0077-2. eCollection 2015.

Visualizing genome and systems biology: technologies, tools, implementation techniques and trends, past, present and future

Affiliations
Review

Visualizing genome and systems biology: technologies, tools, implementation techniques and trends, past, present and future

Georgios A Pavlopoulos et al. Gigascience. .

Abstract

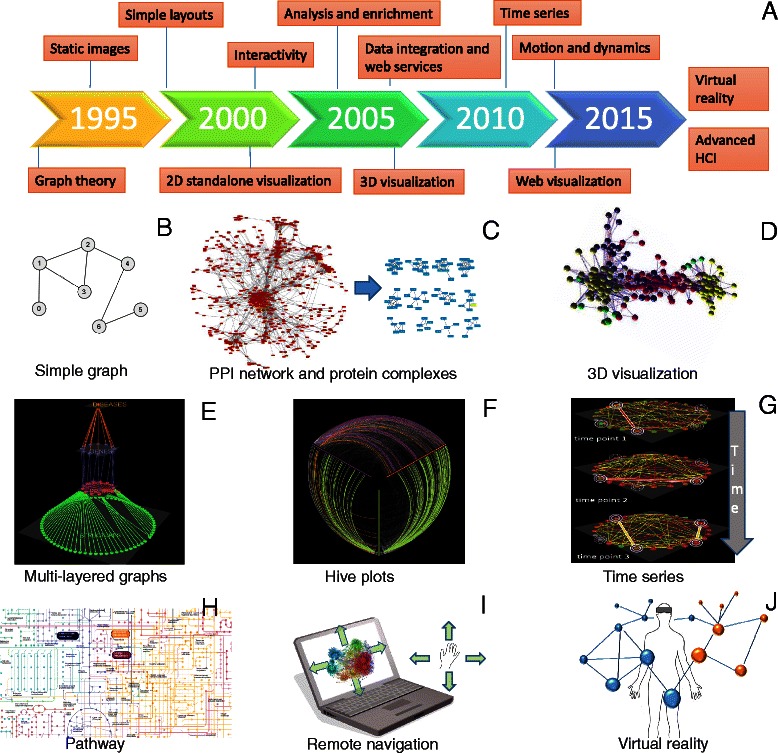
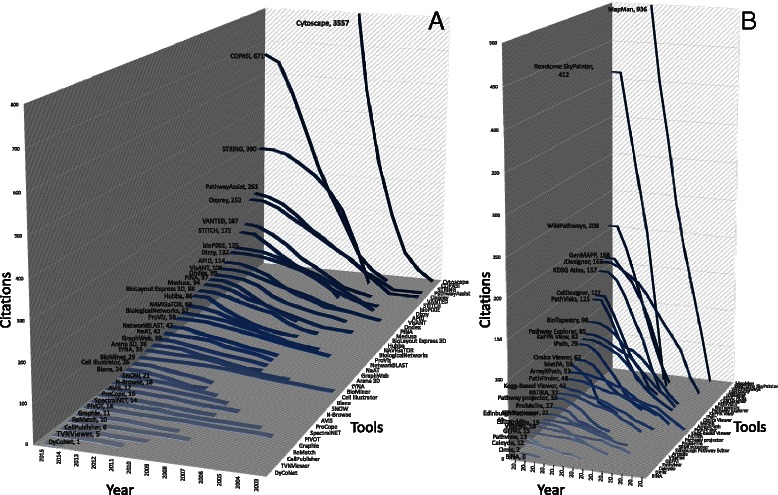
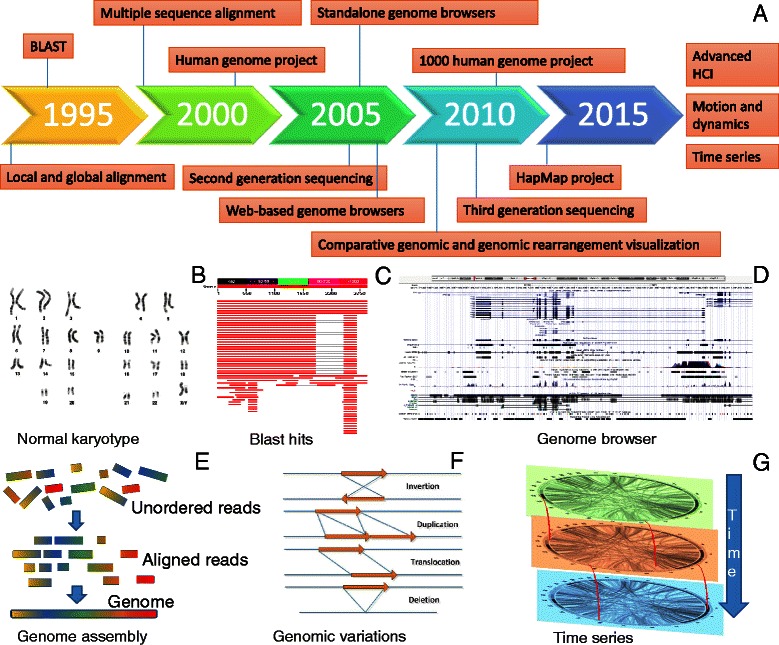
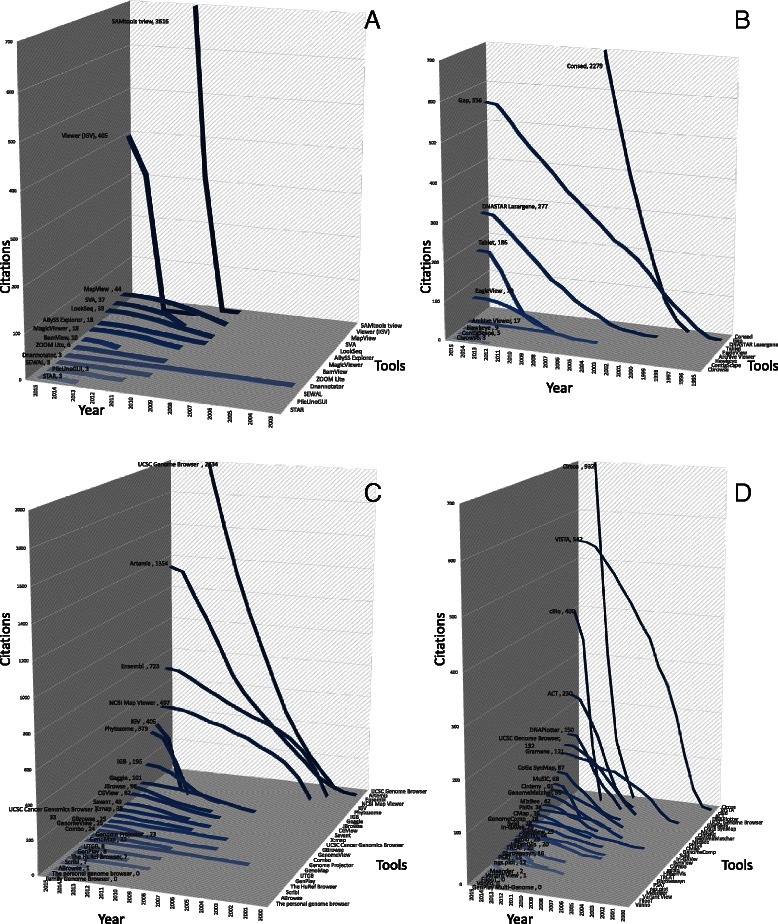
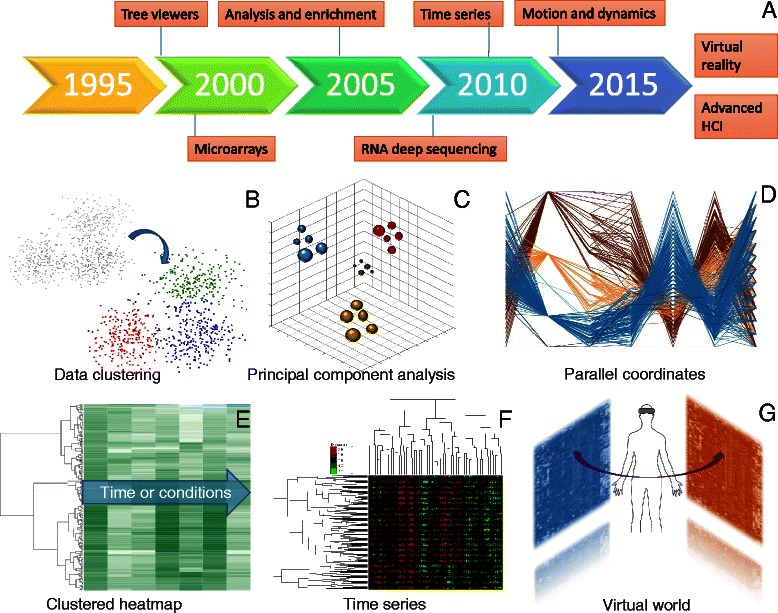
"Α picture is worth a thousand words." This widely used adage sums up in a few words the notion that a successful visual representation of a concept should enable easy and rapid absorption of large amounts of information. Although, in general, the notion of capturing complex ideas using images is very appealing, would 1000 words be enough to describe the unknown in a research field such as the life sciences? Life sciences is one of the biggest generators of enormous datasets, mainly as a result of recent and rapid technological advances; their complexity can make these datasets incomprehensible without effective visualization methods. Here we discuss the past, present and future of genomic and systems biology visualization. We briefly comment on many visualization and analysis tools and the purposes that they serve. We focus on the latest libraries and programming languages that enable more effective, efficient and faster approaches for visualizing biological concepts, and also comment on the future human-computer interaction trends that would enable for enhancing visualization further.

Keywords: Biological data visualization; Genomics; Multivariate analysis; Network biology; Systems biology.


Figures

Fig. 1
Fig. 1
Visualization for network biology. a Timeline of the emergence of relevant technologies and concepts. b A simple drawing of an undirected unweighted graph. c A 2D representation of a yeast protein-protein interaction network visualized in Cytoscape (left) and potential protein complexes identified by the MCL algorithm from that network (right). d A 3D view of a protein-protein interaction network visualized by BiolayoutExpress3D. e A multilayered network integrating different types of data visualized by Arena3D. f A hive plot view of a network in which nodes are mapped to and positioned on radially distributed linear axes. g Visualization of network changes over time. h Part of lung cancer pathway visualized by iPath. i Remote navigation and control of networks by hand gestures. j Integration and control of 3D networks using VR devices
Fig. 2
Fig. 2
Citation trends and key player tools in network biology. a Citations of network visualization tools based on Scopus. b Citations of pathway visualization tools based on Scopus. The numbers of citations of each tool in 2015 are shown after its name
Fig. 3
Fig. 3
Visualization for genome biology. a Timeline of the emergence of relevant technologies and concepts. b A typical normal human karyotype. c Visualization of BLAST hits and alignment of orthologous genes for the human TP53 gene. d The human TP53 gene and its annotations visualized by the UCSC genome browser. e Visualization of a de novo genome assembly from its DNA fragments. f Examples of balanced and unbalanced genomic rearrangements. g Hypothetical visualization of genomic structural variations across time
Fig. 4
Fig. 4
Citation trends and key players in genome biology. a Citations of genome alignment visualization tools based on Scopus. b Citations of genome assembly visualization tools based on Scopus. c Citations of genome browsers based on Scopus. d Citations of comparative genomics visualization tools based on Scopus. The numbers of citations of each tool in 2015 are shown after its name
Fig. 5
Fig. 5
Multivariate analyses and visualization. a Timeline of the emergence of relevant technologies and concepts. b Visualization of k-means partitional clustering algorithm. c 3D visualization of a principal component analysis. d Visualization of gene-expression measures across time using parallel coordinates. e Visualization of gene-expression clustering across time. f 2D hierarchical clustering to visualize gene expressions against several time points or conditions. g Hypothetical integration of analyses and expression heatmaps and the control of objects by VR devices
Fig. 6
Fig. 6
Citation trends and tools for gene-expression analysis. a Citations of microarray/RNAseq visualization tools based on Scopus. b Citations of tree viewers based on Scopus. The numbers of citations of each tool in 2015 are shown after its name

References

    1. Howe D, Costanzo M, Fey P, Gojobori T, Hannick L, Hide W, et al. Big data: the future of biocuration. Nature. 2008;455:47–50. doi: 10.1038/455047a. - DOI - PMC - PubMed
    1. Liolios K, Mavromatis K, Tavernarakis N, Kyrpides NC. The Genomes On Line Database (GOLD) in 2007: status of genomic and metagenomic projects and their associated metadata. Nucleic Acids Res. 2008;36:D475–9. doi: 10.1093/nar/gkm884. - DOI - PMC - PubMed
    1. Census of Marine Life. How many species on Earth? About 8.7 million, new estimate says. ScienceDaily. 24 August 2011. http://www.sciencedaily.com/releases/2011/08/110823180459.htm. Accessed 27 July 2015.
    1. May M. Life Science Technologies: Big biological impacts from big data. Science. 2014; doi:10.1126/science.opms.p1400086.
    1. Reddy TB, Thomas AD, Stamatis D, Bertsch J, Isbandi M, Jansson J, et al. The Genomes OnLine Database (GOLD) v. 5: a metadata management system based on a four level (meta)genome project classification. Nucleic Acids Res. 2015;43:D1099–1106. doi: 10.1093/nar/gku950. - DOI - PMC - PubMed

Publication types