. 2015 Jul 6;6(8):2738-54.
doi: 10.1364/BOE.6.002738. eCollection 2015 Aug 1.

OCT angiography by absolute intensity difference applied to normal and diseased human retinas

Affiliations

OCT angiography by absolute intensity difference applied to normal and diseased human retinas

Daniel Ruminski et al. Biomed Opt Express. .

Abstract

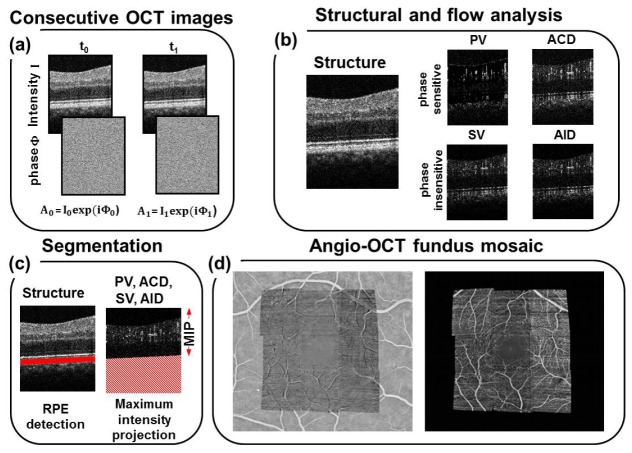
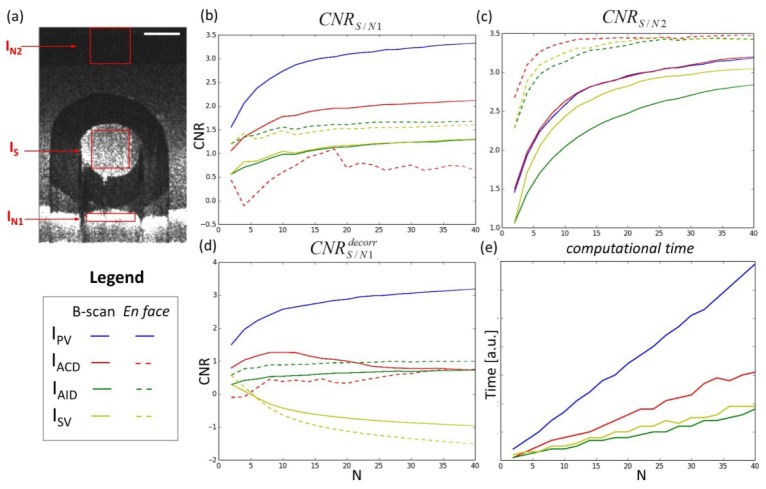
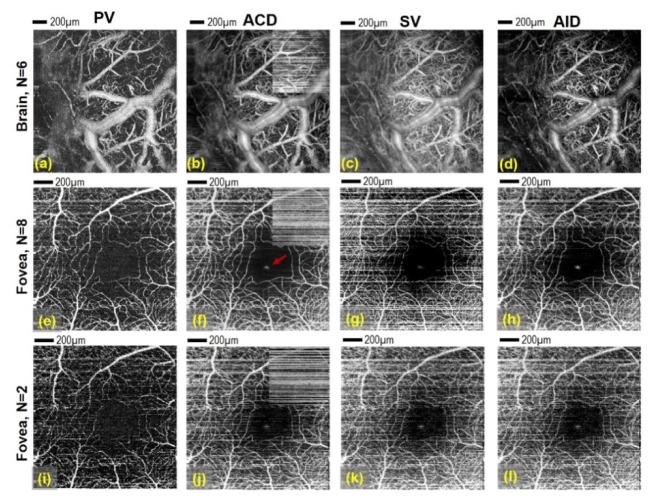
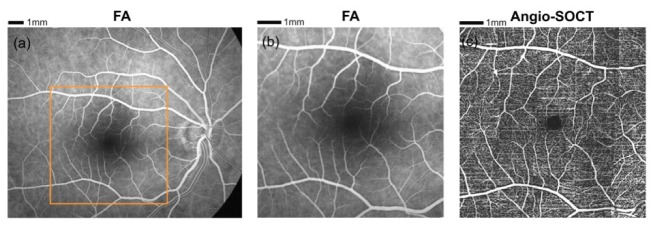
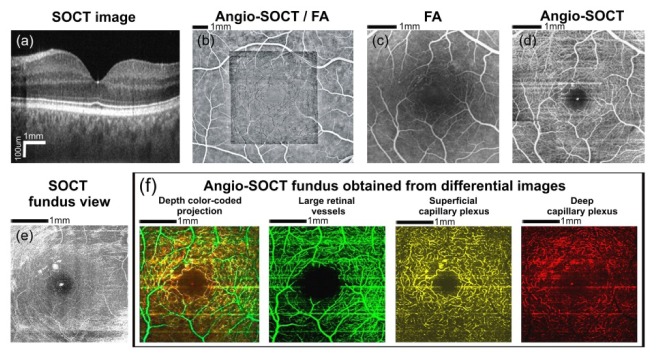
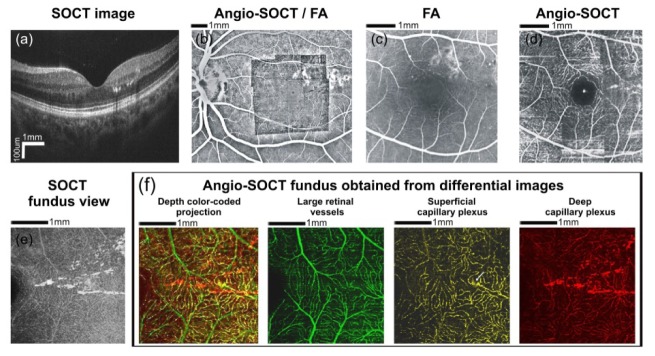
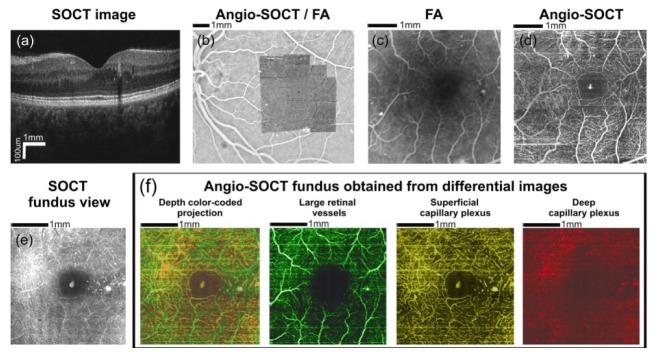
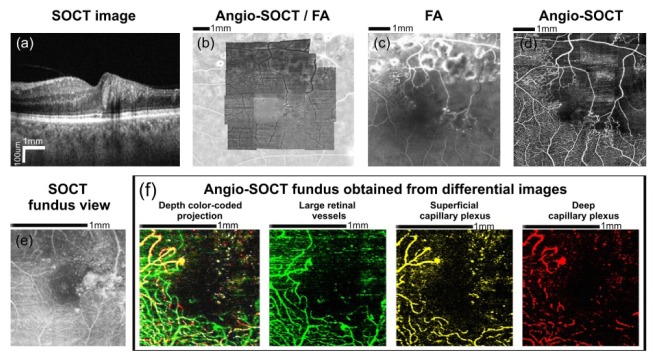
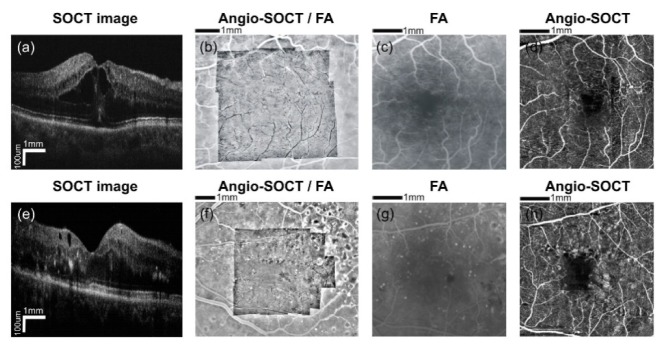
We compare four optical coherence tomography techniques for noninvasive visualization of microcapillary network in the human retina and murine cortex. We perform phantom studies to investigate contrast-to-noise ratio for angiographic images obtained with each of the algorithm. We show that the computationally simplest absolute intensity difference angiographic OCT algorithm that bases only on two cross-sectional intensity images may be successfully used in clinical study of healthy eyes and eyes with diabetic maculopathy and branch retinal vein occlusion.

Keywords: (110.4500) Optical coherence tomography; (170.3880) Medical and biological imaging; (170.4470) Ophthalmology; (280.2490) Flow diagnostics.


Figures

Fig. 1
Fig. 1
The 2D OCT image processing procedure for visualizing retinal microcapillary network (protocol B). (a)Set of 2 oversampled OCT cross-sectional images measured at the same retinal location. (b) Structural and angiographic cross-sectional images (PV - phase variance, ACD - absolute complex difference, SV- speckle variance, AID - absolute intensity difference. (c) A scheme of custom-designed automatic retinal layer segmentation algorithm. (d) Enface view of the retinal vasculature acquired using the maximum intensity projections MIP of all differential images from nine 3D OCT data sets. Picture on the left: Angio-OCT mosaic projected onto the FA image.
Fig. 2
Fig. 2
Comparison of contrast to noise ratio CNR for different OCT angiography algorithms. (a) Exemplary intensity B-scan image. Red rectangles indicate regions of interest to CNR calculation: flow area (IS), hyper-reflective static structure (IN1) and noise background (IN2). Scale bar: 100 µm. (b) CNR calculated from IS and IN1 versus number of oversampled B-scans. (c) CNR calculated from IS and IN2. (d) CNR calculated between IS and IN1 in the case of object motion (additionally decorrelated B-scans). (e) Computational time of given algorithm versus number of oversampled B-scans. Dashed lines correspond to enface projection display mode - CNR calculated based on averaging in z direction. IPV - phase variance (blue solid line), IACD - absolute complex difference with and without axial phase compensation (red solid/dashed line), ISV -speckle variance (yellow solid/dashed line), absolute intensity difference IAID (green solid/dashed line).
Fig. 3
Fig. 3
Presentation of angio-OCT maps obtained from two data sets (I – mouse brain (a-d) measured with protocol E and II - eye of healthy volunteer (e-l)) measured with protocol D processed in four different ways: PV – Phase variance angiograms (first column), ACD – Absolute Complex Difference angiograms (second column), SV – Speckle Variance angiograms (third column) and AID – Absolute Intensity Difference (fourth column). The last row presents the human retinal maps obtained for only two B-scans from the group of eight. Brain image size area: 2 mm x 2mm; human eye image size: 1.5 mm x 1.5 mm. Red arrow on (f) shows specular reflection artifact visible also on (g, h, j-l). Comparison between axial phase stabilization and no stabilization in ACD algorithm is visible on (b, f, j) - small insets placed in upper right corners of ACD angiograms show non-stabilized data. Scale bar: 200 µm.
Fig. 4
Fig. 4
(a) Fluorescein angiography showing the fundus of a healthy 38-year-old individual. (b) 7.5 x 7.5 mm region of FA corresponding to OCT measurement (c) Angio-OCT fundus view composed of 25-element mosaic (protocol B). The image was created by merging 12,000 B-scans, the total number of A-scans was 2,880,000. Angio-OCT imaging region - 7.5 x 7.5 mm.
Fig. 5
Fig. 5
Data obtained from a 46 year-old patient with diabetic retinopathy. Visual acuity in the right eye was 20/25. (a) OCT cross-sectional image (protocol C). (b) The automatically generated OCT mosaic projected onto the fluorescein angiography image (protocol B). (c) Fluorescein angiography. (d) Angio-OCT mosaic size - 4.5 x 4.5 mm. The tiny white area in the center corresponds to the foveal specular reflex. (e) OCT fundus view (protocol A). (f) Color-coded angio-OCT fundus views showing retinal vasculature at different levels (protocol A). Large retinal vessels were coded green, the superficial capillary plexus was coded yellow and the deep capillary plexus was coded red. It should be noted that the blood vessels of the superficial capillary plexus mark the edge of the foveal avascular zone. Angio-OCT imaging region- 4 x 4 mm.
Fig. 6
Fig. 6
Data obtained from a 37 year-old patient with diabetic retinopathy. Visual acuity in the left eye was 20/25. (a) OCT cross-sectional image (protocol C). Hard exudates are visible in the temporal macula. (b) The automatically generated angio-OCT mosaic projected onto the fluorescein angiography image (protocol B). (c) Fluorescein angiography showing few microaneurysms. The capillary network pattern above and temporally from the fovea is obscured by the hyperfluorescence of laser scars. Hard exudates are not visible in FA image. (d) AID angio-OCT mosaic of the fundus area shown in Fig. 6(c). Laser scars do not obscure retinal vasculature as angio-OCT scans do not include RPE-generated signal. Few microaneurysms and several hard exudates are visible within temporal macula. The white punctate spot in the center corresponds to foveal reflex. Angio-OCT imaging region - 4.5 x 4.5 mm. (e) OCT fundus view of temporal macula with the hard exudates (protocol A).(f) Color-coded angio-OCT fundus views showing retinal vasculature at different levels (layers) within the temporal macula (protocol A). Large retinal vessels were coded green, the superficial capillary plexus was coded yellow and the deep capillary plexus was coded red. It is clearly visible that most hard exudates are located within the deep capillary plexus. Superficial capillary plexus is the source of hard exudates at a single site only (arrow). Angio-OCT imaging region - 3.1 x 3.1 mm.
Fig. 7
Fig. 7
Data obtained from a 53 year-old patient with diabetic retinopathy. Visual acuity in the left eye was 20/32. (a) OCT cross-sectional image (protocol C). Hard exudates are visible in the temporal macula. Adjacent to the exudates, a single intraretinal fluid space is shown. (b) The automatically generated angio-OCT mosaic projected onto the fluorescein angiography image (protocol B). (c) A fluorescein angiography showing a few micro aneurysms. Hard exudates are not visible. (d) Angio-OCT mosaic of the fundus area shown in Fig. 7(c). Single hard exudates are visible within the temporal macula. The white area in the center corresponds to foveal reflex. Angio-OCT imaging region - 4.5 x 4.5 mm. (e) OCT fundus view revealing the hard exudates (protocol A).(f) Color-coded angio-OCT fundus views showing macular vasculature at different levels (layers) (protocol A). Large retinal vessels were coded green, the superficial capillary plexus was coded yellow and the deep capillary plexus was coded red. Tiny hard exudates seen within temporal and superior macula are located in the deep capilary plexus layer. Furthermore, there is another hard exudates deposit within temporal macula, located in the superficial capillary plexus layer. It should be noted that the blood vessels of the superficial capillary plexus mark the edge of the foveal avascular zone. Angio-OCT imaging region - 3.1 x 3.1 mm.
Fig. 8
Fig. 8
Data obtained from a 55 year-old patient with branch retinal vein occlusion. Visual acuity in the left eye was 20/100. (a) OCT cross-sectional image shows the decreased retinal thickness within the temporal macula (protocol C). (b) The automatically generated angio-OCT mosaic projected onto the fluorescein angiography image (protocol B). (c) Fluorescein angiography image (d) Angio-OCT mosaic of the fundus area shown in Fig. 8(c). An extensive non-perfusion area is clearly visible. Angio-OCT imaging region - 6 x 6 mm. (e) OCT fundus view showing changes of retinal reflectivity (protocol A). (f) Color-coded angio-OCT fundus views showing retinal vasculature at different levels (layers) within the temporal macula (protocol B). Large retinal vessels were coded green, the superficial capillary plexus was coded yellow and the deep capillary plexus was coded red. It is possible to follow the three-dimensional pattern of the retinal capillary network. Angio-OCT imaging region - 1.5 x 1.5 mm.
Fig. 9
Fig. 9
Diabetic macular edema. The images in the upper row show the 69 year-old patient. Visual acuity in the left eye was 20/63. The images in the bottom row show the 40 year-old patient. Visual acuity in the left eye was 20/80. (a) OCT cross-sectional image showing the intraretinal fluid spaces within the macula (protocol C). (b) The automatically generated angio-OCT mosaic projected onto the fluorescein angiography image (protocol B). (c) The fluorescein angiography presents the enlargement of the foveal avascular zone. Angio-OCT imaging region - 4.5 x 4.5 mm. (d) The angio-OCT mosaic shows the fundus area as seen in Fig. 9(c). The foveal avascular zone is visibly enlarged. (e) OCT cross-sectional image showing a few intraretinal fluid spaces, located in the inner retinal layers within the macula (protocol C). (f) The automatically generated angio-OCT mosaic projected onto the fluorescein angiography image (protocol B). (g) The fluorescein angiography presents the enlargement of the foveal avascular zone and the non-perfusion areas. (h) The angio-OCT mosaic shows the fundus area as seen in Fig. 8(g). The foveal avascular zone is visibly enlarged. Adjacent to the avascular zone, the non-perfusion areas are shown. Angio-OCT imaging region - 4.5 x 4.5 mm.

References

    1. Wang R. K., Jacques S. L., Ma Z., Hurst S., Hanson S. R., Gruber A., “Three dimensional optical angiography,” Opt. Express 15(7), 4083–4097 (2007). 10.1364/OE.15.004083 - DOI - PubMed
    1. Wang R. K., An L., “Doppler optical micro-angiography for volumetric imaging of vascular perfusion in vivo,” Opt. Express 17(11), 8926–8940 (2009). 10.1364/OE.17.008926 - DOI - PMC - PubMed
    1. Vakoc B. J., Lanning R. M., Tyrrell J. A., Padera T. P., Bartlett L. A., Stylianopoulos T., Munn L. L., Tearney G. J., Fukumura D., Jain R. K., Bouma B. E., “Three-dimensional microscopy of the tumor microenvironment in vivo using optical frequency domain imaging,” Nat. Med. 15(10), 1219–1223 (2009). 10.1038/nm.1971 - DOI - PMC - PubMed
    1. Mariampillai A., Leung M. K., Jarvi M., Standish B. A., Lee K., Wilson B. C., Vitkin A., Yang V. X., “Optimized speckle variance OCT imaging of microvasculature,” Opt. Lett. 35(8), 1257–1259 (2010). 10.1364/OL.35.001257 - DOI - PubMed
    1. Srinivasan V. J., Jiang J. Y., Yaseen M. A., Radhakrishnan H., Wu W., Barry S., Cable A. E., Boas D. A., “Rapid volumetric angiography of cortical microvasculature with optical coherence tomography,” Opt. Lett. 35(1), 43–45 (2010). 10.1364/OL.35.000043 - DOI - PMC - PubMed

LinkOut - more resources