. 2015 Nov 5;26(22):4075-86.
doi: 10.1091/mbc.E15-07-0461. Epub 2015 Aug 26.

Structural organization of nuclear lamins A, C, B1, and B2 revealed by superresolution microscopy

Affiliations

Structural organization of nuclear lamins A, C, B1, and B2 revealed by superresolution microscopy

Takeshi Shimi et al. Mol Biol Cell. .

Abstract

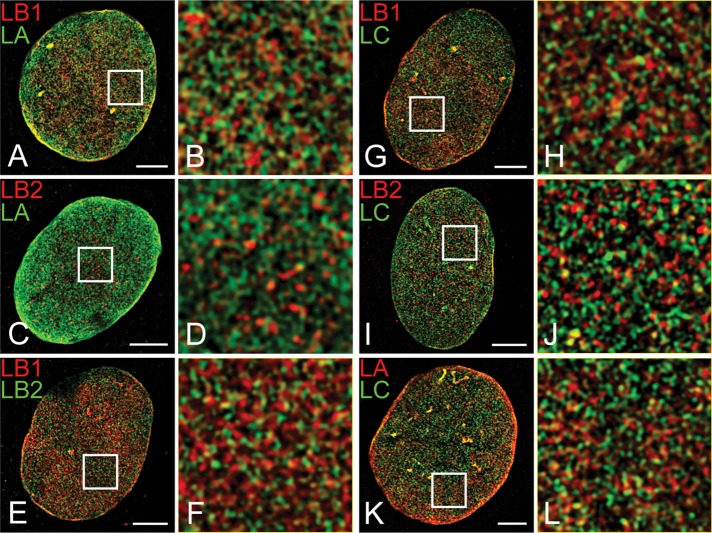
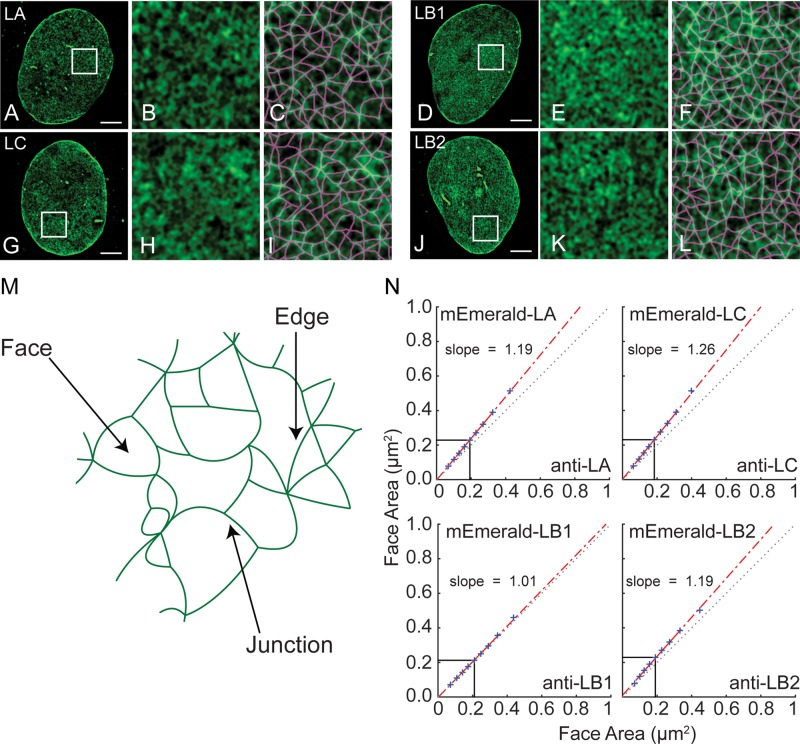
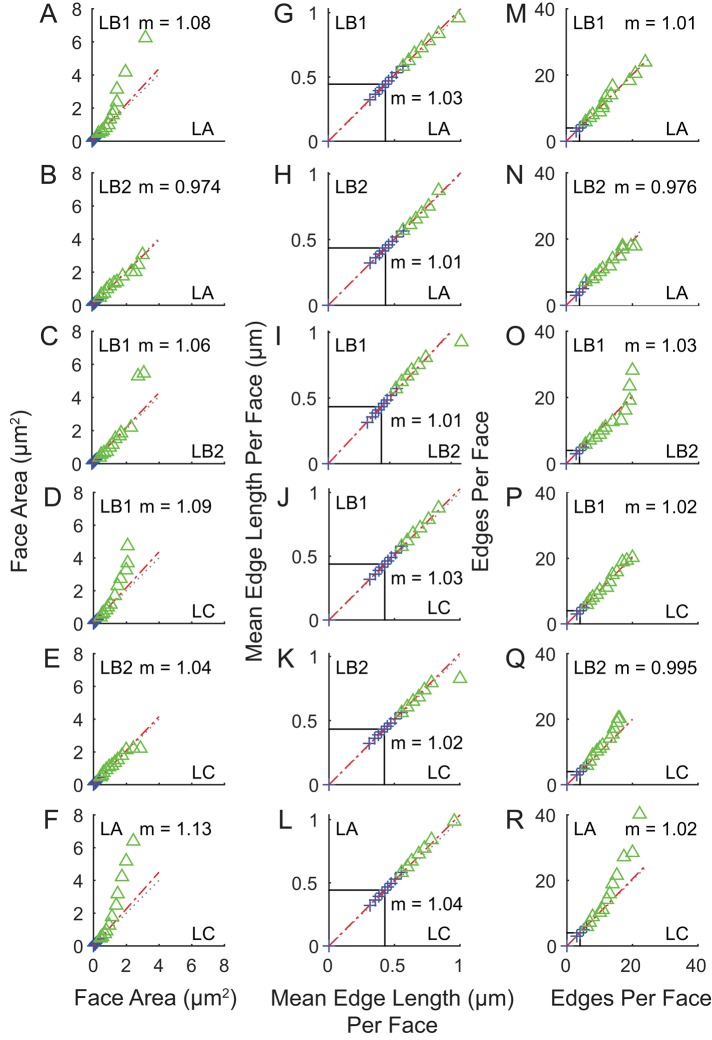
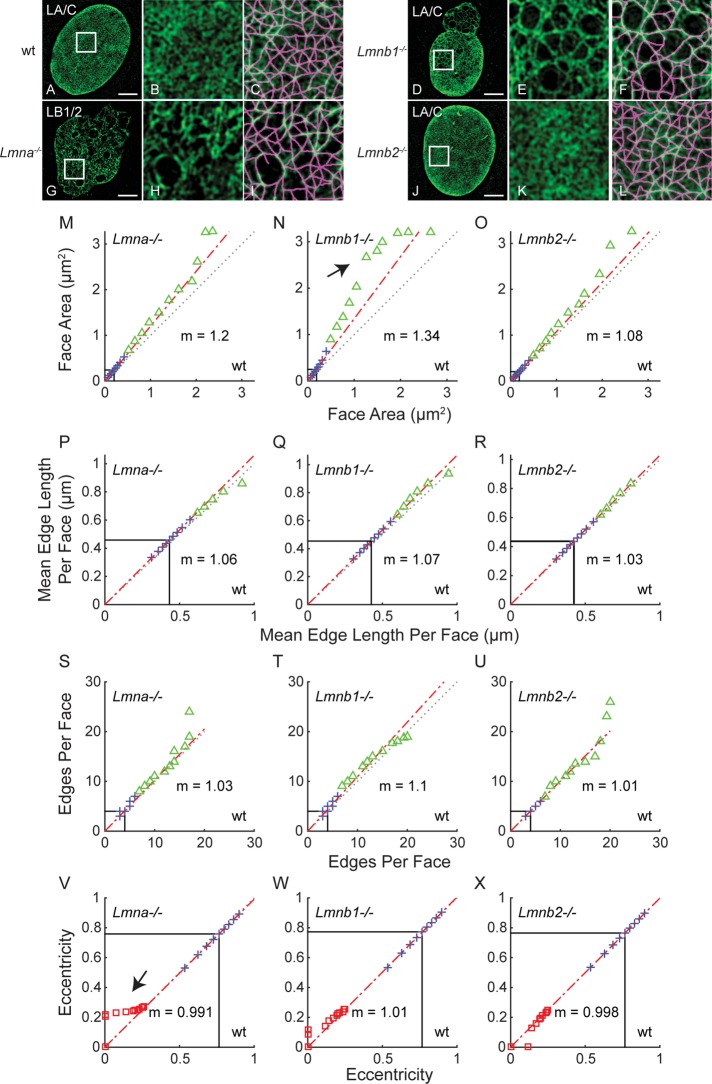
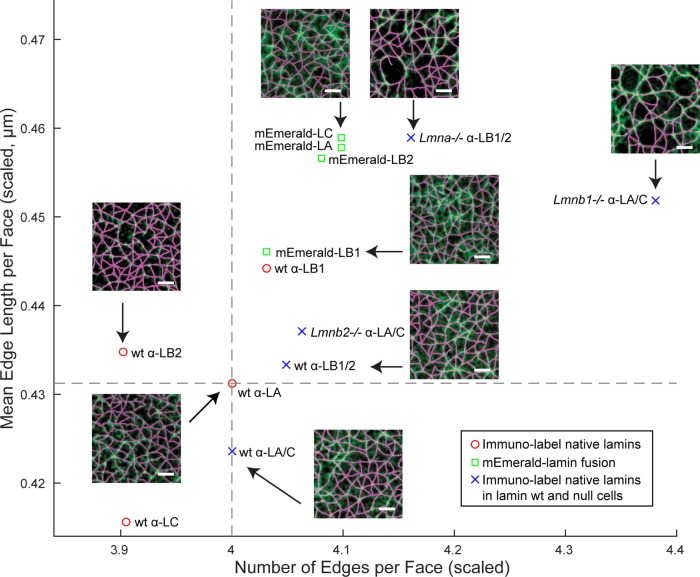
The nuclear lamina is a key structural element of the metazoan nucleus. However, the structural organization of the major proteins composing the lamina is poorly defined. Using three-dimensional structured illumination microscopy and computational image analysis, we characterized the supramolecular structures of lamin A, C, B1, and B2 in mouse embryo fibroblast nuclei. Each isoform forms a distinct fiber meshwork, with comparable physical characteristics with respect to mesh edge length, mesh face area and shape, and edge connectivity to form faces. Some differences were found in face areas among isoforms due to variation in the edge lengths and number of edges per face, suggesting that each meshwork has somewhat unique assembly characteristics. In fibroblasts null for the expression of either lamins A/C or lamin B1, the remaining lamin meshworks are altered compared with the lamin meshworks in wild-type nuclei or nuclei lacking lamin B2. Nuclei lacking LA/C exhibit slightly enlarged meshwork faces and some shape changes, whereas LB1-deficient nuclei exhibit primarily a substantial increase in face area. These studies demonstrate that individual lamin isoforms assemble into complex networks within the nuclear lamina and that A- and B-type lamins have distinct roles in maintaining the organization of the nuclear lamina.


Figures

FIGURE 1:
FIGURE 1:
Colocalization of lamin isoforms in MEFs using indirect immunofluorescence and 3D-SIM. Specific antibodies for pairs of lamin isoforms in all combinations. (A, B) LB1/LA, (C, D) LB2/LA, (E, F) LB1/LB2, (G, H) LB1/LC, (I, J) LB2/LC, and (K, L) LA/LC. The areas indicated by white squares in A, C, E, G, I, and K are magnified approximately fivefold along each edge in B, D, F, H, J, and L, respectively. Scale bar, 5 μm.
FIGURE 2:
FIGURE 2:
mEmerald-lamin isoforms localized by 3D-SIM. mEmerald-tagged lamins were transiently expressed in immortalized MEFs, followed by fixation. (A) Emerald-LA, (D) Emerald-LB1, (G) Emerald-LC, and (J) Emerald-LB2. The areas indicated by white squares are enlarged approximately fivefold along each edge in B, E, H, and K. Detected meshworks from automated computer image analysis (C, F, I, L) are overlaid in magenta on the respective magnified region. (M) A lamin meshwork is illustrated depicting a junction, an edge, and a face. (N) Distributions of the areas of faces in square micrometers of the Emerald-lamin fusions on the y-axis vs. the corresponding distribution of face areas from the immunofluorescence on the x-axis in q-q plots. The blue x’s indicate the 10th through 90th matched percentiles in decade intervals. The 50th percentile, or median, is indicated by black lines. The red line is a linear regression from the 25th to the 75th percentile with slope as indicated. A dotted gray line indicates a line with slope of 1 and an intercept of 0. Scale bar, 5 μm.
FIGURE 3:
FIGURE 3:
Quantile-quantile plots comparing the distribution of meshwork parameters for all lamin isoforms detected by two-color immunofluorescence. (A–F) face areas of the lamin meshworks, (G–L) mean edge length per face, and (M–R) number of edges per face. The 50th percentile, or median, is indicated by black lines. A dotted gray line indicates a line with slope of 1 and an intercept of 0. The red line is a linear regression from the 25th to the 75 percentile with slope as indicated. The slope of the red line, m, is indicated. The blue crosses indicate the 10th–90th matched percentiles in decade intervals. Green triangles represent the 95th, 97.5th, 98.75th, 99.38th, 99.96th, 99.99th, and 100th matched percentiles to illustrate the behavior of the upper tail of the distribution.
FIGURE 4:
FIGURE 4:
Quantitative analyses of lamin meshworks in lamin-null MEFs. Examples of 3D-SIM images of lamin meshworks and automated image analysis from (A–C) wt, (D–F) Lmnb1/, (G–I) Lmna/, and (J–L) Lmnb/MEFs. LA/C in wt, Lmnb1/, and Lmnb2/MEFs and LB1/2 in Lmna/ MEFs were localized by immunofluorescence. Areas indicated by white squares in B, E, H, and K are enlarged approximately fivefold along each edge in C, F, I, and L, respectively, and meshworks detected by automated image analysis are shown in magenta to the right of the magnified images. Scale bar, 5 μm. Lmna/, Lmnb1/, and Lmnb2/ MEFs were compared with wt MEFs with regard to (M–O) face area, (P–R) mean edge length per face, (S–U) edges per face, and (V–X) face eccentricity distributions using q-q plots. The 50th percentile, or median, is indicated by black lines. The red line is a linear regression from the 25th to the 75th percentile with slope as indicated. A dotted gray line indicates a line with a slope of 1 and an intercept of 0. The blue x’s indicate the 10th through 90th matched percentiles in decade intervals. Green triangles represent the 95th, 97.5th, 98.75th, 99.38th, 99.96th, 99.99th, and 100th matched percentiles to illustrate the behavior of the upper tail of the distribution. Red squares indicate the 0th, 0.63th, 0.66th, 0.69th, 0.72th, 0.76th, 0.79th, 0.83th, 0.87th, 0.91th, and 0.96th percentiles to illustrate the lower 1st percentile tail of the eccentricity distribution. Black arrows indicate positive deviations from the red line, indicating a right shift in the (N) face area for Lmnb1/ MEFs and (V) eccentricity distributions for Lmna/ MEFs.
FIGURE 5:
FIGURE 5:
Summary of results. The mean edge length per face is plotted against the number of edges per face. The values are scaled according to the scaling factors in Table 1, which were computed from a linear regression of the 25th to the 75th percentiles for each distribution. The median values for LA were used as a reference as indicated by the gray dashed lines. Example images are included and correspond to points indicated by the black arrows. Red circles indicate data from indirect immunofluorescence of MEFs in Figure 1 and Supplemental Figure S1. Green squares indicate mEmerald-lamin isoforms in Figure 2. Blue x’s indicate indirect immunofluorescence of MEFs and lamin-null MEFs in Figure 4. Scale bars, 1 μm.

Similar articles

Cited by

References

    1. Aebi U, Cohn J, Buhle L, Gerace L. The nuclear lamina is a meshwork of intermediate-type filaments. Nature. 1986;323:560–564. - PubMed
    1. Ben-Harush K, Wiesel N, Frenkiel-Krispin D, Moeller D, Soreq E, Aebi U, Herrmann H, Gruenbaum Y, Medalia O. The supramolecular organization of the C. elegans nuclear lamin filament. J Mol Biol. 2009;386:1392–1402. - PubMed
    1. Biamonti G, Giacca M, Perini G, Contreas G, Zentilin L, Weighardt F, Guerra M, Della Valle G, Saccone S, Riva S, et al. The gene for a novel human lamin maps at a highly transcribed locus of chromosome 19 which replicates at the onset of S-phase. Mol Cell Biol. 1992;12:3499–3506. - PMC - PubMed
    1. Brachner A, Foisner R. Lamina-associated polypeptide (LAP)2alpha and other LEM proteins in cancer biology. Adv Exp Med Biol. 2014;773:143–163. - PMC - PubMed
    1. Bresenham JE. Algorithm for computer control of a digital plotter. IBM Syst J. 1965;4:25–30.

Publication types

Substances