. 2015 Nov 5;26(22):3966-84.
doi: 10.1091/mbc.E15-06-0358. Epub 2015 Aug 26.

Experimental testing of a new integrated model of the budding yeast Start transition

Affiliations

Experimental testing of a new integrated model of the budding yeast Start transition

Neil R Adames et al. Mol Biol Cell. .

Abstract

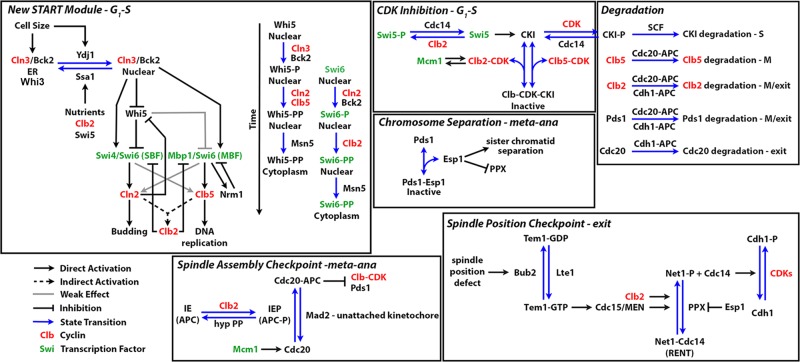
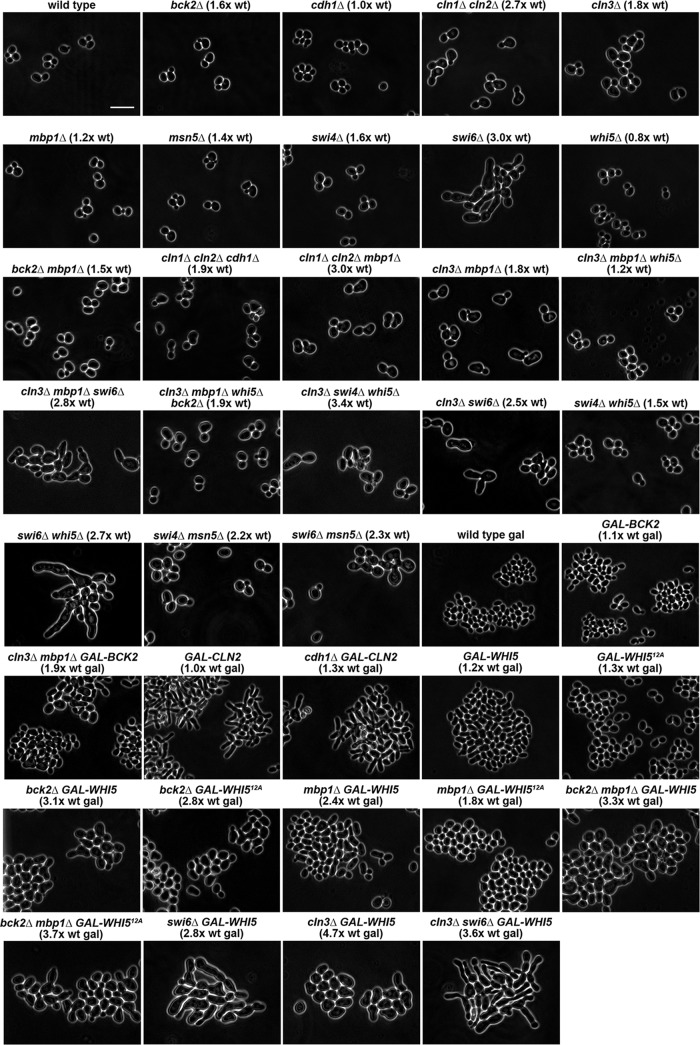
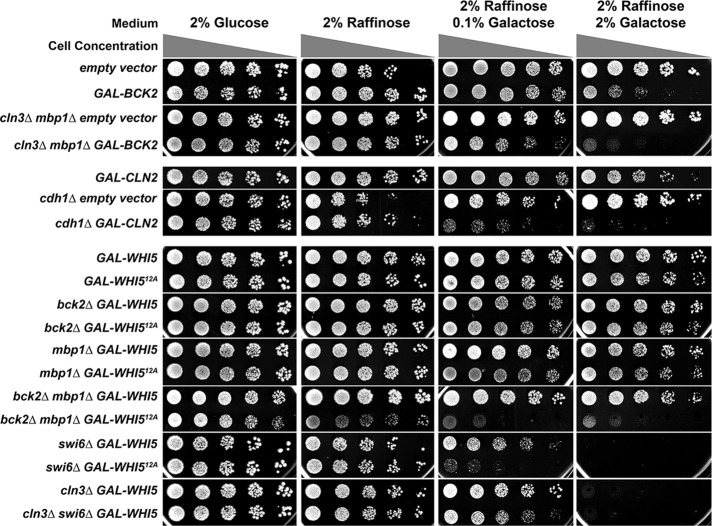
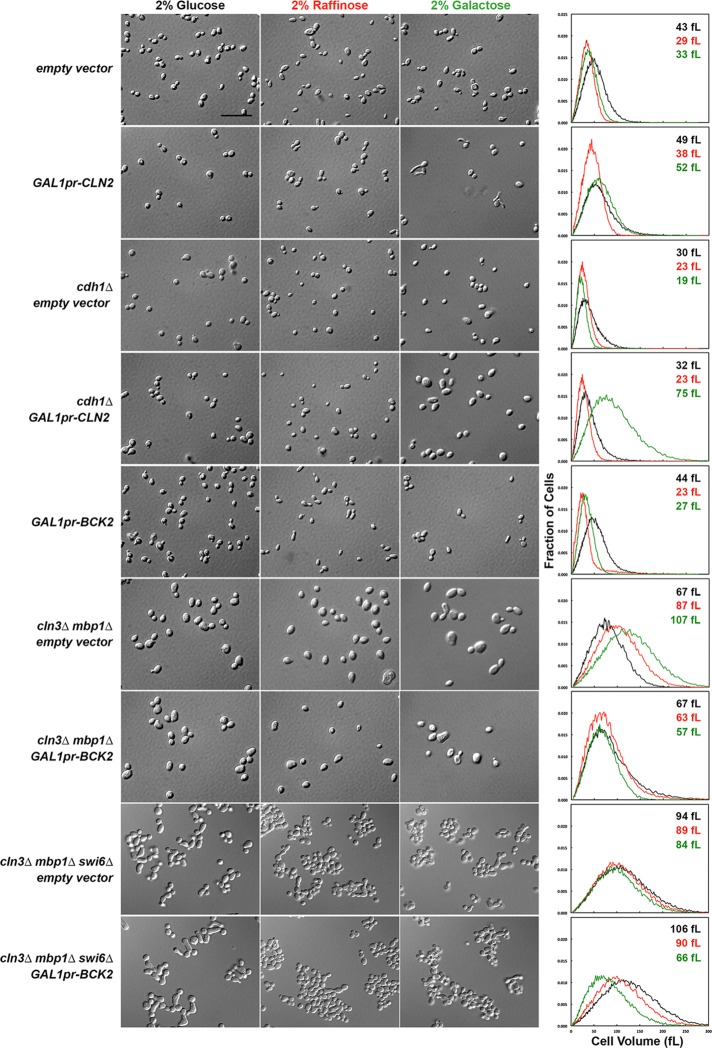
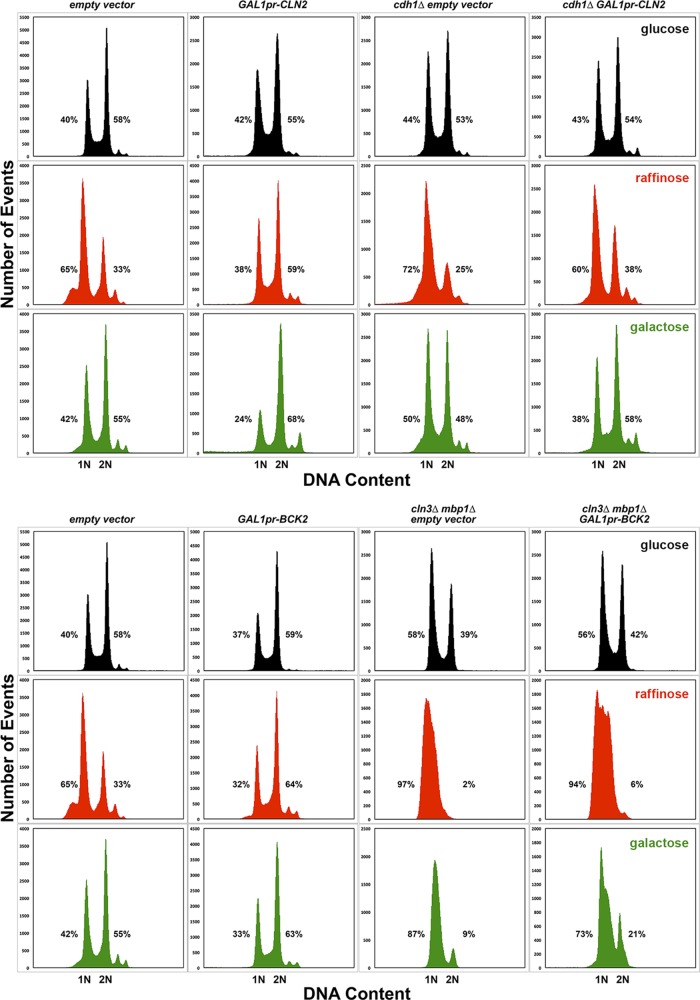
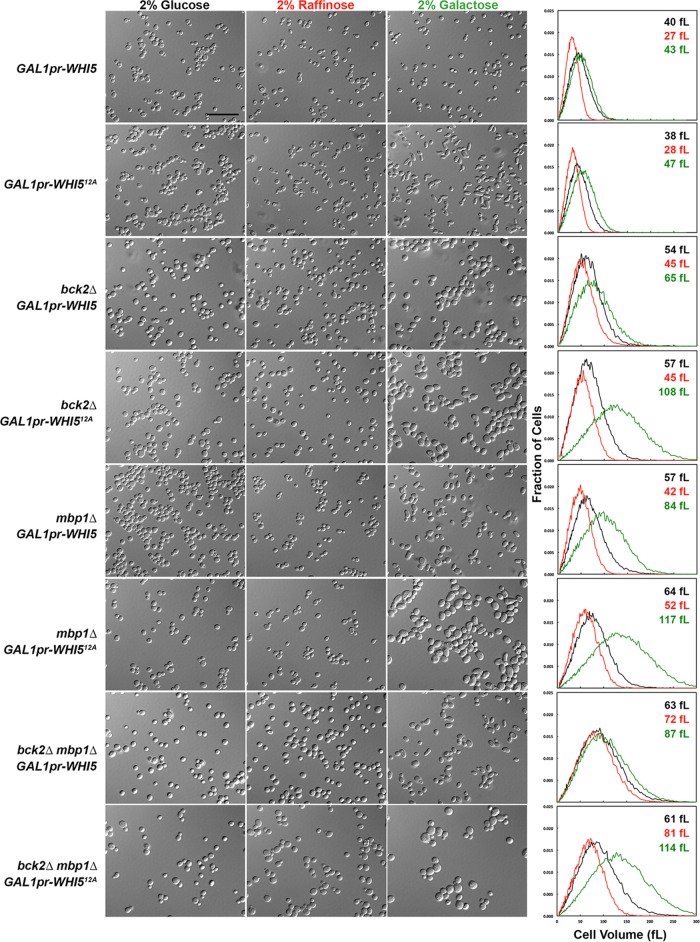
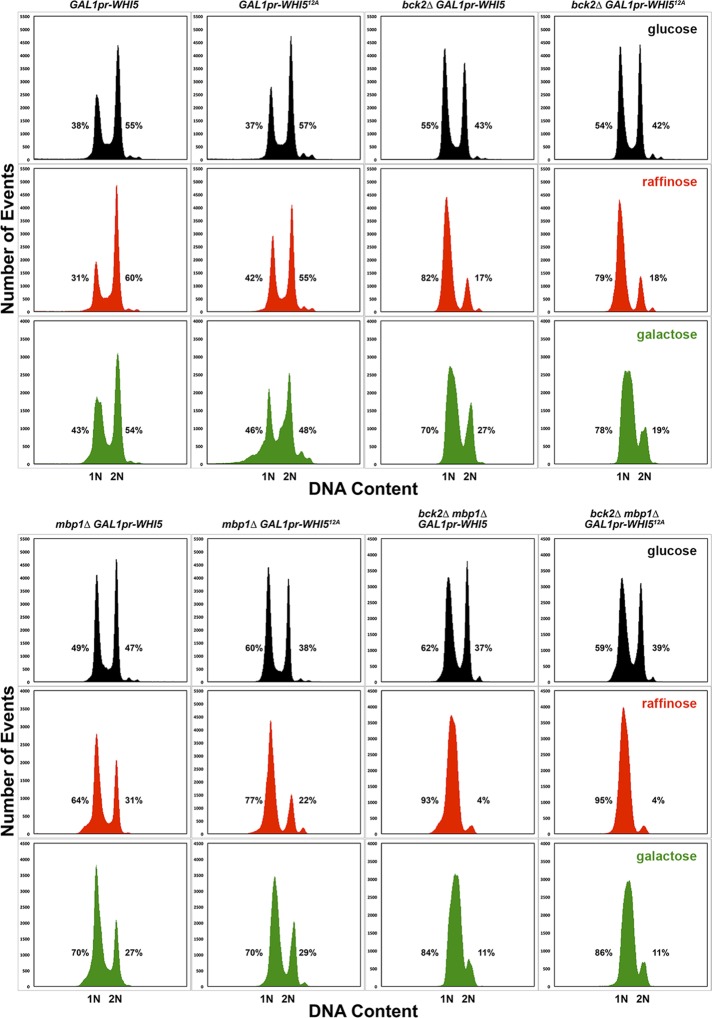
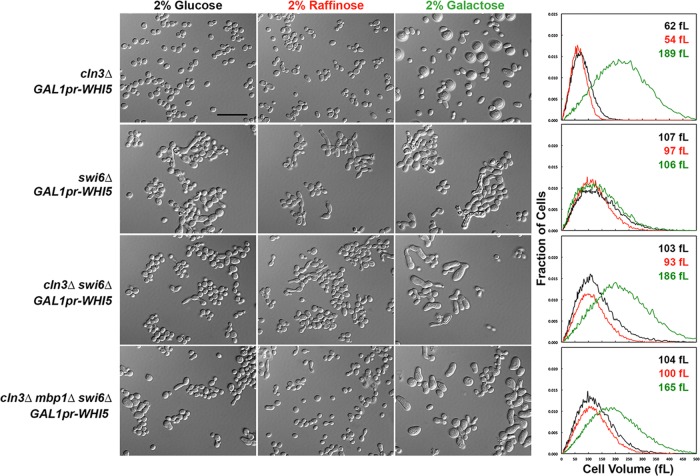
The cell cycle is composed of bistable molecular switches that govern the transitions between gap phases (G1 and G2) and the phases in which DNA is replicated (S) and partitioned between daughter cells (M). Many molecular details of the budding yeast G1-S transition (Start) have been elucidated in recent years, especially with regard to its switch-like behavior due to positive feedback mechanisms. These results led us to reevaluate and expand a previous mathematical model of the yeast cell cycle. The new model incorporates Whi3 inhibition of Cln3 activity, Whi5 inhibition of SBF and MBF transcription factors, and feedback inhibition of Whi5 by G1-S cyclins. We tested the accuracy of the model by simulating various mutants not described in the literature. We then constructed these novel mutant strains and compared their observed phenotypes to the model's simulations. The experimental results reported here led to further changes of the model, which will be fully described in a later article. Our study demonstrates the advantages of combining model design, simulation, and testing in a coordinated effort to better understand a complex biological network.


Figures

FIGURE 1:
FIGURE 1:
Wiring diagram of the START-2013 model. The model is based on START-2004 (Chen et al., 2004), with significant changes as outlined in the Results section. The Start module (top left) now has a mechanism for cell size control, Whi5 inhibition of SBF, positive feedback from G1–S cyclins to SBF, and MBF via inhibition of Whi5 and direct phosphorylation, and negative feedback from Nrm1 and Clb2. It also includes control of nucleocytoplasmic shuttling of Whi5 and Swi6. The remainder of the wiring diagram is largely the same as that of START-2004, except that now Pds1 expression is constitutive and PPX (a hypothetical protein phosphatase that is now known to be PP2A-Cdc55) is inhibited by Esp1 rather than directly by Pds1. IE, a hypothetical intermediary enzyme in START-2004, is likely a Clb2-CDK–dependent phosphorylated form of anaphase-promoting complex (APC). We propose that a hypothetical protein phosphatase (hyp PP) dephosphorylates APC to prevent its premature association.
FIGURE 2:
FIGURE 2:
Phase contrast images showing the cell sizes and morphology of wild-type and mutant strains listed in Tables 1, 2, and 3. The relevant strain genotype and size (volume) relative to the wild-type strain is indicated above each panel. The GAL1 promoter is abbreviated as GAL. Scale bar, 10 μm.
FIGURE 3:
FIGURE 3:
Growth assays for overexpression strains on glucose, raffinose, and galactose. Serial dilutions were spotted as described in Materials and Methods. The sugars contained in the plates are indicated at top. The 0.1% galactose plates were used to obtain lower levels of induction of the GAL1 promoter–driven gene. Gray triangles indicate relative concentrations of cells in the spots. The relevant genotypes of strains are indicated to the left. The GAL1 promoter is abbreviated as GAL.
FIGURE 4:
FIGURE 4:
Steady-state cell sizes and morphologies of strains overexpressing CLN2 and BCK2. Cultures were grown in SD-Ura to an OD600 of ∼1.5 and reinoculated into SD-Ura, Sraff-Ura, and Sgal-Ura (each sugar at 2%) at a 1:1000 ratio for SD-Ura or a 1:100 ratio for Raff and Gal cultures. These cultures were shaken overnight for 16 h at 30°C to obtain an OD600 of 0.5–1.0. Cell size measurements were performed on a cell counter, and DIC images of the cultures were captured as described in Materials and Methods. Strain genotypes are indicated to the left, and the sugar used is indicated at the top of each column. Charts show the cell size distributions of the cultures. Black lines, cell volume distribution in glucose; red lines, cell volume distribution in raffinose; green lines, cell volume distribution in galactose. The mean cell size of each culture is indicated on each chart with the same color scheme as the lines and column headings for the DIC images. The maximum on the x-axis is 300 fl. The GAL1 promoter is abbreviated as GAL1pr. Scale bar, 20 μm.
FIGURE 5:
FIGURE 5:
Steady-state DNA content of strains overexpressing CLN2 and BCK2. The DNA content of the strains shown in Figure 4 was determined by flow cytometry, as described in Materials and Methods. Each strain is shown in a column with the cells grown in glucose at top (black), cells grown in raffinose in the middle (red), and cells grown in galactose at the bottom (green), as indicated in the titles. The percentages of cells containing 1N or 2N DNA content are indicated next to each peak. Percentages do not add to 100% because of measured events outside of the peaks but within the gated measurements. The GAL1 promoter is abbreviated as GAL1pr.
FIGURE 6:
FIGURE 6:
Steady-state cell sizes and morphologies of bck2∆ and mbp1∆ mutant strains overexpressing WHI5. Cultures were grown in SD-His to an OD600 of ∼1.5 and reinoculated into SD-His, Sraff-His, and Sgal-His (each sugar at 2%) at a 1:1000 ratio for SD-Ura or a 1:100 ratio for Raff and Gal cultures. These cultures were shaken overnight for 16 h at 30°C to obtain an OD600 of 0.5–1.0. Cell size measurements were performed on a cell counter, and DIC images of the cultures were captured as described in Materials and Methods. Strain genotypes are indicated to the left, and the sugar used is indicated at the top of each column. Charts show the cell size distributions of the cultures. Black lines, cell volume distribution in glucose; red lines, cell volume distribution in raffinose; green lines, cell volume distribution in galactose. The mean cell size of each culture is indicated on each chart with the same color scheme as the lines and column headings for the DIC images. The maximum on the x-axis is 300 fl. The GAL1 promoter is abbreviated as GAL1pr. Scale bar, 20 μm.
FIGURE 7:
FIGURE 7:
Steady-state DNA content of bck2∆ and mbp1∆ mutant strains overexpressing WHI5. The DNA content of the strains shown in Figure 6 was determined by flow cytometry, as described in Materials and Methods. Each strain is shown in a column with the cells grown in glucose at top (black), cells grown in raffinose in the middle (red), and cells grown in galactose at the bottom (green). The percentages of cells containing 1N or 2N DNA content are indicated next to each peak. Percentages do not add to 100% because of measured events outside of the peaks but within the gated measurements. The GAL1 promoter is abbreviated as GAL1pr.
FIGURE 8:
FIGURE 8:
Steady-state cell sizes and morphologies of cln3∆ and swi6∆ mutant strains overexpressing WHI5. Cultures were grown in SD-His to an OD600 of ∼1.5 and reinoculated into SD-His, Sraff-His, and Sgal-His (each sugar at 2%) at a 1:1000 ratio for SD-Ura or a 1:100 ratio for Raff and Gal cultures. These cultures were shaken overnight for 16 h at 30°C to obtain an OD600 of 0.5-1.0. Cell size measurements were performed on a cell counter, and DIC images of the cultures were captured as described in Materials and Methods. Strain genotypes are indicated to the left, and the sugar used is indicated at the top of each column. Charts show the cell size distributions of the cultures. Black lines, cell volume distribution in glucose; red lines, cell volume distribution in raffinose; green lines, cell volume distribution in galactose. The mean cell size of each culture is indicated on each chart with the same color scheme as the lines and column headings for the DIC images. Note that the maximum on the x-axis is 500 fl. The GAL1 promoter is abbreviated as GAL1pr. Scale bar, 20 μm.
FIGURE 9:
FIGURE 9:
Steady-state DNA content of cln3∆ and swi6∆ mutant strains overexpressing WHI5. The DNA content of the strains shown in Figure 8 was determined by flow cytometry, as described in Materials and Methods. Each strain is shown in a column with the cells grown in glucose at top (black), cells grown in raffinose in the middle (red), and cells grown in galactose at the bottom (green). The percentages of cells containing 1N or 2N DNA content are indicated next to each peak. Percentages do not add to 100% because of measured events outside of the peaks but within the gated measurements. The GAL1 promoter is abbreviated as GAL1pr.

Similar articles

Cited by

References

    1. Adams BG. Induction of galactokinase in Saccharomyces cerevisiae: kinetics of induction and glucose effects. J Bacteriol. 1972;111:308–315. - PMC - PubMed
    1. Alberghina L, Rossi RL, Querin L, Wanke V, Vanoni M. A cell sizer network involving Cln3 and Far1 controls entrance into S phase in the mitotic cycle of budding yeast. J Cell Biol. 2004;167:433–443. - PMC - PubMed
    1. Alepuz PM, Matheos D, Cunningham KW, Estruch F. The Saccharomyces cerevisiae RanGTP-binding protein msn5p is involved in different signal transduction pathways. Genetics. 1999;153:1219–1231. - PMC - PubMed
    1. Amon A, Tyers M, Futcher B, Nasmyth K. Mechanisms that help the yeast cell cycle clock tick: G2 cyclins transcriptionally activate G2 cyclins and repress G1 cyclins. Cell. 1993;74:993–1007. - PubMed
    1. Andrews BJ, Moore LA. Interaction of the yeast Swi4 and Swi6 cell cycle regulatory proteins in vitro. Proc Natl Acad Sci USA. 1992;89:11852–11856. - PMC - PubMed

Publication types

MeSH terms

Substances

LinkOut - more resources