. 2015 Aug 27:5:13440.
doi: 10.1038/srep13440.

Decreased Na(+) influx lowers hippocampal neuronal excitability in a mouse model of neonatal influenza infection

Affiliations

Decreased Na(+) influx lowers hippocampal neuronal excitability in a mouse model of neonatal influenza infection

Hoyong Park et al. Sci Rep. .

Abstract

Influenza virus infection is one of common infectious diseases occurring worldwide. The human influenza virus can infect the central nervous system and cause brain dysfunctions affecting cognition and spatial memory. It has been previously shown that infection with the influenza viral protein within the hippocampus decreases Ca(2+) influx and reduces excitatory postsynaptic currents. However, the neuronal properties of animals surviving neonatal infection have not been investigated. Using a mouse model of neonatal influenza infection, we performed thorough electrophysiological analyses of hippocampal neurotransmission. We found that animals surviving the infection exhibited reduced spontaneous transmission with no significant defects in evoked neurotransmission. Interestingly, the hippocampus of the infected group conducted synaptic transmission with less fidelity upon repeated stimulations and failed to generate action potentials faithfully upon step current injections primarily due to reduced Na(+) influx. The reversal potential for the Na(+) current was hyperpolarized and the activation of Na(+) channels was slower in the infected group while the inactivation process was minimally disturbed. Taken together, our observations suggest that neonatally infected offsprings exhibit noticeable deficits at rest and severe failures when higher activity is required. This study provides insight into understanding the cellular mechanisms of influenza infection-associated functional changes in the brain.


Figures

Figure 1
Figure 1. Hippocampal neurons exhibit decreased spontaneous neurotransmission after neonatal influenza infection.
(A) Representative recording traces. (B) The frequency of spontaneous excitatory postsynaptic currents (sEPSCs) was decreased in the hippocampal pyramidal neurons of the mice that survived the neonatal influenza infection (n = 24–31, *p < 0.05), whereas the amplitude of the sEPSCs remained comparable to the control group (p > 0.3).
Figure 2
Figure 2. Synaptic transmission is less reliable in infected mice than in uninfected controls upon repeated stimulations.
(A) The paired-pulse ratio of the evoked excitatory postsynaptic currents (eEPSC) by 50-ms interval electrical stimulations exhibited no significant change in the infected group compared with the uninfected controls (n = 13–15, p > 0.8). (B) The ratio of AMPAR-mediated eEPSCs at −60 mV and NMDAR-mediated eEPSCs at +40 mV was not altered in the hippocampus of the infected group (n = 7–13, p > 0.2). (C) The eEPSCs of the hippocampal neurons from the control and influenza-infected mice in response to 20 consecutive stimuli (10 Hz) revealed a decreased amplitude of eEPSCs upon successive simulations in the infected group as compared with the control group (n = 5–8, *p < 0.05). The insets show representative traces (gray: uninfected control group, black: infected group). (D) Representative images and quantification data of the western blot analyses for GluA1, GluN1, GluN2A, GluN2B, and synaptophysin in the mouse hippocampus at 21 dpi. The expression of GluA1, GluN2A, GluN2B, and synaptophysin remained comparable to controls (n = 4, p > 0.3–0.8), and a tendency of a slight decrease in GluN1 expression was observed in the hippocampi of the infected group (n = 4, p = 0.0571).
Figure 3
Figure 3. Neonatal influenza infection decreases neuronal excitability of the hippocampus.
(A) The number of action potentials in infected mice significantly decreased in response to the given depolarization steps (250-ms duration, 50-pA increment, 11 steps). The injection of a strong depolarization current (>200 pA) evoked less action potentials in the infected group compared with the uninfected control group (n = 15–20, *p < 0.05). (B,C) The threshold to initiate action potentials or the resting membrane potential in the infected group (Inf. or Infection) remained comparable to the control group (Con. or Control) (p > 0.4, n = 9–13 for the threshold; p > 0.6, n = 13–18 for the resting membrane potential).
Figure 4
Figure 4. K+ channel- and HCN channel- mediated currents are not altered upon neonatal influenza infection.
(A) A series of voltage steps (500-ms duration, 10-mV increment from −80 to +20 mV) were given in the presence of a mixture of channel inhibitors (CdCl2, TTX, PTX, CNQX and AP5). The peak and sustained currents were measured by quantifying the amount of current (shown with arrows). Both the peak and sustained current through the K+ channels were comparable in the infected and control groups (n = 28–30, p > 0.4; scale bar: 1 nA and 100 ms). (B) A series of hyperpolarizing voltage steps were given to measure Ih current through the HCN channel in the presence of the channel inhibitor mixture. There was no significant difference in the amount of Ih current between both groups of animals (n = 25–27, p > 0.1; scale bar: 200 pA and 100 ms).
Figure 5
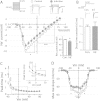
Figure 5. Reduced Na+ current upon neonatal influenza infection is responsible for decreased neuronal excitability.
(A) The current through the voltage-gated Na+ channels was measured by giving a series of voltage steps (−90 mV to +80 mV, 10-mV increase each steps) in the presence of CdCl2, ZD7288, PTX, CNQX and AP5 in the aCSF, and TEA was added to the internal solution. The Na+ channel current was significantly reduced at slightly depolarized potentials (n = 13–18, *p < 0.05, scale bar: 5 nA and 5 ms), leading to a rightward shift in the I-V curve. (Inset) The measured reversal potential of INa was significantly hyperpolarized in the hippocampal neurons of the infected group (*p < 0.05). (B) The inactivation kinetics of the Na+ influx remained comparable between the two groups when we compared the decay time constants (n = 13–18, p > 0.9, scale bar: 5 ms). (C) The peak time of the Na+ channel-mediated currents at each voltage-step was notably delayed in CA1 neurons upon neonatal influenza infection. The inset represents the peak time between −20 and 30 mV (*p < 0.05, ***p < 0.01). (D) The max rise slope of INa was also significantly decreased in the infected group (*p < 0.05, ***p < 0.01).
Figure 6
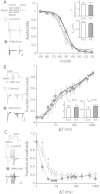
Figure 6. Na+ channel inactivation kinetics of the neonatal influenza infected group remains comparable to the uninfected control group.
(A) The availability was measured by the conductance ratio (G/Gmax) at a test step (0 mV, 30 ms) after pre-inactivation steps (–90 mV to 10 mV, 500 ms, 10-mV increment). The availability of the Na+ channels remained comparable in both groups. The median voltage of availability (Vmid) and the slope factor (k) were not altered upon neonatal influenza infection (inset, n = 5–9, p > 0.1, representative traces at –90, –50 and 10 mV step; scale bar: 2 nA and 50 ms). Representative fitting functions are shown in bold lines (Boltzmann function, gray: infected control with Vmid = –54.86 and k = 6.43; black: neonatal infected group with Vmid = –49.76 and k = 6.24). (B) The time course of recovery after inactivation remained intact in the infected group was (ΔT : 1 ms ~ 1000 ms). When the fraction of the recovery plot was fitted with a double-exponential function, both time constants (τfast and τslow) were not different between two groups (n = 6–7, p > 0.2; scale bar: 250 pA and 2.5 ms). Representative fitting functions are shown in bold lines (Double-exponential function; gray: uninfected control with τfast = 6.08 and τslow = 256.44; black: neonatal infected group with τfast = 6.36 and τslow = 350.58) (C) The onset of inactivation was measured with a pre-pulse of increasing duration at −50 mV. The inactivation started significantly earlier at relatively brief pre-pulses in the infected group (ΔT: 2 and 4, *p < 0.05). Beyond 4 ms, the fraction of available Na+ channels in the infected group was not different from the control group (n = 6–7, p > 0.06; scale bar: 1 nA and 2.5 ms).

Similar articles

Cited by

References

    1. Jang H. et al.. Highly pathogenic H5N1 influenza virus can enter the central nervous system and induce neuroinflammation and neurodegeneration. Proc Natl Acad Sci USA. 106, 14063–14068 (2009). - PMC - PubMed
    1. Kristensson K. Avian influenza and the brain–comments on the occasion of resurrection of the Spanish flu virus. Brain Res Bull. 68, 406–413 (2006). - PubMed
    1. Ekstrand J. J. Neurologic complications of influenza. Semin Pediatr Neurol. 19, 96–100 (2012). - PubMed
    1. Baltagi S. A., Shoykhet M., Felmet K., Kochanek P. M. & Bell M. J. Neurological sequelae of 2009 influenza A (H1N1) in children: a case series observed during a pandemic. Pediatr Crit Care Med. 11, 179–184 (2010). - PubMed
    1. Noriega L. M. et al.. Pandemic influenza A (H1N1) 2009 with neurological manifestations, a case series. Influenza and other respiratory viruses. 4, 117–120 (2010). - PMC - PubMed

Publication types

Substances

LinkOut - more resources