. 2015 Aug 27:5:13513.
doi: 10.1038/srep13513.

A Rich-Club Organization in Brain Ischemia Protein Interaction Network

Affiliations

A Rich-Club Organization in Brain Ischemia Protein Interaction Network

Ali Alawieh et al. Sci Rep. .

Abstract

Ischemic stroke involves multiple pathophysiological mechanisms with complex interactions. Efforts to decipher those mechanisms and understand the evolution of cerebral injury is key for developing successful interventions. In an innovative approach, we use literature mining, natural language processing and systems biology tools to construct, annotate and curate a brain ischemia interactome. The curated interactome includes proteins that are deregulated after cerebral ischemia in human and experimental stroke. Network analysis of the interactome revealed a rich-club organization indicating the presence of a densely interconnected hub structure of prominent contributors to disease pathogenesis. Functional annotation of the interactome uncovered prominent pathways and highlighted the critical role of the complement and coagulation cascade in the initiation and amplification of injury starting by activation of the rich-club. We performed an in-silico screen for putative interventions that have pleiotropic effects on rich-club components and we identified estrogen as a prominent candidate. Our findings show that complex network analysis of disease related interactomes may lead to a better understanding of pathogenic mechanisms and provide cost-effective and mechanism-based discovery of candidate therapeutics.


Figures

Figure 1
Figure 1. Functional annotation of brain ischemia interactome proteins.
(A) Functional annotation of BII proteins by tissue expression reveals a predominant expression in brain tissue followed by liver tissue. This finding is anticipated given the fact that stroke is a disease of brain tissue that also involves systemic response mechanisms. Blue bars indicate the number of genes per annotation category enriched in BII with less than 1% FDR. (B) Functional annotation of BII proteins by cellular components reveals that the majority of the proteins are present in the extracellular space and plasma membrane compared to cytosol and cellular fractions indicating that the majority of pathophysiological events after stroke occur on and around the cell surface. Blue bars indicate the number of genes per annotation category enriched in BII with less than 1% FDR. (C) Clustering of enriched GO biological processes shows that inflammatory processes were the most enriched biological processes followed by homeostatic mechanisms, and then response to estradiol and regulation of cell death. Red bars show the enrichment score calculated through functional annotation clustering in DAVID. Blue bars show the number of genes for each functional annotation.
Figure 2
Figure 2. Venn Diagram of the distribution of BII proteins on different significantly enriched KEGG pathways.
(A) Pathways with p-value less than 10^–12 are included. Complement and coagulation cascade (CCC) is the most enriched pathway and together with calcium signaling and MAPK signaling pathways form the three most significant pathways in our BII. Notably, Complement and Coagulation Pathway has little overlap in terms of components (4.4%) with other pathways compared to the latter two major pathways (22% and 48%). (B) Protein -protein interactions among the three most prominent pathways in the network. White dots indicate a node (protein) and edges indicate interactions. Red edges denote interactions that involve the CCC. Other edges are colored green. Despite the minimal intersection in terms of components between the CCC and other pathways, this cascade is still heavily interconnected with other prominent pathways in the network.
Figure 3
Figure 3. Properties of the BII Network.
(A) Power-law distribution curve of the BII network shows a negative correlation between node frequency (vertical axis) and node-specific degree (horizontal axis). This indicates that there are low frequency of nodes with higher degree in the network (hubs) and high frequency of low degree nodes (non-hubs). (B) Example of a power-law network compared to random network. Circles denote nodes in the network, red circles denote hub nodes, and blue circles denote non-hub nodes. (C) Identification of small-world organization within the BII. Clustering coefficient of BII network was significantly higher than that of randomly generated comparable networks (n=100). The small-world coefficient was 8.5 indicating the presence of a small world organization. One-sample t-test; ***p-value < 0.0001. (D) Raw rich-club coefficient of our network (blue) and random network (red) plotted against the left vertical axis. Normalized rich-club coefficient for the network (green) plotted against the right vertical axis. The shaded region indicates the range of degrees over which a rich-club organization is present (degree 40–180; peak at degree 132). The region of strongest rich-club component is also highlighted in red. Horizontal dashed lines correspond to unity values of 1 for both φ and ρ. (E) Nodes constituting the rich-club were significantly more studied (higher frequency of occurrence) in the curated literature than nods outside the rich club. Bars = mean +/− SEM. ***p < 0.0001.
Figure 4
Figure 4. The core of BII network rich-club.
(A) Network of brain ischemic interactome (BII) revealing the core of the rich-club (red box) and CRP as the center of the rich club. Only the core of the rich-club (subnetwork of nodes with degrees corresponding to the peak of normalized rich-club coefficient) is highlighted for illustrative purposes. Circles denote the protein nodes. Red edges label interactions are among rich-club proteins while grey edges label other interactions. Width of the edge maps the combined score of evidence for each interaction as per STRING database. The core of the rich-club shown in the square shows the dense interactions among the rich-club proteins. (B) Distribution of the BII nodes among the rich-club core and the strongest rich-club component.
Figure 5
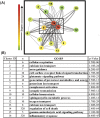
Figure 5. Identification of modules within the BII using Markov Clustering Algorithm.
(A) Visualization of the network of interactions among the 16 MCL modules reveals that modules 5, 14 and 16 are the most central modules. Node color reflects the degree centrality measure and edge width denotes the number of connections among members of respective modules. (B) Functional annotation of GO biological processes predominantly enriched in each pathway showing multiple pathways interacting together in the context of brain ischemia/reperfusion injury (n: number of nodes in each cluster, p-value for the significance of enrichment of respective GO biological process. Clustering shown in (3A&3B) provides a faithful abstraction of the large network of protein interactions and emphasizes minor contributors that are otherwise masked in the full network analysis.
Figure 6
Figure 6. Estrogen targets within the BII showing that estrogen preferentially targets components of the rich-club.
(A) Enrichment scores for the different drugs and chemicals that target the network and the rich-club. Black bars show enrichment scores for targets in the network. Grey bars show enrichment scores for targets in the rich-club. (B) Mean degree of estrogen targets is significantly higher than estrogen non-targets (Bars = mean +/− SEM. *p < 0.0001). (C) Distribution of estrogen targets and non-targets within the entire BII network and the rich-club revealing a preference of estrogen to target rich-club components. Enrichment of estrogen targets in the rich-club was assessed by Fischer exact t-test *p < 0.0001. Bars = mean +/− SEM. (D) Different targets of estrogen among the BII. Nodes other than estrogen are encoded by color (denoting frequency of occurrence in literature) and size (denoting degree in the BII network).

References

    1. Feigin V. L. et al. Global and regional burden of stroke during 1990–2010: findings from the Global Burden of Disease Study 2010. Lancet 383, 245–254 (2014). - PMC - PubMed
    1. Go A. S. et al. Heart disease and stroke statistics—2013 update: a report from the American Heart Association. Circulation 127, e6 (2013). - PMC - PubMed
    1. Chamorro A. et al. The immunology of acute stroke. Nature reviews. Neurology 8, 401–410 (2012). - PubMed
    1. Lo E. H., Dalkara T. & Moskowitz M. A. Mechanisms, challenges and opportunities in stroke. Nature Reviews Neuroscience 4, 399–414 (2003). - PubMed
    1. Moskowitz M. A., Lo E. H. & Iadecola C. The science of stroke: mechanisms in search of treatments. Neuron 67, 181–198 (2010). - PMC - PubMed

LinkOut - more resources