. 2015 Dec 15;309(12):C799-812.
doi: 10.1152/ajpcell.00214.2015. Epub 2015 Aug 26.

Deep proteomic profiling of vasopressin-sensitive collecting duct cells. II. Bioinformatic analysis of vasopressin signaling

Affiliations

Deep proteomic profiling of vasopressin-sensitive collecting duct cells. II. Bioinformatic analysis of vasopressin signaling

Chin-Rang Yang et al. Am J Physiol Cell Physiol. .

Abstract

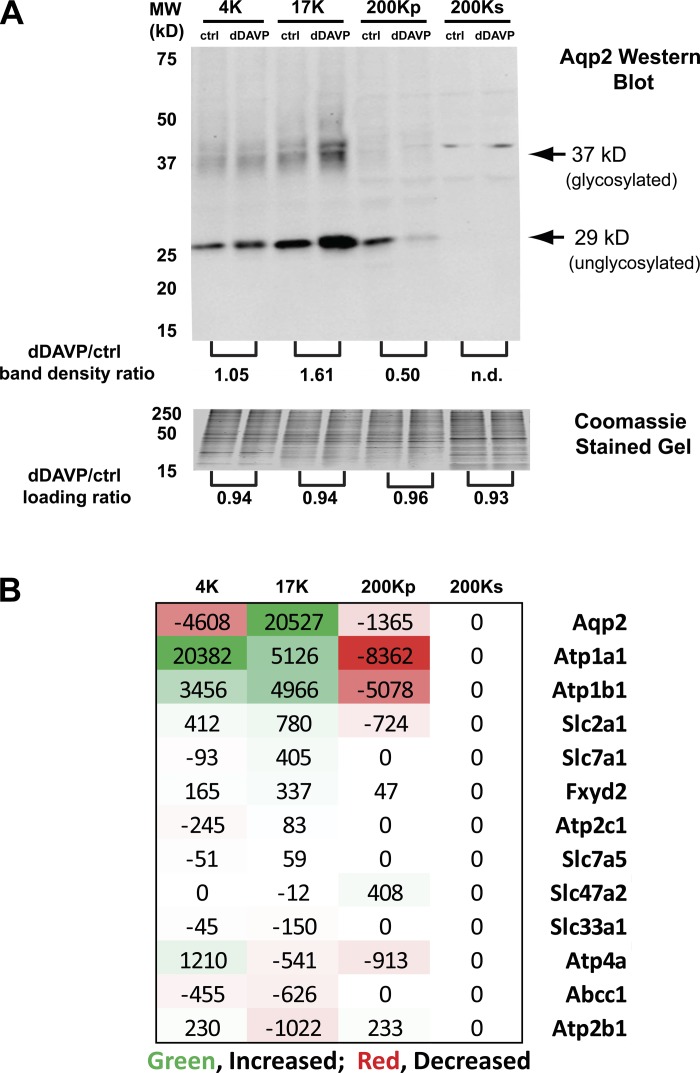
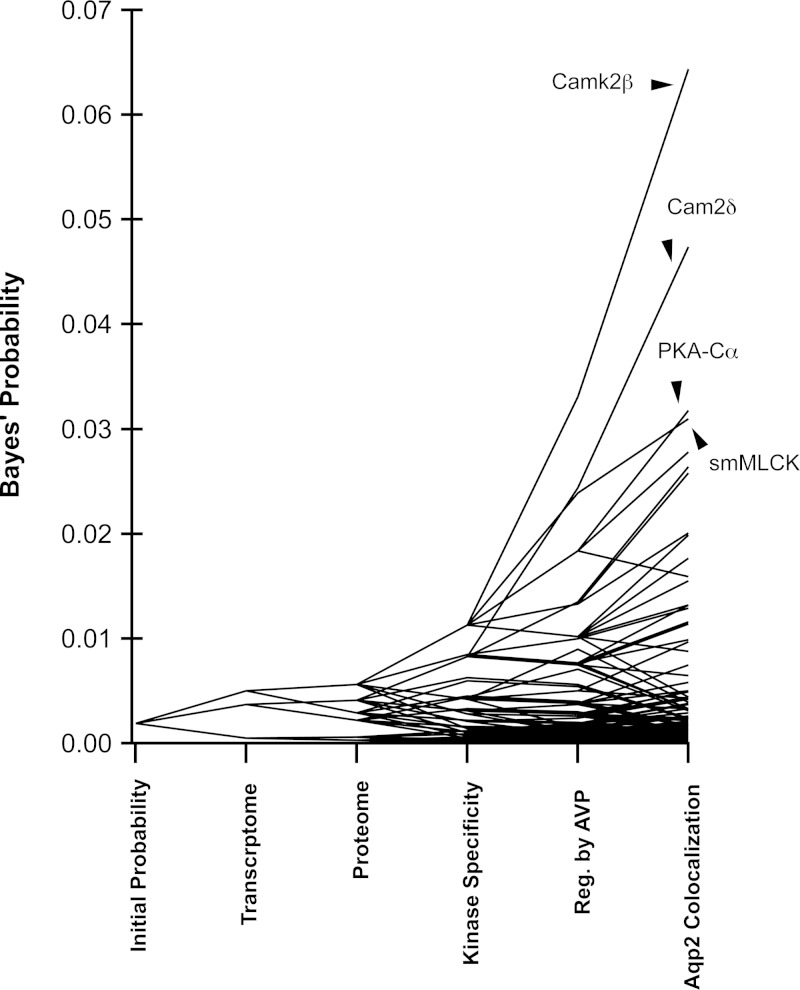
Vasopressin controls osmotic water transport in the renal collecting duct through regulation of aquaporin-2 (AQP2). We carried out bioinformatic analysis of quantitative proteomic data from the accompanying article to investigate the mechanisms involved. The experiments used stable isotope labeling by amino acids in cell culture in cultured mpkCCD cells to quantify each protein species in each of five differential-centrifugation (DC) fractions with or without the vasopressin analog 1-desamino-8-d-arginine-vasopressin (dDAVP). The mass spectrometry data and parallel Western blot experiments confirmed that dDAVP addition is associated with an increase in AQP2 abundance in the 17,000-g pellet and a corresponding decrease in the 200,000-g pellet. Remarkably, all subunits of the cytoplasmic ribosome also increased in the 17,000-g pellet in response to dDAVP (P < 10(-34)), with a concomitant decrease in the 200,000-g pellet. Eukaryotic translation initiation complex 3 (eIF3) subunits underwent parallel changes (P < 10(-6)). These findings are consistent with translocation of assembled ribosomes and eIF3 complexes into the rough endoplasmic reticulum in response to dDAVP. Conversely, there was a systematic decrease in small GTPase abundances in the 17,000-g fraction. In contrast, most proteins, including protein kinases, showed no systematic redistribution among DC fractions. Of the 521 protein kinases coded by the mouse genome, 246 were identified, but many fewer were found to colocalize with AQP2 among DC fractions. Bayes' rule was used to integrate the new colocalization data with prior data to identify protein kinases most likely to phosphorylate aquaporin-2 at Ser(256) (Camk2b > Camk2d > Prkaca) and Ser(261) (Mapk1 = Mapk3 > Mapk14).

Keywords: aquaporin-2; mass spectrometry; phosphorylation; protein kinase; ribosome; small GTPase; translation.


Figures

Fig. 1.
Fig. 1.
Proteins associated with different subcellular components show distinct distributions among differential-centrifugation (DC) fractions from mouse mpkCCD cells. “Enrichment” is calculated as percentage of proteins in a given subcellular fraction that has a particular Gene Ontology (GO) Cellular Component term divided by the corresponding percentage that has that GO Cellular Component term in all proteins identified in all fractions. Bars represent the following DC fractions: 1,000-g pellet (1K), 4,000-g pellet (4K), 17,000-g pellet (17K), 200,000-g pellet (200Kp), and 200,000-g supernatant (200Ks). The term “ribosome” includes only the cytoplasmic ribosome, and not the mitochondrial ribosome. The analysis used all data from mass spectrometry-based proteomics of mouse mpkCCD cells (see https://helixweb.nih.gov/ESBL/Database/mpkFractions/).
Fig. 2.
Fig. 2.
Distribution of subcellular marker proteins among DC fractions from mouse mpkCCD cells. Values are calculated as percentage of total among all fractions for each protein. Data columns represent DC fractions: 1K, 4K, 17K, 200Kp, and 200Ks. Yellow shading highlights values >10%. The analysis used data from mass spectrometry-based proteomic analysis of mouse mpkCCD cells (see https://helixweb.nih.gov/ESBL/Database/mpkFractions/).
Fig. 3.
Fig. 3.
Immunoblotting and quantitative mass spectrometry confirm the previously demonstrated effect of vasopressin to cause redistribution of aquaporin-2 (AQP2) from the 200Kp fraction to the 17K fraction. A: immunoblot of AQP2 in DC fractions from mouse mpkCCD cells after treatment of the cells with the vasopressin analog 1-desamino-8-d-arginine-vasopressin (dDAVP) or vehicle (ctrl) for 30 min. Band density ratios (dDAVP/ctrl) are shown at bottom of blot. Bottom: Coomassie-stained loading gel (compressed to 40% in the vertical direction) demonstrating equal loading between vehicle (ctrl)- and dDAVP-treated samples. Mean pixel density measured for entire lane length. B: protein abundance changes from quantitative liquid chromatography-tandem mass spectroscopy in DC fractions from mouse mpkCCD cells after treatment of cells with dDAVP or vehicle (ctrl) for 30 min. Changes are in arbitrary units from total areas under the reconstructed chromatograms for light and heavy versions of each peptide using stable isotope labeling by amino acids in cell culture (SILAC). AQP2 and the 2 subunits of the Na-K-ATPase (Atp1a1 and Atp1b1) showed similar patterns, while other integral membrane proteins showed varying patterns.
Fig. 4.
Fig. 4.
Protein populations that show reciprocal abundance changes in DC fractions in response to dDAVP. Proteins from https://helixweb.nih.gov/ESBL/Database/mpkFractions/ were aggregated into specific subpopulations based on GO Cellular Component terms or PANTHER molecular function terms. Change in abundance was calculated for each protein in each subpopulation using SILAC quantification data. Proportion of positive values (“increased by dDAVP”) or negative values (“decreased by dDAVP”) was compared with proportion in full data set using the Benjamini-Hochberg algorithm. P values represent fractional false discovery rates. (See Supplemental Table S1 for full calculations.) Only representative values are shown; most subpopulations tested showed no change in proportion increased or decreased, i.e., P > 10−2. See Figs. 5 and 6 for protein lists for some of these terms.
Fig. 5.
Fig. 5.
Changes in individual protein abundances in DC fractions in response to dDAVP, focusing on protein complexes involved with regulation of protein production or degradation. Proteins making up specific complexes were identified at the Corum website (http://mips.helmholtz-muenchen.de/genre/proj/corum/) or by GO terms.
Fig. 6.
Fig. 6.
Changes in individual small GTPase protein abundances in DC fractions in response to dDAVP. Note that virtually all small GTPase manifested negative abundance changes in the 17,000-g fraction. These divided into 2 groups, depending on whether the reciprocal increase in small GTPase protein abundances was in the 200,000-g supernatant (i.e., cytosol) or the 1,000-g pellet. Official gene symbols highlighted in yellow were previously identified by mass spectrometry as elements of AQP2-containing intracellular vesicles in rat inner medullary collecting duct cells (2).
Fig. 7.
Fig. 7.
Co-clustering of subcellular distributions of basophilic kinases (black) and potential substrates (red) reveals colocalized kinase-substrate pairs. Basophilic kinases listed are members of the AGC or CAMK protein kinase families found in this study to be expressed in mouse mpkCCD cells. Substrates listed are proteins with vasopressin-regulated phosphorylation sites from Rinschen et al. (27) that are present in motifs compatible with phosphorylation by a basophilic kinase. Clustering was by hierarchical clustering using R (Heatmap2 package) represented by the tree at left.
Fig. 8.
Fig. 8.
Extent of subcellular colocalization of AQP2 protein and basophilic kinases expressed in mouse mpkCCD cells based on dot product of distribution vectors provides a ranking of kinases. Distribution vectors are formed from relative abundance values in each of the 5 fractions obtained from Fig. 7. Only the top-40 basophilic kinases are shown. All others manifested no substantial colocalization. Colocalized basophilic kinases are candidates to phosphorylate Ser256, Ser264, and Ser269 of AQP2.
Fig. 9.
Fig. 9.
Co-clustering of subcellular distributions of proline-directed kinases (black) and potential substrates (red) reveals colocalized kinase-substrate pairs. Proline-directed kinases listed are members of the CMGC protein kinase family that were found in this study to be expressed in mouse mpkCCD cells. Substrates listed are proteins in mouse mpkCCD cells with vasopressin-regulated phosphorylation sites from Rinschen et al. (27) that are present in motifs compatible with phosphorylation by a proline-directed kinase, i.e., with a proline in position +1 relative to the phosphorylated amino acid. Clustering was by hierarchical clustering using R (Heatmap2 package) represented by the tree at left.
Fig. 10.
Fig. 10.
Extent of subcellular colocalization of AQP2 protein and proline-directed kinases expressed in mouse mpkCCD cells based on dot product of distribution vectors. Distribution vectors are formed from relative abundance values in each of the 5 fractions obtained from Fig. 9. Colocalized proline-directed kinases are candidates to phosphorylate Ser261 of AQP2 in mouse mpkCCD cells.
Fig. 11.
Fig. 11.
Result of large-scale data integration regarding the following question: “What protein kinase is most likely to phosphorylate AQP2 at Ser256 in mouse mpkCCD cells?” Starting with all 521 protein kinases in the mouse genome set to “equal probabilities,” Bayes' theorem was used to incorporate the following information (in order): transcript abundances in mpkCCD (“transcriptome”), presence or absence in proteomic studies of mpkCCD cells (“proteome”), degree of match between kinase family target specificity and AQP2 sequence surrounding Ser256 (“kinase specificity”), evidence for regulation by vasopressin (“Reg by AVP”), and colocalization with AQP2 using the dot products from Fig. 8 (“AQP2 colocalization”). See text for references. The top-ranking protein kinases are indicated. See Supplemental Data Set 5 for detail of calculations.
Fig. 12.
Fig. 12.
Result of large-scale data integration regarding the following question: “What protein kinase is most likely to phosphorylate AQP2 at Ser261 in mouse mpkCCD cells?” Starting with all 521 protein kinases in the mouse genome set to “equal probabilities,” Bayes' theorem was used to incorporate the following information (in order): transcript abundances in mpkCCD (“transcriptome”), presence or absence in proteomic studies of mpkCCD cells (“proteome”), degree of match between kinase family target specificity and AQP2 sequence surrounding Ser261 (“kinase specificity”), evidence for regulation by vasopressin (“Reg by AVP”), and colocalization with AQP2 using the dot products from Fig. 10 (“AQP2 colocalization”). See text for references. Top-ranking protein kinases are indicated. See Supplemental Data Set 6 for details of calculations.

Comment in

Similar articles

Cited by

References

    1. Alberts B, Johnson A, Lewis J, Raff M, Roberts K, Walter P. Molecular Biology of the Cell. New York: Garland Science, 2002.
    1. Barile M, Pisitkun T, Yu MJ, Chou CL, Verbalis MJ, Shen RF, Knepper MA. Large scale protein identification in intracellular aquaporin-2 vesicles from renal inner medullary collecting duct. Mol Cell Proteomics 4: 1095–1106, 2005. - PMC - PubMed
    1. Beznoskova P, Cuchalova L, Wagner S, Shoemaker CJ, Gunisova S, von der HT, Valasek LS. Translation initiation factors eIF3 and HCR1 control translation termination and stop codon read-through in yeast cells. PLos Genet 9: e1003962, 2013. - PMC - PubMed
    1. Bolger SJ, Hurtado PA, Hoffert JD, Saeed F, Pisitkun T, Knepper MA. Quantitative phosphoproteomics in nuclei of vasopressin-sensitive renal collecting duct cells. Am J Physiol Cell Physiol 303: C1006–C1020, 2012. - PMC - PubMed
    1. Bonifacino JS. Adaptor proteins involved in polarized sorting. J Cell Biol 204: 7–17, 2014. - PMC - PubMed

Publication types