. 2015 Aug 27:5:13474.
doi: 10.1038/srep13474.

Novel roles for LIX1L in promoting cancer cell proliferation through ROS1-mediated LIX1L phosphorylation

Affiliations

Novel roles for LIX1L in promoting cancer cell proliferation through ROS1-mediated LIX1L phosphorylation

Satoki Nakamura et al. Sci Rep. .

Abstract

Herein, we report the characterization of Limb expression 1-like, (LIX1L), a putative RNA-binding protein (RBP) containing a double-stranded RNA binding motif, which is highly expressed in various cancer tissues. Analysis of MALDI-TOF/TOF mass spectrometry and RNA immunoprecipitation-sequencing of interacting proteins and the microRNAs (miRNAs) bound to LIX1L revealed that LIX1L interacts with proteins (RIOK1, nucleolin and PABPC4) and miRNAs (has-miRNA-520a-5p, -300, -216b, -326, -190a, -548b-3p, -7-5p and -1296) in HEK-293 cells. Moreover, the reduction of phosphorylated Tyr(136) (pTyr(136)) in LIX1L through the homeodomain peptide, PY136, inhibited LIX1L-induced cell proliferation in vitro, and PY136 inhibited MKN45 cell proliferation in vivo. We also determined the miRNA-targeted genes and showed that was apoptosis induced through the reduction of pTyr(136). Moreover, ROS1, HCK, ABL1, ABL2, JAK3, LCK and TYR03 were identified as candidate kinases responsible for the phosphorylation of Tyr(136) of LIX1L. These data provide novel insights into the biological significance of LIX1L, suggesting that this protein might be an RBP, with implications for therapeutic approaches for targeting LIX1L in LIX1L-expressing cancer cells.


Figures

Figure 1
Figure 1. Immunohistochemical (IHC) staining for LIX1L in cancer tissues.
IHC staining of human solid tumor tissue. Gastric cancer (n = 540), pancreatic cancer (n = 43), colon cancer (n = 50), ovarian cancer (n = 50), renal cancer (n = 58), breast cancer (n = 50), lung cancer (n = 64), hepatocellular cancer (n = 47), esophageal cancer (n = 51), prostate cancer (n = 53) and thyroid cancer (n = 50) samples were evaluated (upper panel). A score of 2 or 3 indicated positive LIX1L expression. LIX1L protein expression levels in the frozen surgical specimens (gastric cancer, #1 and #2; colon cancer, #3 and #4; lung cancer, #5 and #6) were assessed using western blotting. Actin was immunoblotted as a loading control. Western blotting results representing three independent experiments are shown (bottom panels). N, normal tissues; T, tumor tissues.
Figure 2
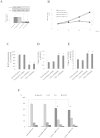
Figure 2. The effects of LIX1L knock-down on gastric cancer cell proliferation.
OCUM-1 cells were transfected with scrambled shRNA or LIX1L shRNA-#1 or -#2. (A) LIX1L protein expression levels in cells were assessed using western blotting. Actin was included as a loading control. Western blotting results representing three independent experiments are shown (upper panels). The LIX1L mRNA level was analyzed using quantitative RT-PCR, and the level was determined relative to that of GAPDH (bottom panel). (B) At three days post-transfection, the number of viable cells was counted every 24 h for three days. *p < 0.01 compared with untransfected control cells. (C) BrdU incorporation was determined through ELISA at 24 h. (D,E) The activities of caspases-3/7 and −9 were determined 48 h after transfection. (F) The cell cycle distribution of OCUM-1 cells was analyzed using flow cytometric analysis at 72 h after transfection. The fractions of cells in the G1, S and G2/M stages of the cell cycle were determined. The results are presented as the mean ± SD from three independent experiments. *p < 0.01.
Figure 3
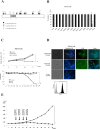
Figure 3. A LIX1L homeodomain peptide inhibits tumor growth.
(A) A schematic diagram showing the domain structure of the human LIX1L protein containing a RBD, predicted serine phosphorylation sites, predicted threonine phosphorylation sites and predicted tyrosine phosphorylation sites. (B) The cell viability with viable cell counts. MKN45 cells were treated with the control peptide or one of 13 homeodomain peptides (50 μM) for 72 h. (C) The cell proliferation was assessed based on the viable cell counts (upper panel) and MTT assay (bottom panel) in cells treated with the indicated concentrations of peptides for 72 h. MKN45 cells were treated with Pcont (25 μM) and PY136 (25 μM). *p < 0.001 (D) Confirmation of 25 μM FAM-PY136 and 25 μM FAM-PY95 internalization (green) into non-permeabilized MKN45 cells after a three-hour treatment. The nuclei were stained using Hoechst 33342 (blue). The cells were viewed using phase-contrast and fluorescence microscopy, and 25 μM Pcont was used negative control. Representative images are shown (magnification, 400x) (upper panels). MKN45 cells treated with FAM-PY136 were analyzed using flow cytometry. Negative control MKN45 cells; light gray region, FAM-PY136-treated MKN45 cells; dark gray region (bottom panel). The arrow indicates the FITC-positive region. (E) Tumor treatment with PY136 (30 μM; n = 3). Cohorts of nude mice bearing size-matched human gastric cancer xenografts (MKN45-derived) were used for the in vivo studies. p < 0.05.
Figure 4
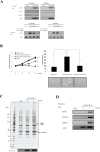
Figure 4. LIX1L-mediated oncogenic effects and identification of LIX1L-associated proteins using a proteome analysis.
(A) Phosphorylated LIX1L was immunoprecipitated from the cytosolic and nuclear fractions of HEK-293FLG and HEK-293FLG-LIX1L cells using a FLAG antibody. Immunoprecipitates were analyzed through western blot analysis with a LIX1L antibody and phosphorylated serine-, threonine- and tyrosine-specific antibodies (upper panels). In the cytosolic and nuclear fractions of the HEK-293FLG and HEK-293FLG-LIX1L cells treated with 25 μM PY95 as a negative control or PY136, immunoprecipitates obtained using the FLAG antibody were analyzed through a western blot analysis with the LIX1L antibody and phosphorylated tyrosine-specific antibodies (bottom panels). Representative blots from HEK-293FLG and HEK-293FLG-LIX1L cell lines are shown. (B) The cell counts of HEK-293FLG and HEK-293FLG-LIX1L cells after treatment with PY136 (left panel). The HEK-293FLG and HEK-293FLG-LIX1L cells were cultured in semisolid methylcellulose media. The HEK-293FLG-LIX1L cells were left untreated or were treated with PY136 (25 μM). After 14 days in culture, colony formation was analyzed, and the cells were viewed using phase-contrast microscopy. The colonies formed from each cell type (3 × 102 to 5 × 102 cells/plate) were counted following plating onto semisolid methylcellulose media (right upper panel). Original magnification 4x (right bottom panels). These data are shown as the mean ± SD for independent experiments. **p < 0.05, *p<0.01. (C) The results of the immunoblot analysis of the cytosolic fraction treated with or without RNase in HEK-293FLG-LIX1L cells. The black arrow indicates the FLAG-LIX1L fusion protein. The red arrows indicate the detected proteins associated with the LIX1L-RNA complex. (D) Western blot analysis revealed that LIX1L interacted with the RIOK1, nucleolin and PABPC4 proteins in the cytoplasm of HEK-293 cells. In (A) and (D), the cropped blots were run under the same experimental condition.
Figure 5
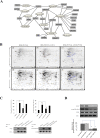
Figure 5. Prediction of target genes for similarly regulated miRNAs and Cofilin phosphorylation through LIX1L.
(A) The results of common targets for similarly upregulated miRNAs suggested that there was coordination between the miRNAs. (B) 2-DE gel images showing the protein expression in HEK-293FLG [(a) and (d)], HEK-293FLG-LIX1L [(b) and (e)] and HEK-293FLG-LIX1L/PY136 [(c) and (f)] cells. The protein samples were loaded onto nonlinear IPG strips (pH 3–10, 17 cm) in an IEF cell and separated through 12% SDS-PAGE. The protein spots were visualized through Pro-Q Diamond phosphoprotein gel staining (upper panels) and SYPRO Ruby protein gel staining (bottom panels). The numbers represent the spot numbers for the detected proteins, and the circles indicate the differentially expressed proteins in HEK-293FLG-LIX1L cells compared with the HEK-293FLG and HEK-293FLG-LIX1L/PY136 cells (red and blue circles indicate up- and downregulation, respectively). Representative images are shown. D/S ratio (phosphorylation index): (%Vol of spot using Pro-Q Diamond stain)/(%Vol of spot using SYPRO Ruby stain) obtained using the Image Master Platinum (GE) software program. (C) Western blot analysis of proteins extracted from HEK-293FLG and HEK-293FLG-LIX1L cells treated with or without PY136 (25 μM) or PY95 (25 μM). The ratio of phosphorylated LIX1L and Cofilin to total LIX1L and Cofilin, respectively (upper panels). *p<0.01. Representative blots from HEK-293FLG and HEK-293FLG-LIX1L cell lines are shown (bottom panels). The cropped blots were run under the same experimental conditions. (D) The knockdown of LIX1L protein using LIX1L shRNA-#1 or -#2 reduced Cofilin phosphorylation levels in MKN45 cells (bottom panel). The basal levels of Cofilin phosphorylation are expressed as 100%. *p<0.01. Western blotting results representing three independent experiments are shown (upper panels). Actin was included as a loading control. The blots were run under the same experimental conditions.
Figure 6
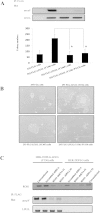
Figure 6. Phosphorylated LIX1L (Y136) promotes cell proliferation.
(A) The HEK-293FLG, HEK-293FLG-LIX1L (Y136) and HEK-293FLG-LIX1L (Y136F) cells were cultured in semisolid methylcellulose media. The HEK-293FLG-LIX1L (Y136) cells were left untreated or were treated with PY136 (25 μM). After 14 days in culture, colony formation was analyzed, and the cells were viewed using phase-contrast microscopy. The colonies formed from each cell type (3 × 102 to 5 × 102 cells/plate) were counted following plating in semisolid methylcellulose media and the phosphorylation levels of LIX1L were analyzed through western blotting. The phosphorylation level of LIX1L was decreased compared with that in LIX1L (Y136) cells. The blots were run under the same experimental conditions. These data are shown as the mean ± SD for independent experiments. *p<0.01. (B) The representative microscopic images of each colony are shown. Original magnification 4x. (C) HEK-293FLG and HEK-293FLG-LIX1L (Y136) cells were transfected with scrambled shRNA, ROS1 shRNA-#1 or -#2, and the phosphorylation level of LIX1L was assessed. The blots were run under the same experimental conditions.

Similar articles

Cited by

References

    1. Nakamura S. et al. Transcriptional repression of Cdc25B by IER5 inhibits the proliferation of leukemic progenitor cells through NF-YB and p300 in acute myeloid leukemia. PLoS One 6, e28011 (2011). - PMC - PubMed
    1. Swindell E. C., Moeller C., Thaller C. & Eichele G. Cloning and expression analysis of chicken Lix1, a founding member of a novel gene family. Mech Dev. 109, 405–408 (2001). - PubMed
    1. Moeller C., Yaylaoglu M. B., Alvarez-Bolado G., Thaller C. & Eichele G. Murine Lix1, a novel marker for substantia nigra, cortical layer 5, and hindbrain structures. Brain Res Gene Expr Patterns. 1, 199–203 (2002). - PubMed
    1. Gerstberger S., Hafner M. & Tuschl T. A census of human RNA-binding proteins. Nat Rev Genet. 15, 829–845 (2014). - PMC - PubMed
    1. Fu X. D. & Ares M. Jr. Context-dependent control of alternative splicing by RNA-binding proteins. Nat Rev Genet. 15, 689–701 (2014). - PMC - PubMed

Publication types

MeSH terms