

The substrate matters in the Raman spectroscopy analysis of cells
- PMID: 26310910
- PMCID: PMC4550836
- DOI: 10.1038/srep13150
The substrate matters in the Raman spectroscopy analysis of cells
Abstract
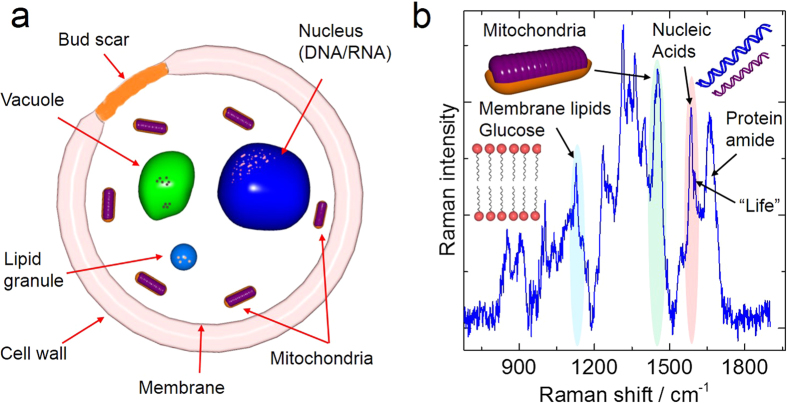
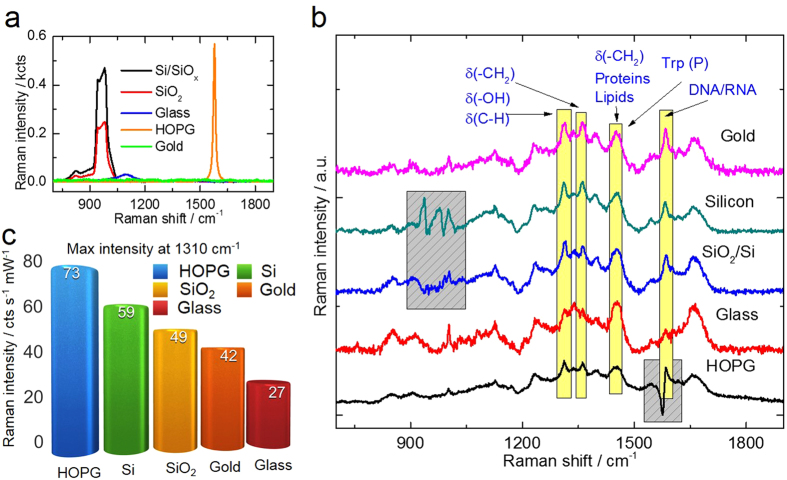
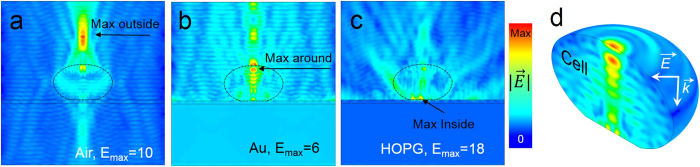
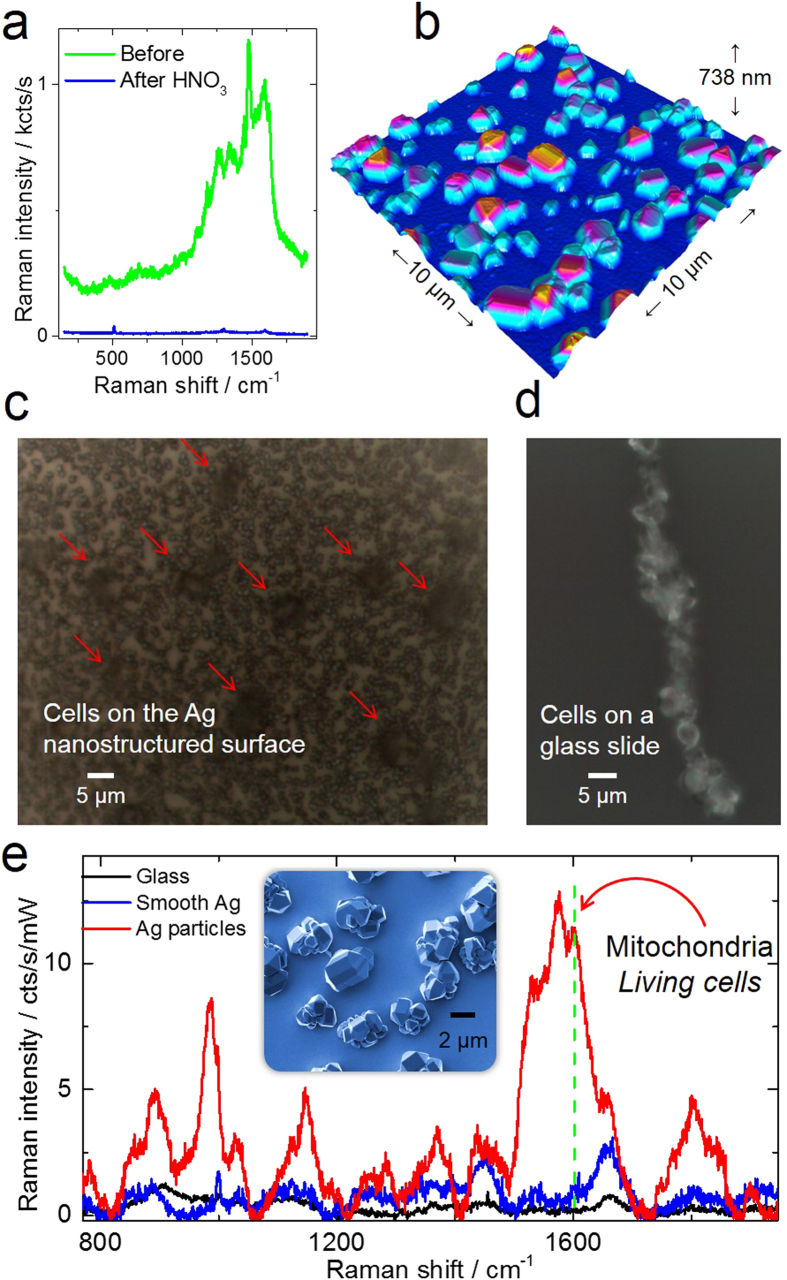
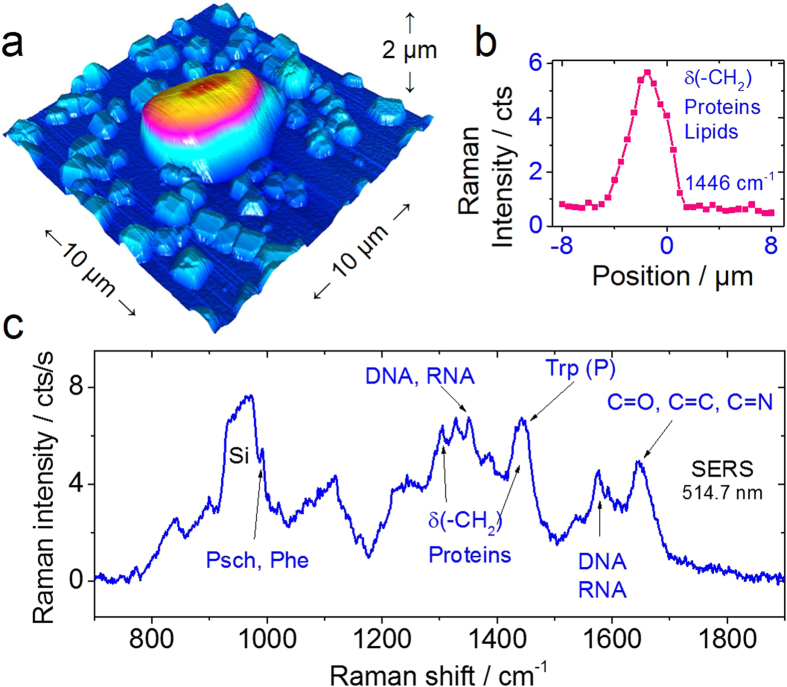
Raman spectroscopy is a powerful analytical method that allows deposited and/or immobilized cells to be evaluated without complex sample preparation or labeling. However, a main limitation of Raman spectroscopy in cell analysis is the extremely weak Raman intensity that results in low signal to noise ratios. Therefore, it is important to seize any opportunity that increases the intensity of the Raman signal and to understand whether and how the signal enhancement changes with respect to the substrate used. Our experimental results show clear differences in the spectroscopic response from cells on different surfaces. This result is partly due to the difference in spatial distribution of electric field at the substrate/cell interface as shown by numerical simulations. We found that the substrate also changes the spatial location of maximum field enhancement around the cells. Moreover, beyond conventional flat surfaces, we introduce an efficient nanostructured silver substrate that largely enhances the Raman signal intensity from a single yeast cell. This work contributes to the field of vibrational spectroscopy analysis by providing a fresh look at the significance of the substrate for Raman investigations in cell research.
Figures
Similar articles
-
Labeled gold nanoparticles immobilized at smooth metallic substrates: systematic investigation of surface plasmon resonance and surface-enhanced Raman scattering.J Phys Chem B. 2006 Sep 7;110(35):17444-51. doi: 10.1021/jp0636930. J Phys Chem B. 2006. PMID: 16942083
-
Dielectrophoretic positioning of single nanoparticles on atomic force microscope tips for tip-enhanced Raman spectroscopy.Electrophoresis. 2015 May;36(9-10):1142-8. doi: 10.1002/elps.201400530. Electrophoresis. 2015. PMID: 25781418
-
Ultrathin diamond-like carbon film coated silver nanoparticles-based substrates for surface-enhanced Raman spectroscopy.ACS Nano. 2010 May 25;4(5):2643-8. doi: 10.1021/nn100053s. ACS Nano. 2010. PMID: 20433194
-
Surface-enhanced Raman scattering in local optical fields of silver and gold nanoaggregates-from single-molecule Raman spectroscopy to ultrasensitive probing in live cells.Acc Chem Res. 2006 Jul;39(7):443-50. doi: 10.1021/ar050107x. Acc Chem Res. 2006. PMID: 16846208 Review.
-
Surface-enhanced Raman scattering imaging using noble metal nanoparticles.Wiley Interdiscip Rev Nanomed Nanobiotechnol. 2013 Mar-Apr;5(2):180-9. doi: 10.1002/wnan.1208. Epub 2013 Jan 17. Wiley Interdiscip Rev Nanomed Nanobiotechnol. 2013. PMID: 23335562 Review.
Cited by
-
Self-Organized SERS Substrates with Efficient Analyte Enrichment in the Hot Spots.ACS Omega. 2024 Jan 18;9(4):4819-4830. doi: 10.1021/acsomega.3c08393. eCollection 2024 Jan 30. ACS Omega. 2024. PMID: 38313516 Free PMC article.
-
FTIR and Raman Spectroscopy-Based Biochemical Profiling Reflects Genomic Diversity of Clinical Candida Isolates That May Be Useful for Diagnosis and Targeted Therapy of Candidiasis.Int J Mol Sci. 2019 Feb 25;20(4):988. doi: 10.3390/ijms20040988. Int J Mol Sci. 2019. PMID: 30823514 Free PMC article.
-
Antibacterial and Antifungal Properties of Silver Nanoparticles-Effect of a Surface-Stabilizing Agent.Biomolecules. 2021 Oct 7;11(10):1481. doi: 10.3390/biom11101481. Biomolecules. 2021. PMID: 34680114 Free PMC article.
-
Investigation on the Cancer Invasion and Metastasis of Skin Squamous Cell Carcinoma by Raman Spectroscopy.Molecules. 2019 May 30;24(11):2059. doi: 10.3390/molecules24112059. Molecules. 2019. PMID: 31151168 Free PMC article.
-
Illuminating the Tiny World: A Navigation Guide for Proper Raman Studies on Microorganisms.Molecules. 2024 Feb 29;29(5):1077. doi: 10.3390/molecules29051077. Molecules. 2024. PMID: 38474589 Free PMC article. Review.
References
-
- Yagur-Kroll S. et al. A miniature porous aluminum oxide-based flow-cell for online water quality monitoring using bacterial sensor cells. Biosens Bioelectron 64, 625–632 (2015). - PubMed
-
- Ramanavicius A. & Ramanaviciene A. Hemoproteins in Design of Biofuel Cells. Fuel Cells 9, 25–36 (2009).
-
- Selvakumar R. et al. Screening of silver nanoparticles containing carbonized yeast cells for adsorption of few long-lived active radionuclides. J Radioanal Nucl Ch 288, 629–633 (2011).
Publication types
MeSH terms
Substances
LinkOut - more resources
Full Text Sources
Other Literature Sources
Molecular Biology Databases
