. 2015 Oct;114(4):2431-8.
doi: 10.1152/jn.00526.2015. Epub 2015 Aug 26.

Morphology and function of three VIP-expressing amacrine cell types in the mouse retina

Affiliations

Morphology and function of three VIP-expressing amacrine cell types in the mouse retina

Alejandro Akrouh et al. J Neurophysiol. 2015 Oct.

Abstract

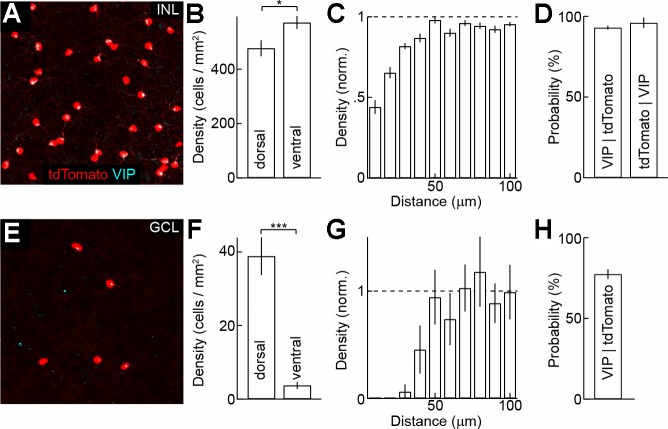
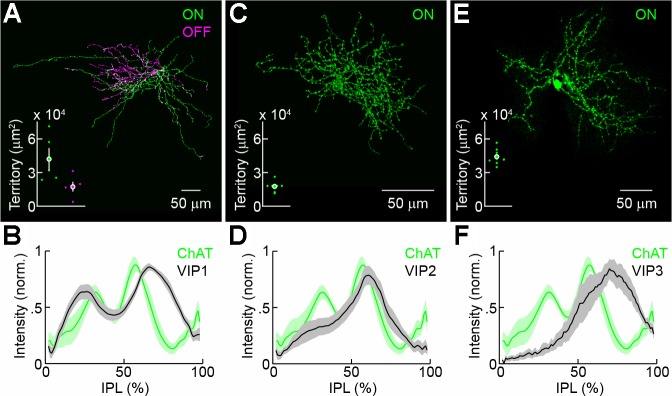
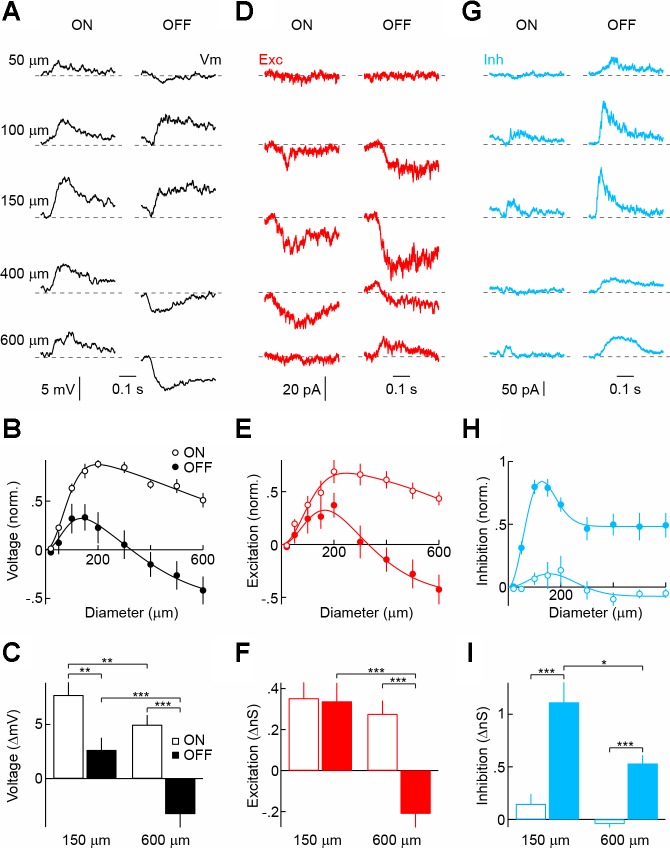
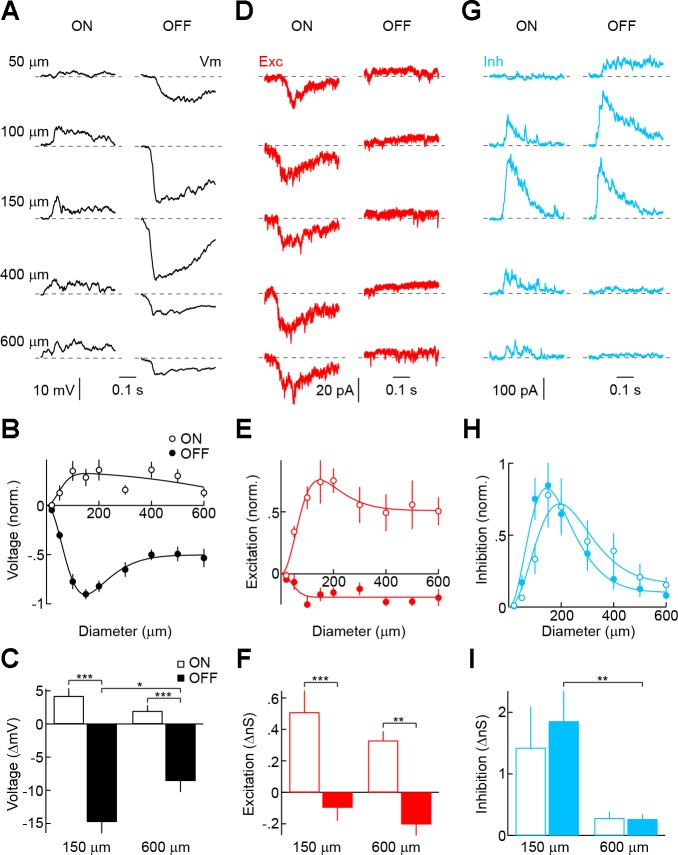
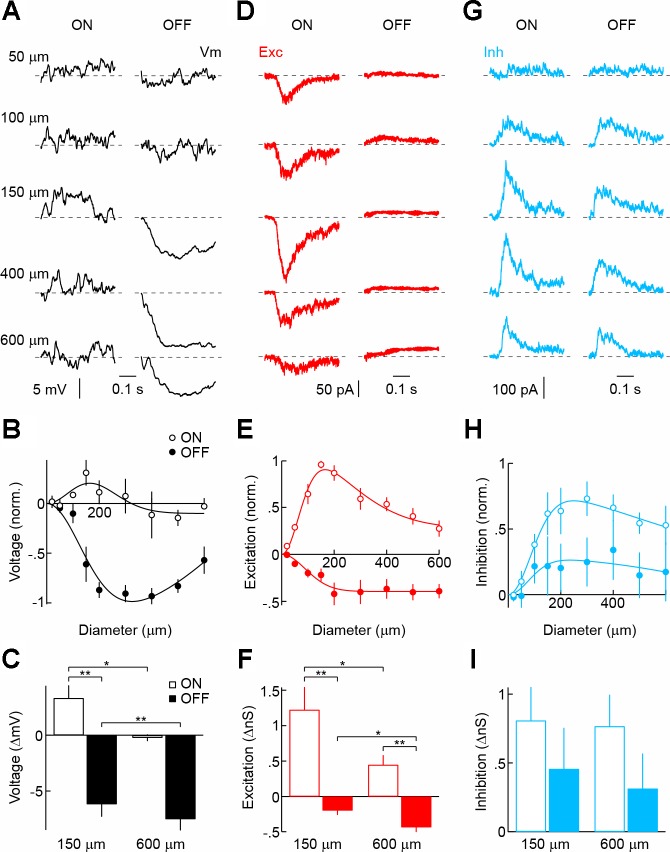
Amacrine cells (ACs) are the most diverse class of neurons in the retina. The variety of signals provided by ACs allows the retina to encode a wide range of visual features. Of the 30-50 AC types in mammalian species, few have been studied in detail. Here, we combine genetic and viral strategies to identify and to characterize morphologically three vasoactive intestinal polypeptide-expressing GABAergic AC types (VIP1-, VIP2-, and VIP3-ACs) in mice. Somata of VIP1- and VIP2-ACs reside in the inner nuclear layer and somata of VIP3-ACs in the ganglion cell layer, and they show asymmetric distributions along the dorsoventral axis of the retina. Neurite arbors of VIP-ACs differ in size (VIP1-ACs ≈ VIP3-ACs > VIP2-ACs) and stratify in distinct sublaminae of the inner plexiform layer. To analyze light responses and underlying synaptic inputs, we target VIP-ACs under 2-photon guidance for patch-clamp recordings. VIP1-ACs depolarize strongly to light increments (ON) over a wide range of stimulus sizes but show size-selective responses to light decrements (OFF), depolarizing to small and hyperpolarizing to large stimuli. The switch in polarity of OFF responses is caused by pre- and postsynaptic surround inhibition. VIP2- and VIP3-ACs both show small depolarizations to ON stimuli and large hyperpolarizations to OFF stimuli but differ in their spatial response profiles. Depolarizations are caused by ON excitation outweighing ON inhibition, whereas hyperpolarizations result from pre- and postsynaptic OFF-ON crossover inhibition. VIP1-, VIP2-, and VIP3-ACs thus differ in response polarity and spatial tuning and contribute to the diversity of inhibitory and neuromodulatory signals in the retina.

Keywords: VIP; amacrine cell; receptive field; retina.


Figures

Fig. 1.
Fig. 1.
Distribution of vasoactive intestinal polypeptide (VIP)-expressing amacrine cells (ACs) in the inner nuclear (INL) and ganglion cell layers (GCL). A and E: maximum intensity projections through the INL (A) and GCL (E) of a VIP-ires-Cre Ai9 (tdTomato shown in red) mouse stained for VIP (cyan). B and F: density of tdTomato-expressing cells in the dorsal and ventral INL (B; n = 4 retinae) and GCL (E; n = 6 retinae) of VIP-ires-Cre Ai9 retinae. C and G: density recovery profiles (DRPs) of tdTomato-expressing cells in the dorsal INL (C) and GCL (G). norm., Normalized. D and H: conditional probabilities of tdTomato-positive cells staining for VIP (left bars) in the INL (D; n = 16 retinae) and GCL (H; n = 8 retinae) and of VIP-positive cells expressing tdTomato (right bar) in the INL (D; n = 16 retinae). *P < 0.05 and ***P < 0.001.
Fig. 2.
Fig. 2.
Morphology of VIP1-, VIP2-, and VIP3-ACs. A, C, and E: maximum intensity projections of confocal image stacks of representative VIP1- (A), VIP2- (C), and VIP3-ACs (E) labeled by Brainbow adeno-associated virus injection in VIP-ires-Cre mice (A and C) and dye infusion during patch-clamp recording (E). Neurites in the ON (OFF) sublamina are shown in green (magenta). Insets show territories covered by the respective arbors (VIP1-AC: n = 5, VIP2-AC: n = 7, VIP3-AC: n = 9). Each dot represents data from 1 cell, whereas filled circles (error bars) indicate the means (± SE) of the respective population. B, D, and F: intensity distributions of labeled VIP1- (B), VIP2- (D), and VIP3-ACs (F) across the depth of the inner plexiform layer (IPL; 0% = INL; 100% = GCL) are shown alongside the distribution of choline acetyltransferase (ChAT) staining. Lines (shaded area) indicate means (± SE) of the respective populations.
Fig. 3.
Fig. 3.
Light responses and synaptic inputs of VIP1-ACs. A, D, and G: representative voltage (A), excitatory postsynaptic current (EPSC; D), and inhibitory postsynaptic current (IPSC; G) responses to light (100% contrast, ON, left column) and dark (−100% contrast, OFF, right column) circles of increasing size (diameter noted in A) presented for 500 ms from a gray background. Traces begin at stimulus onset. Vm, membrane potential; Exc, excitatory; Inh, inhibitory. B, E, and H: summary data of ON (○) and OFF (●) sensitivity profiles of VIP1-ACs for voltage (B; n = 10), excitatory (E; n = 15), and inhibitory (H; n = 11) responses. Responses of each cell were normalized to their maximum. Difference-of-Gaussian fits are shown as solid lines (Enroth-Cugell and Robson 1966). C, F, and I: amplitudes of ON (open bars) and OFF (filled bars) voltage (C), excitatory (F), and inhibitory (I) responses to circles with a diameter of 150 and 600 μm. Bars (error bars) indicate means (± SE) of respective populations. *P < 0.05, **P < 0.01, and ***P < 0.001.
Fig. 4.
Fig. 4.
Light responses and synaptic inputs of VIP2-ACs. A, D, and G: representative voltage (A), EPSC (D), and IPSC (G) traces recorded during presentation of light (100% contrast, ON, left column) and dark (−100% contrast, OFF, right column) circles of increasing size (diameter noted in A) presented for 500 ms from a gray background. Traces begin at stimulus onset. B, E, and H: summary data of ON (○) and OFF (●) sensitivity profiles of VIP2-ACs for voltage (B; n = 9), excitatory (E; n = 8), and inhibitory (H; n = 7) responses. Responses of each cell were normalized to their maximum. Difference-of-Gaussian fits are shown as solid lines. C, F, and I: amplitudes of ON (open bars) and OFF (filled bars) voltage (C), excitatory (F), and inhibitory (I) responses to circles with a diameter of 150 and 600 μm. Bars (error bars) indicate means (± SE) of respective populations. *P < 0.05, ** P < 0.01, and *** P < 0.001.
Fig. 5.
Fig. 5.
Light responses and synaptic inputs of VIP3-ACs. A, D, and G: representative voltage (A), EPSC (D), and IPSC (G) responses to light (100% contrast, ON, left column) and dark (−100% contrast, OFF, right column) circles of increasing size (diameter noted in A) presented for 500 ms from a gray background. Traces begin at stimulus onset. B, E, and H: summary data of ON (○) and OFF (●) sensitivity profiles of VIP3-ACs for voltage (B; n = 5), excitatory (E; n = 8), and inhibitory (H; n = 8) responses. Responses of each cell were normalized to their maximum. Difference-of-Gaussian fits are shown as solid lines. C, F, and I: amplitudes of ON (open bars) and OFF (filled bars) voltage (C), excitatory (F), and inhibitory (I) responses to circles with a diameter of 150 and 600 μm. Bars (error bars) indicate means (± SE) of respective populations. *P < 0.05 and **P < 0.01.

References

    1. Akrouh A, Kerschensteiner D. Intersecting circuits generate precisely patterned retinal waves. Neuron 79: 322–334, 2013. - PMC - PubMed
    1. Bagnoli P, Dal Monte M, Casini G. Expression of neuropeptides and their receptors in the developing retina of mammals. Histol Histopathol 18: 1219–1242, 2003. - PubMed
    1. Bleckert A, Schwartz GW, Turner MH, Rieke F, Wong RO. Visual space is represented by nonmatching topographies of distinct mouse retinal ganglion cell types. Curr Biol 24: 310–315, 2014. - PMC - PubMed
    1. Briggman KL, Helmstaedter M, Denk W. Wiring specificity in the direction-selectivity circuit of the retina. Nature 471: 183–188, 2011. - PubMed
    1. Bruun A, Ehinger B, Sytsma V, Tornqvist K. Retinal neuropeptides in the skates, Raja clavata, R. radiata, R. oscellata (Elasmobranchii). Cell Tissue Res 241: 17–24, 1985. - PubMed

Publication types

Substances

LinkOut - more resources