. 2015 Aug 27:6:8076.
doi: 10.1038/ncomms9076.

Optical control of NMDA receptors with a diffusible photoswitch

Affiliations

Optical control of NMDA receptors with a diffusible photoswitch

Laura Laprell et al. Nat Commun. .

Abstract

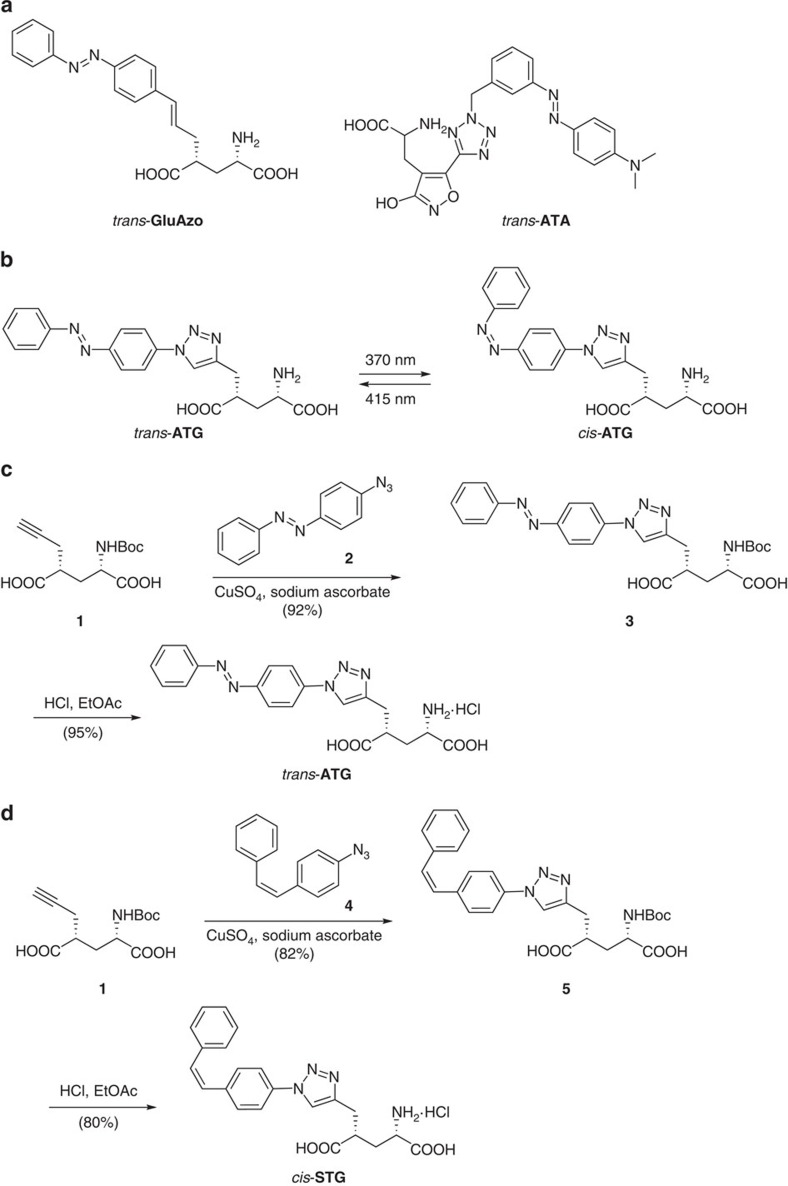
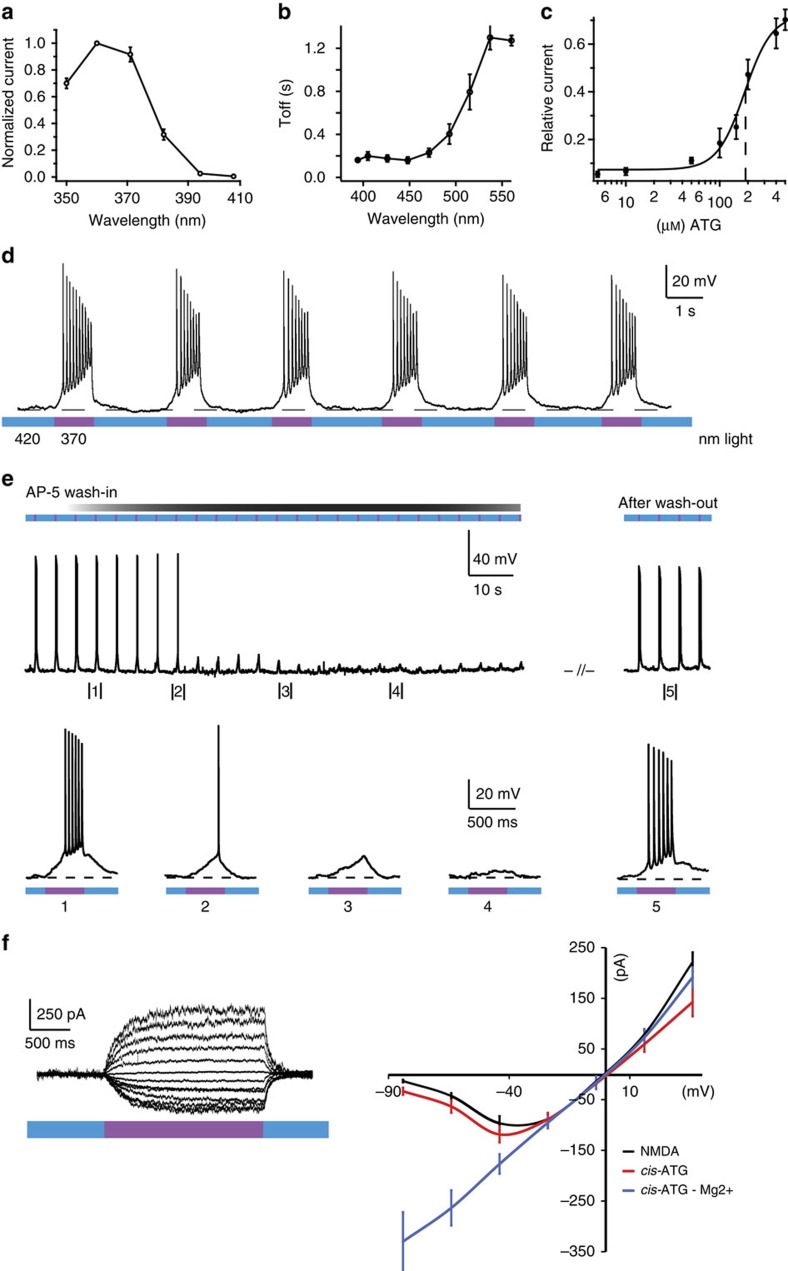
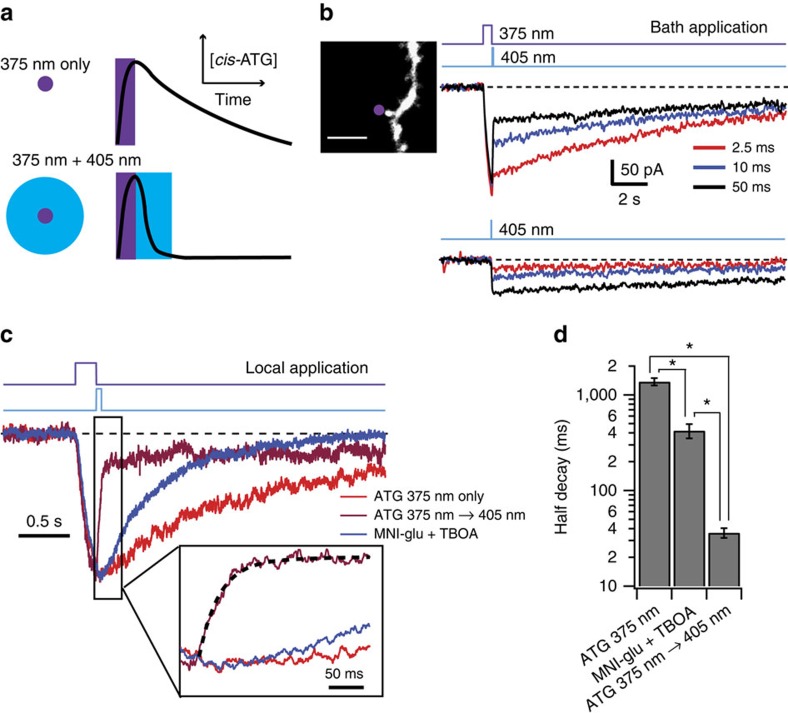
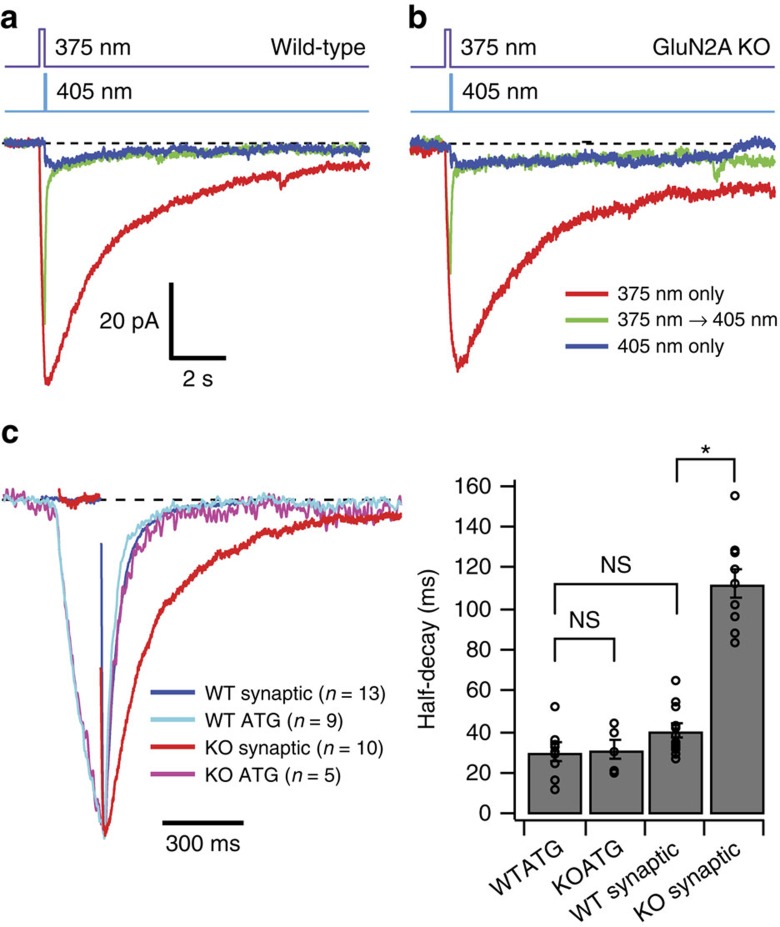
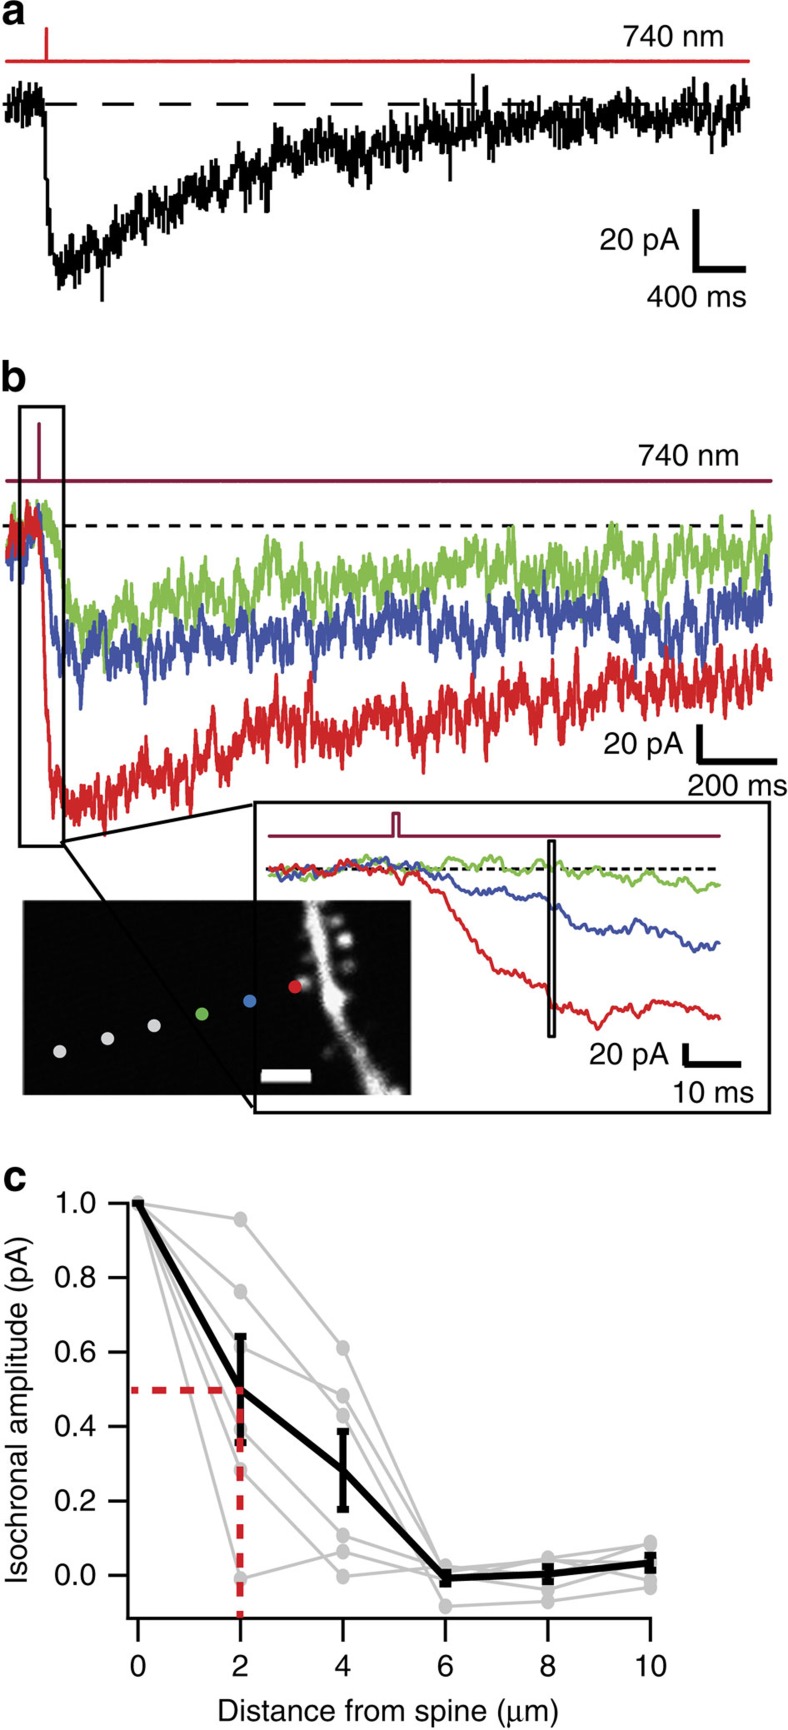
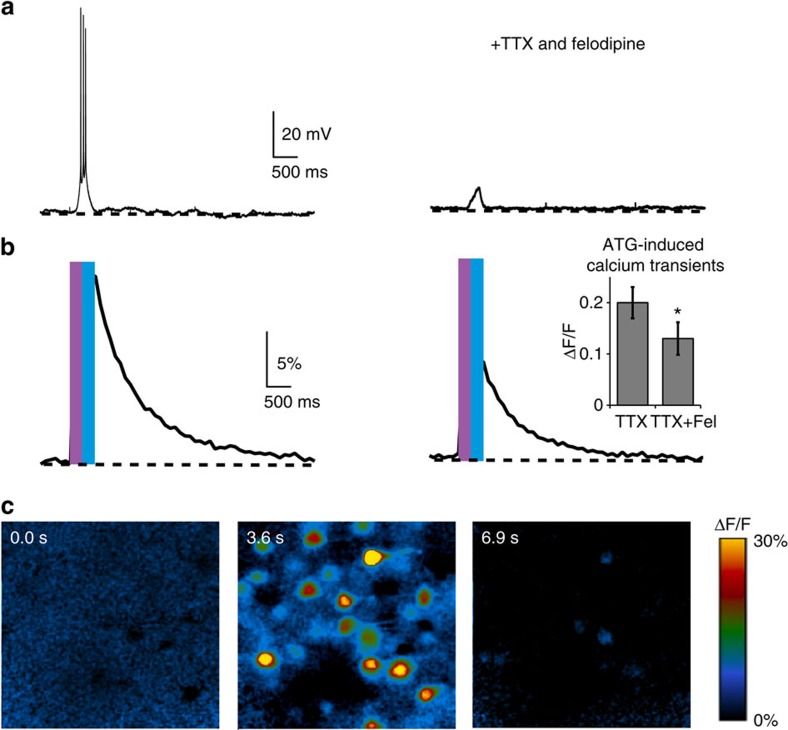
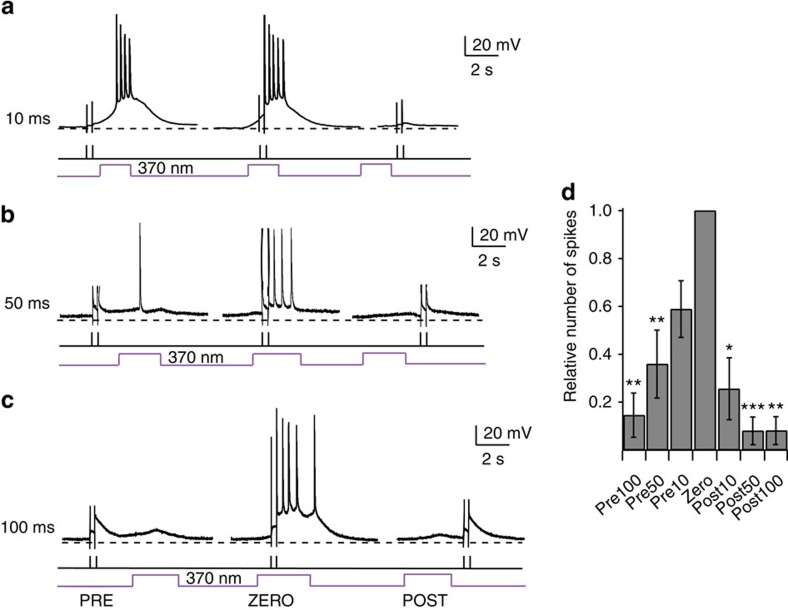
N-methyl-D-aspartate receptors (NMDARs) play a central role in synaptic plasticity, learning and memory, and are implicated in various neuronal disorders. We synthesized a diffusible photochromic glutamate analogue, azobenzene-triazole-glutamate (ATG), which is specific for NMDARs and functions as a photoswitchable agonist. ATG is inactive in its dark-adapted trans-isoform, but can be converted into its active cis-isoform using one-photon (near UV) or two-photon (740 nm) excitation. Irradiation with violet light photo-inactivates ATG within milliseconds, allowing agonist removal on the timescale of NMDAR deactivation. ATG is compatible with Ca(2+) imaging and can be used to optically mimic synaptic coincidence detection protocols. Thus, ATG can be used like traditional caged glutamate compounds, but with the added advantages of NMDAR specificity, low antagonism of GABAR-mediated currents, and precise temporal control of agonist delivery.


Figures

Figure 1
Figure 1. Design and synthesis of ATG.
(a) Structures of GluAzo, a photochromic agonist of kainate receptors, and ATA, a photochromic agonist of AMPA receptors in their respective trans isoform. (b) Structure and photophysical properties of ATG. The molecule consists of a photoswitchable azobenzene, a triazole and a glutamate moiety. The trans- and cis-configuration of ATG are shown. (c) Synthesis of the azobenzene ATG using click chemistry. (d) Synthesis of the stilbene cis-STG using click chemistry.
Figure 2
Figure 2. Photopharmacology of ATG.
(a) Action spectrum of ATG recorded in layer 2/3 cortical neurons in an acute slice preparation in presence of 200 μM ATG in ACSF. Current amplitude was measured after 5 s light stimulation with the respective wavelength and normalized to the maximal current amplitude at 360 nm. (b) Wavelength screening for τoff kinetics of ATG-mediated currents between 400 and 560 nm light. Best τoff kinetics were achieved at 400–450 nm light. (c) Dose–response relationship of ATG-mediated currents in cortical slice preparations. Concentrations from 1 to 500 μM were tested. The EC50 is 185 μM (black dashed line) and was calculated using the Hill-equation. (d) Current-clamp recording of a layer 2/3 cortical neuron. Irradiation with 370 nm light (purple) induces robust action potential firing that is terminated by irradiation with 420 nm light (blue). (e) Washing in D-AP-5 (40 μM), an NMDA-specific antagonist, blocks the ATG-mediated light-dependent action potential firing. (f) Current–voltage relationships indicative of NMDARs as targets for ATG. Black; current–voltage relationship of puff-applied NMDA (200 μM) currents (n=12 cells). Red; current–voltage relationship of ATG-mediated currents under 370 nm light (n=10 cells). Blue; current–voltage relationship of ATG-mediated currents in the absence of Mg2+ ions (n=10 cells). Error bars indicate s.e.m.
Figure 3
Figure 3. Dendritic NMDAR currents evoked by rapid laser-mediated photoswitching of ATG.
(a) Schematic diagram showing putative sculpting of NMDAR gating by ATG photoswitching. A near-diffraction-limited spot of 375 nm light switches ATG to an active cis-conformation (top) that can activate the NMDAR transiently. When the 375 nm laser light is followed quickly by a brief 405 nm laser pulse focused over a larger volume, ATG is converted to the inactive trans-conformation (bottom), eliminating cis-ATG-mediated current more quickly than via diffusional clearance of cis-ATG. (b) Upper traces show light-evoked NMDAR currents recorded in CA1 pyramidal neurons while bath applying 200 μM ATG, in response to a 500 ms 375 nm laser pulse immediately followed by various durations of 405 nm laser pulses. Lower traces show smaller currents evoked by 405 nm pulses alone. Inset: confocal image of dendrite stimulated in these recordings. Purple dot indicates targeted point of ATG stimulation. Scale bar 3 μm (c) Normalized population averages of NMDAR currents evoked by 375 nm laser pulse (100 ms) alone (red; n=9 cells), or 375nm followed by 405 nm laser pulse (50 ms; magenta; n=9 cells) when locally applying ATG (100 μM) with a patch pipette. Blue trace represents uncaging-evoked NMDAR responses when locally applying MNI-glutamate (100 μM; n=5 cells). Dotted line on the magenta trace in the inset indicates the double exponential decay function. (d) Bar graph shows half-decay of NMDAR currents from cells in c. Error bars indicate s.e.m. *P<0.05 for all three comparisons (Steel Dwass all pairs nonparametric multiple comparison test).
Figure 4
Figure 4. Comparison of ATG photoswitching responses between wild-type and GluN2A KO animals.
(a) Population averages of light-evoked currents from WT CA1 pyramidal cells in response to 375 nm (100 ms) only, 375 nm followed by 405 nm (50 ms), and 405 nm only when locally applying ATG (100 μM) with a patch pipette (n=9 cells). (b) Population averages of photoswitching currents from GluN2A KO animals under same conditions as (a) (n=5 cells). (c) (left) Normalized currents in response to 375–405 nm photoswitching from (a) and (b) and population averages of NMDAR EPSCs in wild-type (n=13 cells) and KO animals (n=10 cells). Traces were aligned on their peaks and electrical artifacts from presynaptic stimulation have been blanked. Right: Bar graph of half-decays. Error bars indicate s.e.m. *P<0.05 and NS indicates comparisons that are not significantly different (Steel Dwass all pairs nonparametric multiple comparison test).
Figure 5
Figure 5. Localized two-photon activation of ATG.
(a) Cis-ATG-mediated current evoked by two-photon illumination (1 ms, 740 nm) in a CA1 pyramidal cell while bath applying 400 μM ATG. (b) 2P-evoked cis-ATG-mediated currents with illumination spot parked at 0.5, 2 and 4 μm away from spine head. Illumination duration was 1 ms, and the wavelength set at 740 nm. (inset) Enlarged view of distance-dependent ATG evoked responses. Box over traces illustrates the time window over which spatial dependence was estimated for isochronal amplitude plots in (c) (Scale bar 2 μm). This was chosen to correspond to the time point at which the largest current reached 75% of its amplitude. (c) Normalized isochronal plots for six cells, with the average in black (half-width half-maximum=2.0 μm, red dotted lines). Error bars indicate s.e.m.
Figure 6
Figure 6. Calcium imaging using ATG in acute hippocampal slices.
(a) Cis-ATG-mediated (200 μM) electrical signals in ACSF (left) and in the presence of 40 μM felodipine (Fel) and 1 μM TTX (right), elicited with 370 nm light and terminated with 420 nm (250 ms light pulse for each wavelength). (b) Calcium transients from responsive cells in the field of view corresponding to cis-ATG-mediated recording presented in (a). Bar graph: quantification of calcium transients (ATG+TTX: n=18 experiments and ATG+TTX+felodipine: n=10 experiments). *P<0.05, Wilcoxon rank-sum test. Error bars indicate s.e.m. (c) Changes in fluorescence (ΔF/F) at different time points of the calcium transient; prior to light stimulation, immediately after illumination and after returning to basal calcium levels.
Figure 7
Figure 7. Coincidence detection using ATG in layer 2/3 cortical neurons.
Coincidence detection of cis-ATG mediated current (200 μM) paired with antidromic stimulation. (a) Antidromic stimulation (black bars) of the postsynaptic cell 10 ms before, during and 10 ms after the light stimulation (purple trace). (b) As in (a), but with 50 ms intervals. (c) As in (a), but with 100 ms intervals. (d) Quantification of coincidence detection. Relative number of spikes compared with condition ZERO, when both stimuli were applied together (n=11 cells). Statistics were calculated using the Wilcoxon rank-sum test (*P<0.05,**P<0.01, ***P<0.001).

References

    1. Paoletti P., Bellone C. & Zhou Q. NMDA receptor subunit diversity: impact on receptor properties, synaptic plasticity and disease. Nat. Rev. Neurosci. 14, 383–400 (2013) . - PubMed
    1. Karakas E. & Furukawa H. Crystal structure of a heterotetrameric NMDA receptor ion channel. Science 344, 992–997 (2014) . - PMC - PubMed
    1. Lee C. H. et al. NMDA receptor structures reveal subunit arrangement and pore architecture. Nature 511, 191–197 (2014) . - PMC - PubMed
    1. Tovar K. R., McGinley M. J. & Westbrook G. L. Triheteromeric NMDA receptors at hippocampal synapses. J. Neurosci. 33, 9150–9160 (2013) . - PMC - PubMed
    1. Lester R. A., Clements J. D., Westbrook G. L. & Jahr C. E. Channel kinetics determine the time course of NMDA receptor-mediated synaptic currents. Nature 346, 565–567 (1990) . - PubMed

Publication types