

E2F1 controls germ cell apoptosis during the first wave of spermatogenesis
- PMID: 26311345
- PMCID: PMC5042044
- DOI: 10.1111/andr.12090
E2F1 controls germ cell apoptosis during the first wave of spermatogenesis
Abstract
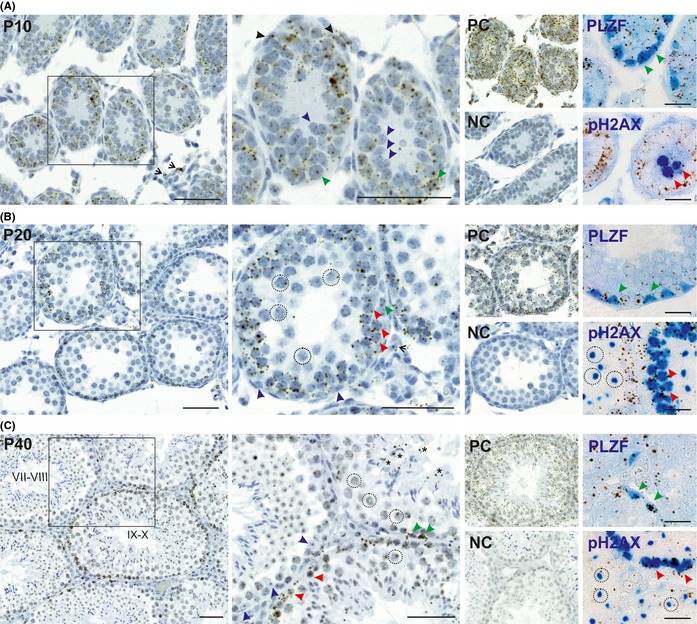
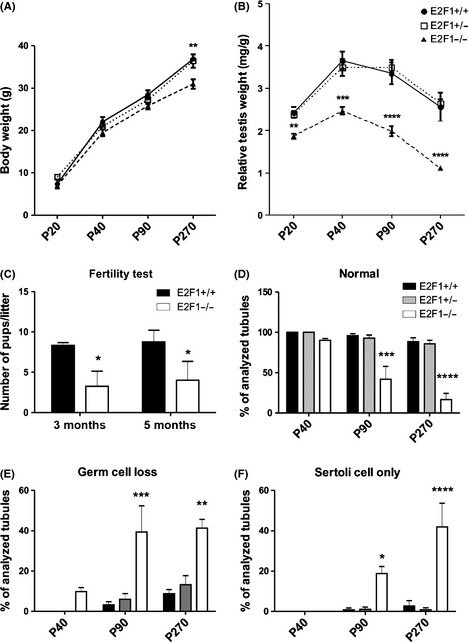
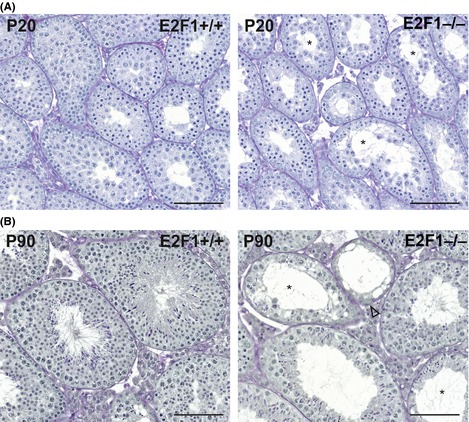
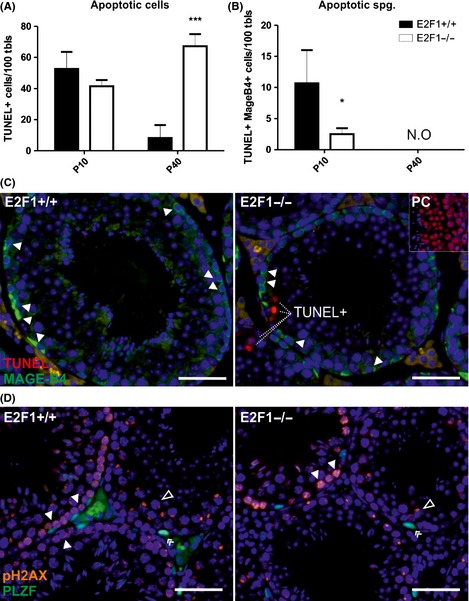
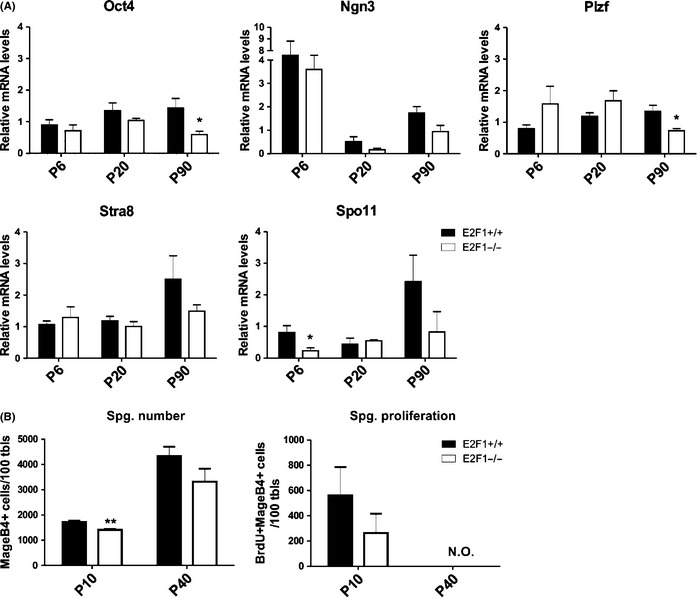
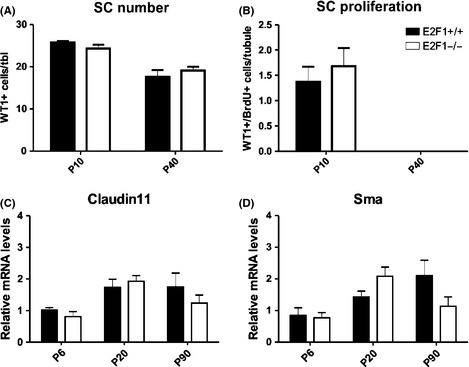
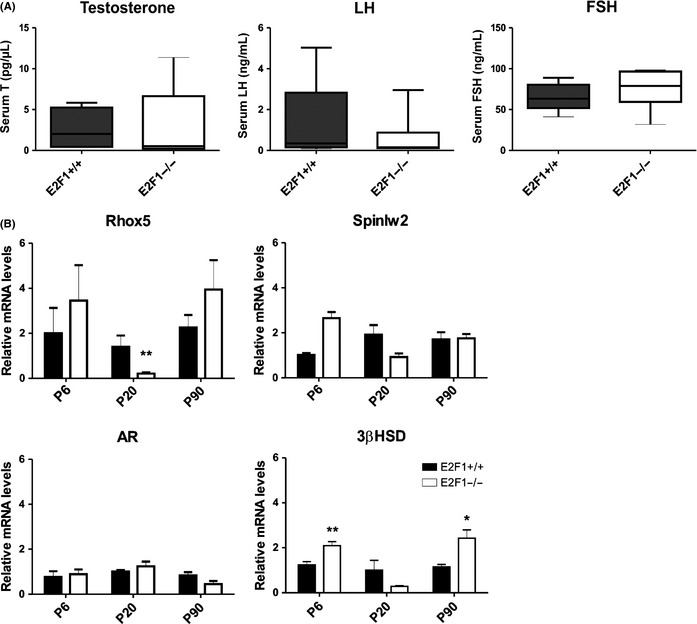
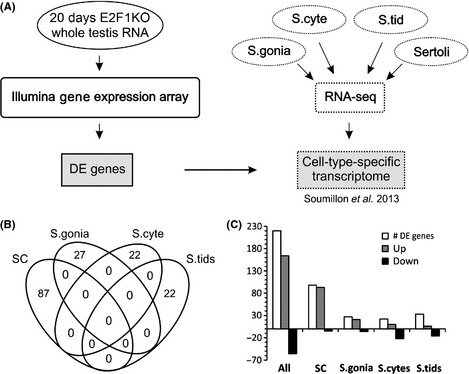
Cell cycle control during spermatogenesis is a highly complex process owing to the control of the mitotic expansion of the spermatogonial cell population and following meiosis, induction of DNA breaks during meiosis and the high levels of physiological germ-cell apoptosis. We set out to study how E2F1, a key controller of cell cycle, apoptosis, and DNA damage responses, functions in the developing and adult testis. We first analyzed the expression pattern of E2f1 during post-natal testis development using RNA in situ hybridization, which showed a differential expression pattern of E2f1 in the adult and juvenile mouse testes. To study the function of E2f1, we took advantage of the E2F1(-/-) mouse line, which was back-crossed to C57Bl/6J genetic background. E2f1 loss led to a severe progressive testicular atrophy beginning at the age of 20 days. Spermatogonial apoptosis during the first wave of spermatogenesis was decreased. However, already in the first wave of spermatogenesis an extensive apoptosis of spermatocytes was observed. In the adult E2F1(-/-) testes, the atrophy due to loss of spermatocytes was further exacerbated by loss of spermatogonial stem cells. Surprisingly, only subtle changes in global gene expression array profiling were observed in E2F1(-/-) testis at PND20. To dissect the changes in each testicular cell type, an additional comparative analysis of the array data was performed making use of previously published data on transcriptomes of the individual testicular cell types. Taken together, our data indicate that E2F1 has a differential role during first wave of spermatogenesis and in the adult testis, which emphasizes the complex nature of cell cycle control in the developing testis.
Keywords: E2F1; apoptosis; cell cycle; testis.
© 2015 The Authors. Andrology published by John Wiley & Sons Ltd on behalf of American Society of Andrology and European Academy of Andrology.
Figures
Similar articles
-
Bcl-w forms complexes with Bax and Bak, and elevated ratios of Bax/Bcl-w and Bak/Bcl-w correspond to spermatogonial and spermatocyte apoptosis in the testis.Mol Endocrinol. 2000 May;14(5):682-99. doi: 10.1210/mend.14.5.0443. Mol Endocrinol. 2000. PMID: 10809232
-
Reciprocal localization of transcription factors YY1 and CP2c in spermatogonial stem cells and their putative roles during spermatogenesis.Acta Histochem. 2016 Sep;118(7):685-692. doi: 10.1016/j.acthis.2016.08.005. Epub 2016 Sep 6. Acta Histochem. 2016. PMID: 27612612
-
Conditional ablation of DIS3L2 ribonuclease in pre-meiotic germ cells causes defective spermatogenesis and infertility in male mice.Theranostics. 2024 Sep 3;14(14):5621-5642. doi: 10.7150/thno.98620. eCollection 2024. Theranostics. 2024. PMID: 39310107 Free PMC article.
-
Surfing the wave, cycle, life history, and genes/proteins expressed by testicular germ cells. Part 1: background to spermatogenesis, spermatogonia, and spermatocytes.Microsc Res Tech. 2010 Apr;73(4):241-78. doi: 10.1002/jemt.20783. Microsc Res Tech. 2010. PMID: 19941293 Review.
-
Stem cells in the testis.Int J Exp Pathol. 1998 Apr;79(2):67-80. doi: 10.1046/j.1365-2613.1998.00057.x. Int J Exp Pathol. 1998. PMID: 9709376 Free PMC article. Review.
Cited by
-
E2F1 regulates testicular descent and controls spermatogenesis by influencing WNT4 signaling.Development. 2021 Jan 13;148(1):dev191189. doi: 10.1242/dev.191189. Development. 2021. PMID: 33441379 Free PMC article.
-
The histone H3 lysine 36 demethylase KDM2A/FBXL11 controls Polycomb-mediated gene repression and germ cell development in male mice.Nat Commun. 2025 Jul 23;16(1):6803. doi: 10.1038/s41467-025-61733-x. Nat Commun. 2025. PMID: 40701999 Free PMC article.
-
Phosphoribosyl-pyrophosphate synthetase 2 (PRPS2) depletion regulates spermatogenic cell apoptosis and is correlated with hypospermatogenesis.Asian J Androl. 2020 Sep-Oct;22(5):493-499. doi: 10.4103/aja.aja_122_19. Asian J Androl. 2020. PMID: 31736475 Free PMC article.
-
Single-Cell RNA Sequencing of Human, Macaque, and Mouse Testes Uncovers Conserved and Divergent Features of Mammalian Spermatogenesis.Dev Cell. 2020 Aug 24;54(4):529-547.e12. doi: 10.1016/j.devcel.2020.05.010. Epub 2020 Jun 5. Dev Cell. 2020. PMID: 32504559 Free PMC article.
-
Genetic mechanisms underlying spermatic and testicular traits within and among cattle breeds: systematic review and prioritization of GWAS results.J Anim Sci. 2018 Dec 3;96(12):4978-4999. doi: 10.1093/jas/sky382. J Anim Sci. 2018. PMID: 30304443 Free PMC article.
References
-
- Agger K, Santoni‐Rugiu E, Holmberg C, Karlstrom O & Helin K. (2005) Conditional E2F1 activation in transgenic mice causes testicular atrophy and dysplasia mimicking human CIS. Oncogene 24, 780–789. - PubMed
-
- Ashburner M, Ball CA, Blake JA, Botstein D, Butler H, Cherry JM, Davis AP, Dolinski K, Dwight SS, Eppig JT, Harris MA, Hill DP, Issel‐Tarver L, Kasarskis A, Lewis S, Matese JC, Richardson JE, Ringwald M, Rubin GM, Sherlock G. (2000) Gene ontology: tool for the unification of biology. The Gene Ontology Consortium. Nat Genet 25, 25–29. - PMC - PubMed
-
- Baudat F, Manova K, Yuen JP, Jasin M & Keeney S. (2000) Chromosome synapsis defects and sexually dimorphic meiotic progression in mice lacking Spo11. Mol Cell 6, 989–998. - PubMed
-
- Berkovich E & Ginsberg D. (2003) ATM is a target for positive regulation by E2F‐1. Oncogene 22, 161–167. - PubMed
Publication types
MeSH terms
Substances
LinkOut - more resources
Full Text Sources
Other Literature Sources
Medical
Molecular Biology Databases
