. 2015 Oct 1;126(14):1683-94.
doi: 10.1182/blood-2015-05-646398. Epub 2015 Aug 26.

MLL leukemia induction by genome editing of human CD34+ hematopoietic cells

Affiliations

MLL leukemia induction by genome editing of human CD34+ hematopoietic cells

Corina Buechele et al. Blood. .

Abstract

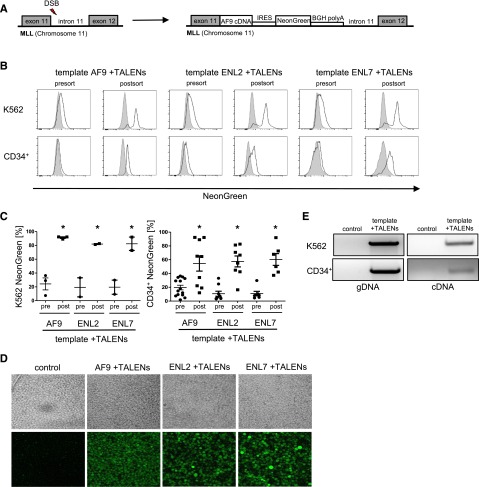
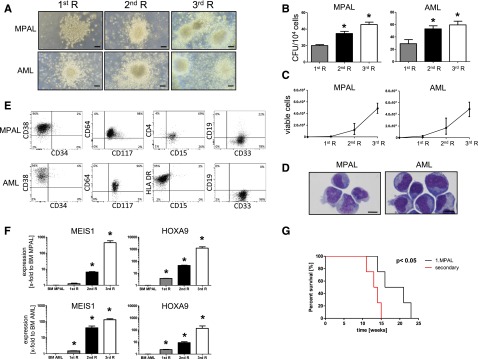
Chromosomal rearrangements involving the mixed-lineage leukemia (MLL) gene occur in primary and treatment-related leukemias and confer a poor prognosis. Studies based primarily on mouse models have substantially advanced our understanding of MLL leukemia pathogenesis, but often use supraphysiological oncogene expression with uncertain implications for human leukemia. Genome editing using site-specific nucleases provides a powerful new technology for gene modification to potentially model human disease, however, this approach has not been used to re-create acute leukemia in human cells of origin comparable to disease observed in patients. We applied transcription activator-like effector nuclease-mediated genome editing to generate endogenous MLL-AF9 and MLL-ENL oncogenes through insertional mutagenesis in primary human hematopoietic stem and progenitor cells (HSPCs) derived from human umbilical cord blood. Engineered HSPCs displayed altered in vitro growth potentials and induced acute leukemias following transplantation in immunocompromised mice at a mean latency of 16 weeks. The leukemias displayed phenotypic and morphologic similarities with patient leukemia blasts including a subset with mixed phenotype, a distinctive feature seen in clinical disease. The leukemic blasts expressed an MLL-associated transcriptional program with elevated levels of crucial MLL target genes, displayed heightened sensitivity to DOT1L inhibition, and demonstrated increased oncogenic potential ex vivo and in secondary transplant assays. Thus, genome editing to create endogenous MLL oncogenes in primary human HSPCs faithfully models acute MLL-rearranged leukemia and provides an experimental platform for prospective studies of leukemia initiation and stem cell biology in a genetic subtype of poor prognosis leukemia.


Figures

Figure 1
Figure 1
TALENs induce specific DNA DSBs within the MLL gene. (A) Schematic illustration of the human MLL gene shows recognition sites (bold sequences) for TALEN pairs designed to cleave within the 5′ portion of MLL intron 11. Black boxes represent respective exons of the MLL gene. (B) Gel image shows results of the T7 endonuclease assay performed on gDNA isolated from K562 or CD34+ cells nucleofected with the 3 different MLL TALEN pairs (P1, P2, P3) or control (GFP) as indicated. Digested PCR products (*) of the MLL locus represent the presence of strand mismatches resulting from indels that are generated during nonhomologous end joining (NHEJ) repair of DSBs. (C) DNA sequences of the amplified endogenous MLL locus resulting from the best TALEN pair (P3) show unique insertions or deletions resulting from NHEJ (K562 24 of 70: 34.3%; CD34+ 11 of 70: 15.7% mutation ratio). Italic letters represent insertions; underlined letters denote TALEN binding sites; red and blue text indicates MLL exon 11 and MLL intron 11, respectively. (D) Indel frequencies were measured by TIDE and compared with indel frequencies of the control sample. eff., efficiency.
Figure 2
Figure 2
Generation of MLL-AF9 and MLL-ENL knock-in genes by genome engineering. (A) Schematic illustration of experimental strategy to induce a DSB by TALENs followed by integration of the knock-in template in the MLL gene locus by homology-directed repair (HDR). (B) FACS profiles show fluorescence of K562 and CD34+ cells nucleofected with the knock-in template alone (gray line) or in combination with the MLL TALENs (black line) sorted on days 5 and 3, respectively. (C) Summary of NeonGreen expression in K562 (n[AF9] = 3, n [ENL2/7] = 2) and CD34+ cells (n[AF9] = 11, n[ENL2] = 7, n[ENL7] = 5) pre- and postsort. *P < .05 was considered statistically significant. Error bars indicate standard error of the mean (SEM). (D) Confocal microscopy images show NeonGreen expression in sorted K562 and control cells as indicated. Top row, cell density (brightfield); bottom row, NeonGreen expression detected by GFP excitation (450-490 nm) and ×10 objective. (E) PCR/RT-PCR was performed on gDNA and cDNA isolated from NeonGreen-positive K562 and CD34+ cells to detect integration and transcription of the construct under control of the endogenous MLL promoter (representative results shown for MLL-AF9). BGH, bovine growth hormone.
Figure 3
Figure 3
Induction of acute leukemias following transplantation of human CD34+ cells containing knock-in MLL oncogenes. (A) Experimental scheme depicts nucleofection of CD34+ cells and their subsequent transplantation directly into sublethally irradiated NSG recipient mice or culture for 3 weeks in vitro prior to transplantation. (B) Kaplan-Meier plot is shown for cohorts of mice transplanted with CD34+ cells transfected with templates plus TALENs (n [AF9] = 25: direct inject = 19, cultured cells = 6; n [ENL2] = 7: direct inject = 5, cultured cells = 2; n [ENL7] = 8: direct inject = 5, cultured cells = 3) or template alone (control, n = 7). P < .05 was considered statistically significant. Mice were sacrificed upon signs of illness. (C) Flow cytometry profiles show representative phenotypes of various leukemias that developed in mice transplanted with CD34+ cells (n = 17) compared with blasts from patients with MLL translocations (AML/ALL), which display comparable phenotypes. Also shown are representative profiles of BM cells from control mice (n = 2) that received CD34+ cells nucleofected with knock-in construct alone (week 16 posttransplantation) and representative analysis of knock-in cells 3 weeks after cell culture prior to transplantation. l, lymphoid; m, myeloid; (Pat.), patient.
Figure 4
Figure 4
Pathologic and molecular features of acute leukemias induced by genome editing of the MLL oncogene. (A) Plots show results of hematologic analyses performed on control (n = 7) and leukemic mice (n = 16), respectively. (B) Representative peripheral blood smears of control and leukemic mice are shown and summarized by calculating the percentage of blast cells (n = 16). Scale bars define 10 µm. (C) Spleen size and weight are shown for 1 representative control and leukemic mice (n = 17). (D) Hematoxylin-and-eosin–stained paraffin sections demonstrate disruption of organ architecture due to tumor infiltration compared with control mice. Scale bars define 100 µm. (E) PCR/RT-PCR was performed on gDNA and cDNA of leukemia cells to detect integration and expression of the MLL oncogenes and WT MLL gene. (F) Representative western blot analysis shows WT MLLN and MLL-AF9 expression in control (CD34+ cells nucleofected with template alone) and explanted blast cells from xenotransplants induced by either retroviral transduction or under the expression of the endogenous promoter (MPAL, AML). Glyceraldehyde-3-phosphate dehydrogenase (GAPDH), loading control. Bottom, relative MLL-AF9 band intensities compared with WT MLLN. (G) Representative qPCR analyses show elevated expression levels of MLL target genes compared with non-MLL leukemic cell lines or controls (human BM or BM CD10+/−/CD19+) but similar to cell lines and patients with MLL translocations. Representative results from 8 independent experiments are shown. (H) Unsupervised hierarchical cluster analysis of 3 leukemic mice (ALL) and 70 MLL-rearranged ALL patients showing similar gene expression profiling in contrast to control samples. Each dot (A-C) represents a mouse; horizontal bars represent the mean. *P < .05 was considered statistically significant. Error bars indicate SEM. HGB, hemoglobin; PB, peripheral blood; PLT, platelet; WBC, white blood cell.
Figure 5
Figure 5
Immortalization ex vivo and increased oncogenic potential through CFC assays of MLL edited acute leukemia cells. CFC assays were performed to assess the replating efficiency of leukemic cells ex vivo in semisolid medium. Scale bars define 100 µm. (A) Images show representative morphologies of compact colonies displaying increased density after each replating. (B) Bar graph represents the mean number of colonies generated per 104 seeded cells. (C) Plot indicates cell numbers after each replating. Pooled data from 3 independent experiments. (D) Representative morphologies and phenotypes (E) are shown for colony-forming cells. Scale bar defines 10 µm. (F) Representative qPCR analyses of MLL target genes show increasing levels after each replating in CFC assays. Results from 1 of 3 independent experiments performed in triplicate. (G) Kaplan-Meier plot is shown for each cohort of animals (direct inject = 4 and secondary inject = 4). *P < .05 was considered statistically significant. Error bars indicate SEM. CFU, colony-forming unit; R, round.
Figure 6
Figure 6
Edited leukemia cells display increased sensitivity to DOT1L inhibition. (A) Bar graph represents the mean number of colonies generated per 5000 or 104 seeded cells after 12 to 14 days in the presence of increasing concentrations of EPZ004777 or vehicle (DMSO). Data from 4 (MPAL) and 3 (AML) independent experiments performed in duplicate were pooled together (IC50 values: MV4-11, 10 nM; MPAL/AML, 51/11 nM; K562, >50 µM). (B) Images show representative morphologies of colonies displaying decreased density after drug treatment. Scale bars define 100 µm. (C) MV4-11 and leukemic cells (n [MPAL] = 4; n [AML] = 3) were analyzed by flow cytometry for cell surface expression of CD14 after incubation with 10 µM EPZ04777 (black line) or DMSO (gray line) in CFC assays. (D) Representative qPCR analyses of MLL target genes show decreasing levels relative to DMSO treatment. Shown are representative data from 1 of 4 (MPAL) and 3 (AML) independent experiments. *P < .05 was considered statistically significant. Error bars indicate SEM.

References

    1. Daser A, Rabbitts TH. Extending the repertoire of the mixed-lineage leukemia gene MLL in leukemogenesis. Genes Dev. 2004;18(9):965–974. - PubMed
    1. Dimartino JF, Cleary ML. Mll rearrangements in haematological malignancies: lessons from clinical and biological studies. Br J Haematol. 1999;106(3):614–626. - PubMed
    1. De Braekeleer M, Morel F, Le Bris MJ, Herry A, Douet-Guilbert N. The MLL gene and translocations involving chromosomal band 11q23 in acute leukemia. Anticancer Res. 2005;25(3B):1931–1944. - PubMed
    1. Rubnitz JE, Onciu M, Pounds S, et al. Acute mixed lineage leukemia in children: the experience of St Jude Children’s Research Hospital. Blood. 2009;113(21):5083–5089. - PMC - PubMed
    1. Cancer Genome Atlas Research Network. Genomic and epigenomic landscapes of adult de novo acute myeloid leukemia [published correction appears in N Engl J Med. 2013;369(1):98]. N Engl J Med. 2013;368(22):2059–2074. - PMC - PubMed

Publication types

MeSH terms

Substances