. 2016 Jan;19(1):91-107.
doi: 10.1007/s10071-015-0915-8. Epub 2015 Aug 27.

Rats (Rattus norvegicus) flexibly retrieve objects' non-spatial and spatial information from their visuospatial working memory: effects of integrated and separate processing of these features in a missing-object recognition task

Affiliations

Rats (Rattus norvegicus) flexibly retrieve objects' non-spatial and spatial information from their visuospatial working memory: effects of integrated and separate processing of these features in a missing-object recognition task

Corrine Keshen et al. Anim Cogn. 2016 Jan.

Abstract

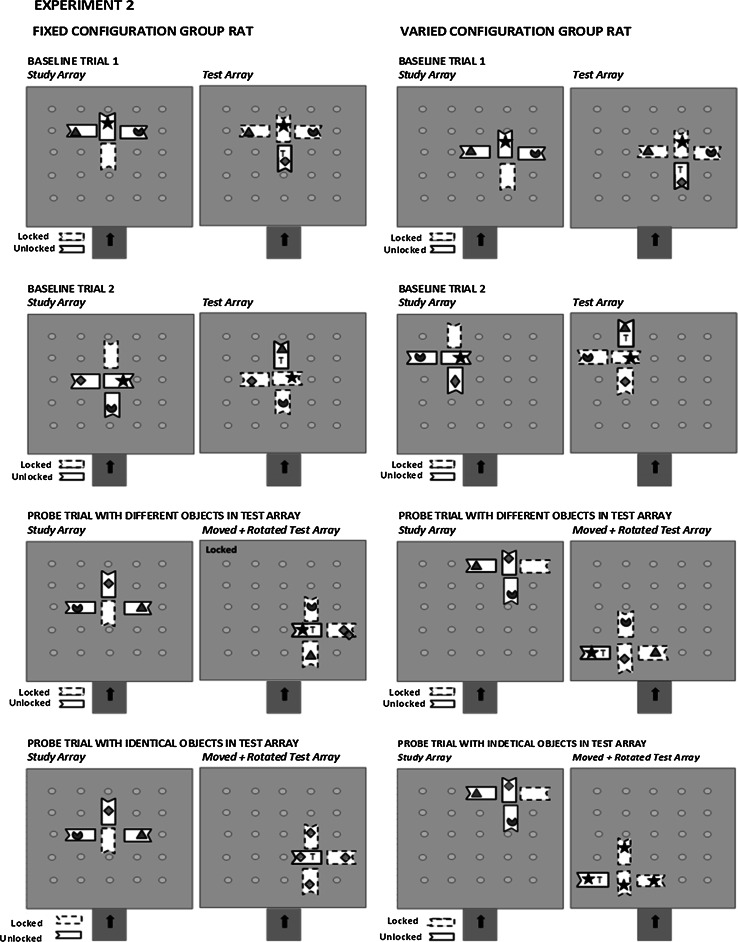
After being trained to find a previous missing object within an array of four different objects, rats received occasional probe trials with such test arrays rotated from that of their respective three-object study arrays. Only animals exposed to each object's non-spatial features consistently paired with both its spatial features (feeder's relative orientation and direction) in the first experiment or with only feeder's relative orientation in the second experiment (Fixed Configuration groups) were adversely affected by probe trial test array rotations. This effect, however, was less persistent for this group in the second experiment but re-emerged when objects' non-spatial features were later rendered uninformative. Animals that had both types of each object's features randomly paired over trials but not between a trial's study and test array (Varied Configuration groups) were not adversely affected on probe trials but improved their missing-object recognition in the first experiment. These findings suggest that the Fixed Configuration groups had integrated each object's non-spatial with both (in Experiment 1) or one (in Experiment 2) of its spatial features to construct a single representation that they could not easily compare to any object in a rotated probe test array. The Varied Configuration groups must maintain separate representations of each object's features to solve this task. This prevented them from exhibiting such adverse effects on rotated probe trial test arrays but enhanced the rats' missing-object recognition in the first experiment. We discussed how rats' flexible use (retrieval) of encoded information from their visuospatial working memory corresponds to that of humans' visuospatial memory in object change detection and complex object recognition tasks. We also discussed how foraging-specific factors may have influenced each group's performance in this task.

Keywords: Object recognition; Rat spatial cognition; Working memory.


Figures

Fig. 1
Fig. 1
Five types of objects and the four different array shapes of oriented feeding stations shown in the foraging arena. Feeding stations are the type used in the first experiment (see text for description of modifications made to feeding stations in the second experiment)
Fig. 2
Fig. 2
Examples of two training or baseline trials and a probe trial with their respective three-object study and four-object test arrays for an illustrative rat in each group in the first experiment. The target (T) icon in the test array represents the missing target object from that trial’s study array. In each group’s rats, only the probe trial’s test array is rotated from the orientation of its study array. The relative position of each object (icon) within each trial’s study and test array is fixed for a Fixed Configuration group rat and varied over trials but not within any trial for a Varied Configuration group rat. The location of a trial’s study and test arrays only changed over trials in the Varied Configuration group’s rat. Any feeder depicted by an unbroken border is baited, but any feeder depicted by a dashed border is un-baited. The indented portion of the rectangular feeder represents the front of the food well cover from where the rat had to push to uncover its food well as shown in Fig. 1. The sequence of the two training and a probe trial does not represent the actual sequence of a baseline and probe trials within a two-trial session nor are examples of a probe trial’s two other test array rotations shown in this figure (see text for further description)
Fig. 3
Fig. 3
Examples of two training or baseline trials and two types of probe trials with their respective three-object study and four-object test arrays for an illustrative rat in each group in the second experiment. The target (T) icon in the test array represents the missing target object from a training/baseline trial and the first probe trial’s study array, but in the second probe trial, it represents a previously objectless target feeder in a test array with identical objects that may be either replicates of the missing object or of one of the three previously presented objects (see text for further details). The relative position of each object (icon) within each trial’s study and test array is fixed for a Fixed Configuration group rat and varied over but not within trials for a Varied Configuration group rat. The orientation of each array of feeders is rotated over but not within training/baseline trials for a rat in the Fixed Configuration group and in the Varied Configuration group. The array locations also change over trials but not within trials only for the Varied Configuration group’s rat. Any feeder depicted by an unbroken border has its food well cover unlocked, but any feeder depicted by a dashed border has its food well cover locked. The indented portion of the rectangular feeder represents the front of the food well cover from where the rat had to push to uncover its food well as shown in Fig. 1. The sequence of the two training and a probe trial does not represent the actual sequence of a baseline and probe trial within a two-trial session nor are the all three types of probe trial test array changes shown in this figure (see text for further details)
Fig. 4
Fig. 4
Mean proportion of trials each configuration group found a previously missing object on a first choice and by a second choice on its first 12 training trials (left panel) and last 12 training trials (right panel) in the first experiment (upper graph) and second experiment (lower graph). The vertical error bars represent ±SEM, and the horizontal line in each graph represents chance performance. Group data summary bars with heavy borders are for data significantly (p < .05) above chance performance. Symbols above a pair of Fixed and Varied Configuration group bars reflect a difference at or below the following probabilities: *p < .05; ρ = .065
Fig. 5
Fig. 5
Mean proportion of trials each configuration group found a missing object on a probe (Pr) trial test array and its accompanying baseline (BL) trial test array on a first choice and by a second choice in the first experiment (upper graph) and in the second experiment (middle and bottom graphs). The vertical error bars represent ±SEM, and the horizontal line in each graph represents chance performance. Group data summary bars with heavy borders are for data significantly (p < .05) above chance performance. Symbols above any pair of Fixed and Varied Configuration group bars reflect a difference at or below the following probabilities: *p < .05; **≤.01
Fig. 6
Fig. 6
Mean proportion of trials each configuration group in the second experiment found a probe trial’s rotated test array’s missing object (Pr—red bars) or in a test array with identical objects (Pr—orange bars) and on each of its accompanying baseline (BL) trial test array on the first three blocks and the fourth block of trials, respectively, on a first choice (upper graph) and by a second choice (lower graph). The vertical error bars represent ±SEM, and the horizontal line in each graph represents chance performance. Group data summary bars with heavy borders are for data significantly (p < .05) above chance performance. Symbols above any pair of Fixed and Varied Configuration group bars reflect a difference at or below the following probabilities: *p < .05; **≤ .0 1

Similar articles

Cited by

References

    1. Alvarez GA, Cavanagh P. The capacity of visual short-term memory is set both by visual information load and by number of objects. Psychol Sci. 2004;15:106–111. doi: 10.1111/j.0963-7214.2004.01502006.x. - DOI - PubMed
    1. Arain M, Cohen J. Hierarchical use of cues in the missing object recognition task by rats (Rattus norvegicus) Behav Proc. 2013;97:41–52. doi: 10.1016/j.beproc.2013.04.007. - DOI - PubMed
    1. Arain M, Parameswaran V, Cohen J. Changing within-trial array location and target object position enhances rats’ (Rattus norvegicus) missing object recognition accuracy. Anim Cogn. 2012;15:771–782. doi: 10.1007/s10071-012-0501-2. - DOI - PubMed
    1. Benhamou S. Place navigation in mammals: a configuration-based model. Anim Cogn. 1998;1:55–63. doi: 10.1007/s100710050007. - DOI
    1. Benhamou S, Poucet B. A comparative analysis of spatial memory processes. Behav Proc. 1996;35:113–126. doi: 10.1016/0376-6357(95)00060-7. - DOI - PubMed

Publication types

LinkOut - more resources