. 2015 Oct;201(2):707-25.
doi: 10.1534/genetics.115.178962. Epub 2015 Aug 25.

A Coalescent Model for a Sweep of a Unique Standing Variant

Affiliations

A Coalescent Model for a Sweep of a Unique Standing Variant

Jeremy J Berg et al. Genetics. 2015 Oct.

Abstract

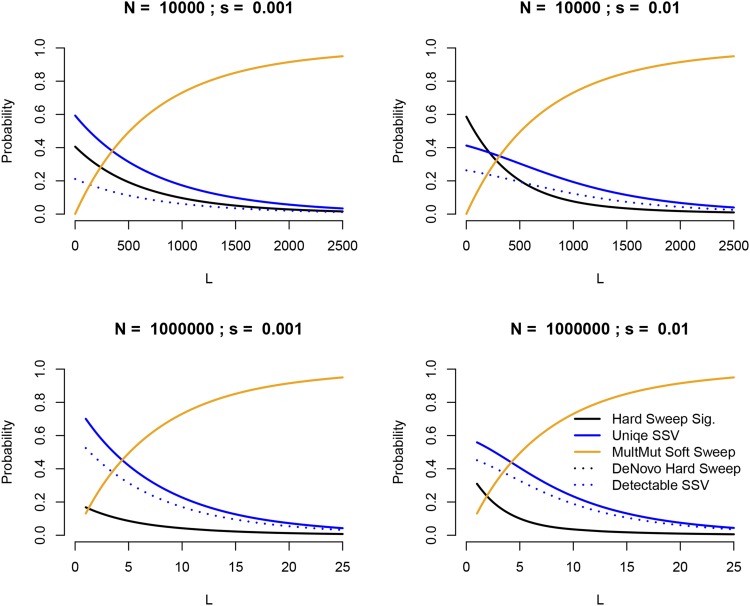
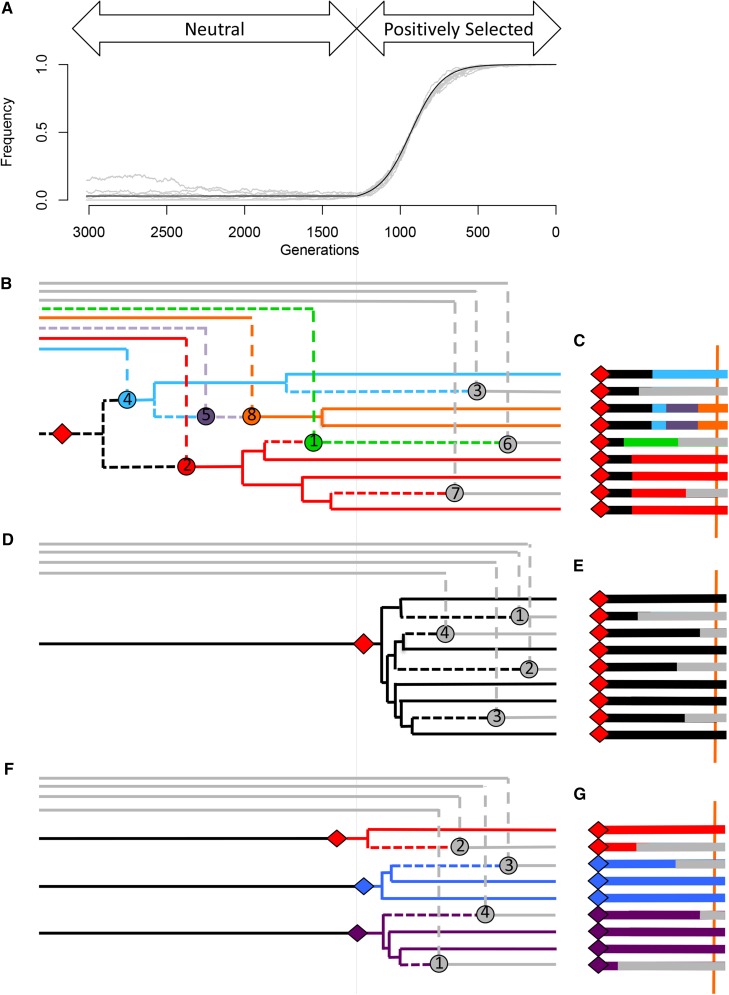
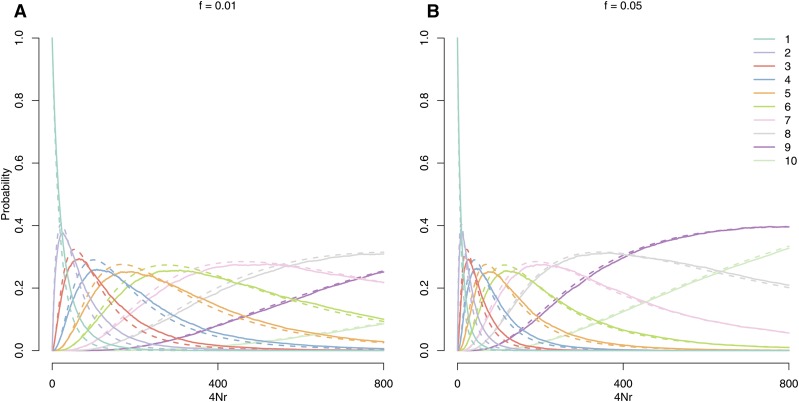
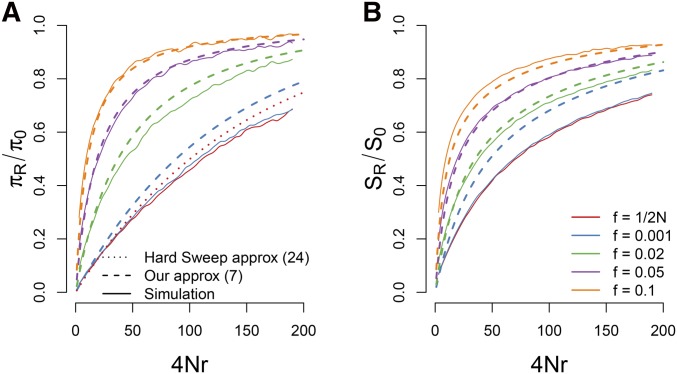
The use of genetic polymorphism data to understand the dynamics of adaptation and identify the loci that are involved has become a major pursuit of modern evolutionary genetics. In addition to the classical "hard sweep" hitchhiking model, recent research has drawn attention to the fact that the dynamics of adaptation can play out in a variety of different ways and that the specific signatures left behind in population genetic data may depend somewhat strongly on these dynamics. One particular model for which a large number of empirical examples are already known is that in which a single derived mutation arises and drifts to some low frequency before an environmental change causes the allele to become beneficial and sweeps to fixation. Here, we pursue an analytical investigation of this model, bolstered and extended via simulation study. We use coalescent theory to develop an analytical approximation for the effect of a sweep from standing variation on the genealogy at the locus of the selected allele and sites tightly linked to it. We show that the distribution of haplotypes that the selected allele is present on at the time of the environmental change can be approximated by considering recombinant haplotypes as alleles in the infinite-alleles model. We show that this approximation can be leveraged to make accurate predictions regarding patterns of genetic polymorphism following such a sweep. We then use simulations to highlight which sources of haplotypic information are likely to be most useful in distinguishing this model from neutrality, as well as from other sweep models, such as the classic hard sweep and multiple-mutation soft sweeps. We find that in general, adaptation from a unique standing variant will likely be difficult to detect on the basis of genetic polymorphism data from a single population time point alone, and when it can be detected, it will be difficult to distinguish from other varieties of selective sweeps. Samples from multiple populations and/or time points have the potential to ease this difficulty.

Keywords: coalescent theory; genetic hitchhiking; natural selection; soft sweep; standing variation.


Figures

Figure 1
Figure 1
The probability of observing a number of different sweep signatures in a sample of 20 chromosomes, assuming a model in which an allele that was previously neutral suddenly becomes beneficial in response to an environmental change. Calculations are given in the Appendix. Results are displayed for a range of population sizes (N), selection coefficients (s), and mutational target sizes (L) and assuming 1000 generations since the environmental change. In general, we see that selective sweeps in which adaptation proceeds from a uniquely derived allele represent a nontrivial proportion of all sweeps under this model, provided that the mutational target size is not large and that Ns is not too small. A hard sweep signature is left by any sweep for which a single allele sweeps from a frequency of <1/2Ns, while a unique sweep from standing variation (SSV) corresponds to any sweep in which a single allele sweeps from a frequency greater than this value. Multiple-mutation soft sweeps refer to the variety described in Pennings and Hermisson (2006a,b). De novo hard sweep refers to sweeps in which the beneficial allele did not arise until after the environmental change (corresponding to the model originally studied by Maynard Smith and Haigh 1974), while detectable SSVs are sweeps of a single unique allele that was present at a frequency 1/2Ns<f<0.15 and may therefore plausibly be distinguished from both the hard sweep model and the neutral model.
Figure 2
Figure 2
A schematic depiction of our model along with two other common sweep models. (A) The frequency trajectory of alleles in the sweep from the standing variation model. Gray lines depict 10 simulated sweeps with s=0.01 and f=0.03 in a population of N=10,000. The solid black line represents the frequency trajectory assumed for our analytical calculations for a sweep with those parameters. (B and C) The genealogy, history of recombination events, and sequence associated with a sample of nine chromosomes taken at the moment of fixation under the sweep from standing variation model. The red diamond (on both the genealogy and the sequence) represents the mutation responsible for the beneficial allele. The tree subtending this mutation in B is the genealogy at the locus of this mutation. Solid lines represent the genealogy experienced by a neutral site located at the position of the vertical orange bar in C, with lineages that escape coalescence under the red mutation coalescing on a longer timescale off the left side. Circles on the genealogy in B represent the recombination events falling between the beneficial mutation and the orange bar in C and are responsible for changes in haplotype identity (color) along the sequence. Short dashed lines represent components of the ancestral recombination graph between the red mutation and the orange bar that are not a part of the local genealogy at the position of the orange bar. Long dashed lines represent movement from the selected to the nonselected background via recombination. At the distance marked by the orange bar, there are three sweep phase recombinants, and the remaining six sequences are partitioned into three haplotypes of frequencies three, two, and one, according to the infinite-alleles process described in the main text. (D and E) Genealogy, recombination history, and sequence associated with a standard hard sweep. Here, the beneficial mutation generally occurs after the onset of positive selection, and most recombination events occur as singletons during the middle of the sweep. The sweep signature therefore consists chiefly of a single core haplotype that is slowly whittled down by singleton recombinants. (F and G) Genealogy, recombination history, and sequence associated with a multiple-mutation soft sweep. Here, the beneficial mutations all generally occur around the time of the onset of position selection, creating multiple core haplotypes, which are each subsequently whittled down by recombination events during the course of the sweep.
Figure 3
Figure 3
The probability that a sample of 10 lineages taken on the background of an allele at frequency 1% (A) or 5% (B) coalesce into k families before exiting the background, as a function of population-scaled genetic distance (4Nr) from the conditioned site. The effective population size in the simulations is N=10,000. The solid lines give the proportion of 1000 coalescent simulations, with an explicit stochastic frequency trajectory (as described in Simulation details), in which k families of lineages recombined off of the sweep at distance 4Nr. The dotted lines give our approximation under the ESF (Equation 4) with Rf=4Nrf(1f).
Figure 4
Figure 4
A comparison of our approximations for the reduction in (A) pairwise diversity and (B) the number of segregating sites for a sweep with s=0.05 and N=10,000 starting from a variety of different frequencies. For pairwise diversity we also include the hard sweep approximation given in Equation A1. Our approximations are generally accurate as long as the sweep begins from a frequency >1/2Ns.
Figure 5
Figure 5
The frequency spectrum, in a sample of n=10 in a population of N=10,000. In A–C, we take a sample on the background of a focal allele at the end of the standing phase, but before the sweep phase. In D–F, we take a sample from the full population immediately after fixation of the beneficial allele. Results are shown as the log ratio of the normalized frequency relative to its expectation under the standard neutral coalescent. s = 0.05 for the postfixation case. Solid circles give simulations, while solid lines give the theoretical result of Equation A6.
Figure 6
Figure 6
The ratio of the probability that there are at least i haplotypes in a one-sided window extending away from the selected site for the standing sweep model relative to the hard sweep model (left) and the neutral model (right). For all simulations n=100, N=10,000, and we simulate a chromosomal segment with total length 4Nr=200 divided into 500,000 discrete loci, with 4Nμ=200 for the whole segment. Probabilities are calculated using the basis of 5000 simulations under each model.
Figure 7
Figure 7
The ratio of expected sample frequency of the ith most common haplotype, conditional the haplotype existing in our sample, between two different models M1 and M2, i.e., E[hiM1|hiM1>0]/E[hiM2|hiM2>0].. This is shown as a function of the recombination distance from the selected site. Green indicates that the frequency of the ith most common haplotype is similar in the two models, blue that it has lower frequency under model M1, and red that it has lower frequency in M2. We simulated coalescent histories for a sample size of n=100 chromosomes under four different models of sequence evolution, hard sweeps, standing sweeps from f=0.05, soft sweeps conditional on three origins of the beneficial mutation, and a neutral model, with all sweep simulations using a selection coefficient of s=0.01. For all simulations N=10,000, and we simulate a chromosomal segment with total length 4Nr=200 divided into 500,000 discrete loci, with 4Nμ=200 for the whole segment. Expectations are taken over 5000 simulations of each model.

References

    1. Anderson, J. T., C.-R. Lee, C. A. Rushworth, R. I. Colautti, and T. Mitchell-Olds, 2013. Genetic trade-offs and conditional neutrality contribute to local adaptation. Mol. Ecol. 22(3): 699–708. - PMC - PubMed
    1. Andolfatto P., 2007. Hitchhiking effects of recurrent beneficial amino acid substitutions in the Drosophila melanogaster genome. Genome Res. 17(12): 1755–1762. - PMC - PubMed
    1. Bank C., Ewing G. B., Ferrer-Admettla A., Foll M., Jensen J. D., 2014. Thinking too positive? Revisiting current methods of population genetic selection inference. Trends Genet. 30(12): 540–546. - PubMed
    1. Barrett R. D. H., Schluter D., 2008. Adaptation from standing genetic variation. Trends Ecol. Evol. 23(1): 38–44. - PubMed
    1. Barton N. H., 1998. The effect of hitch-hiking on neutral genealogies. Genet. Res. 72: 123–133.

Publication types