. 2015 Aug 27:6:8100.
doi: 10.1038/ncomms9100.

PAQR3 modulates cholesterol homeostasis by anchoring Scap/SREBP complex to the Golgi apparatus

Affiliations

PAQR3 modulates cholesterol homeostasis by anchoring Scap/SREBP complex to the Golgi apparatus

Daqian Xu et al. Nat Commun. .

Abstract

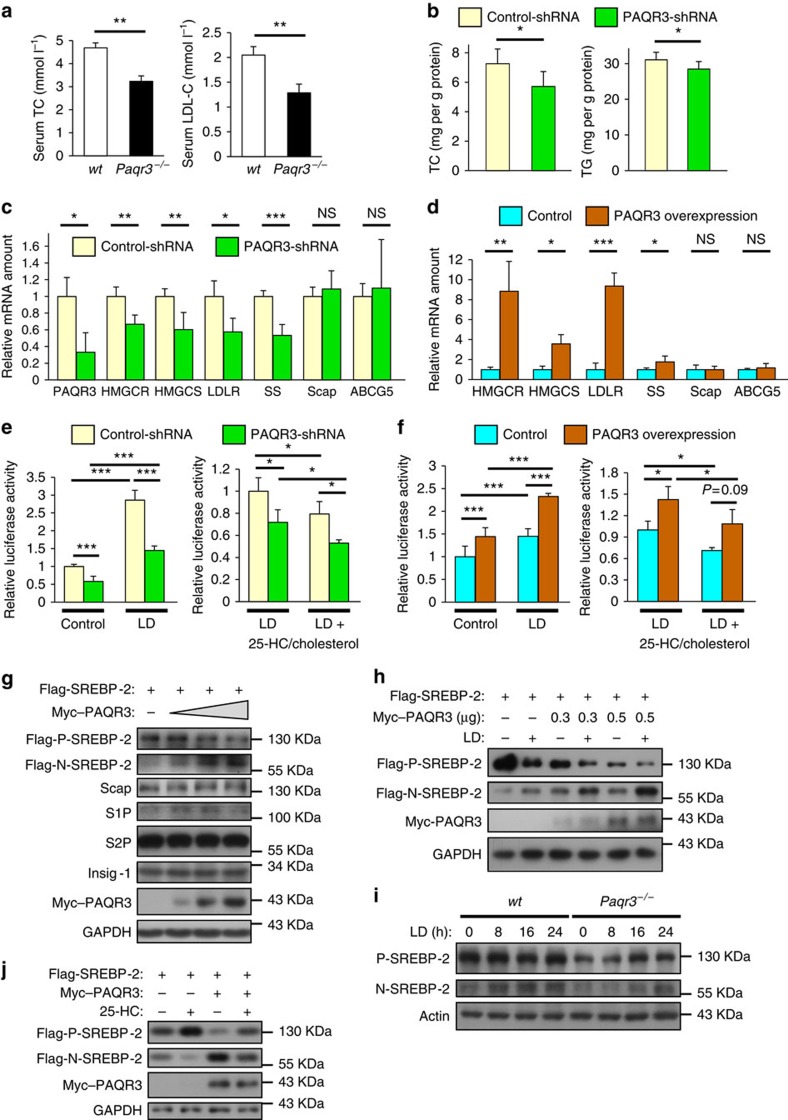
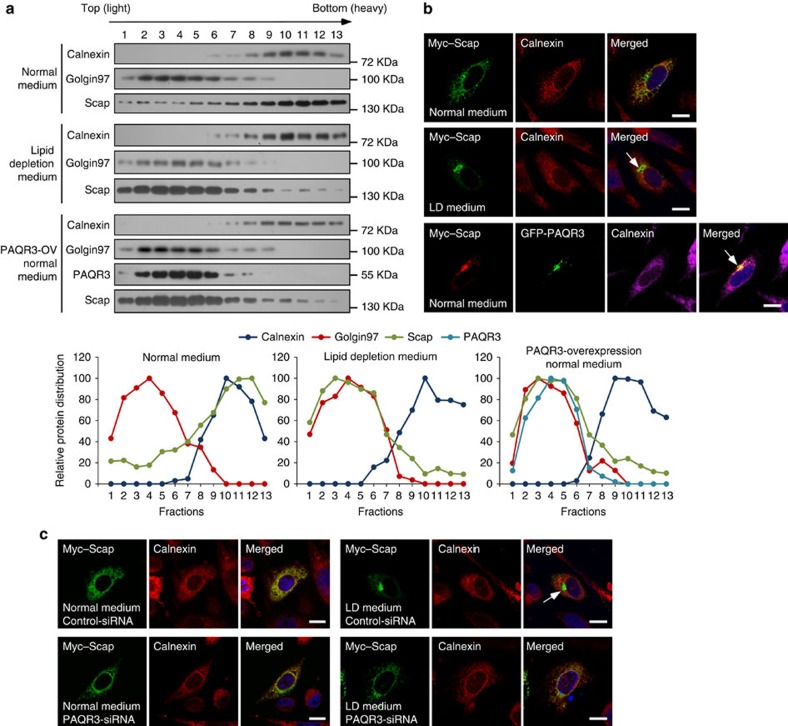
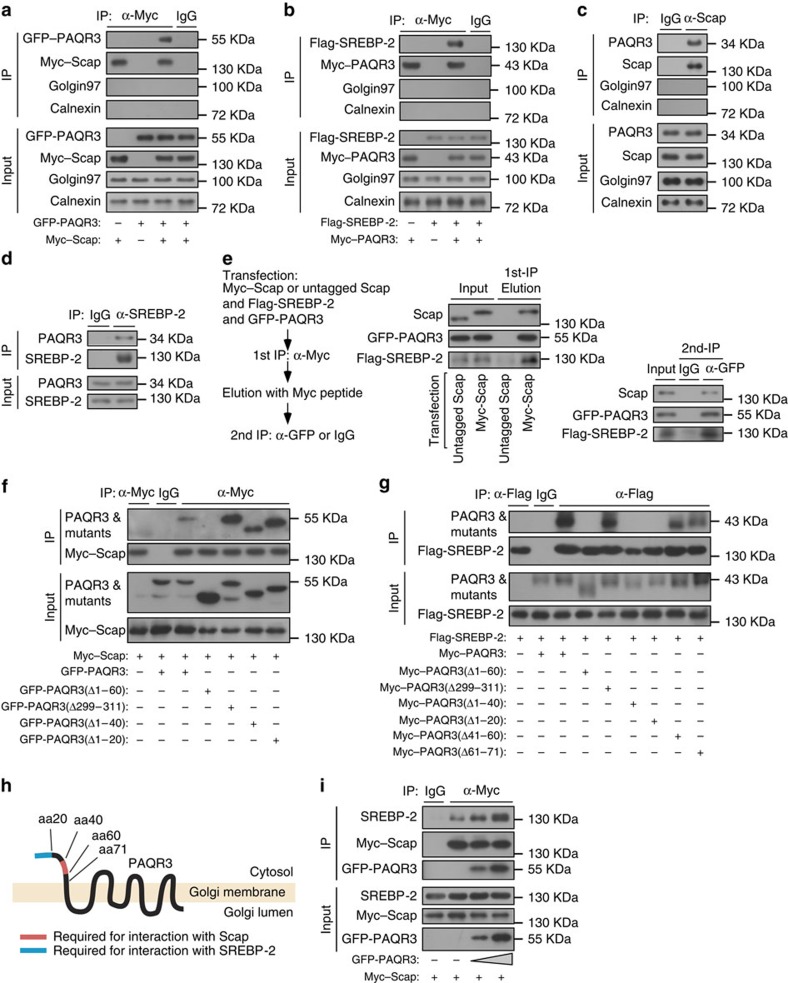
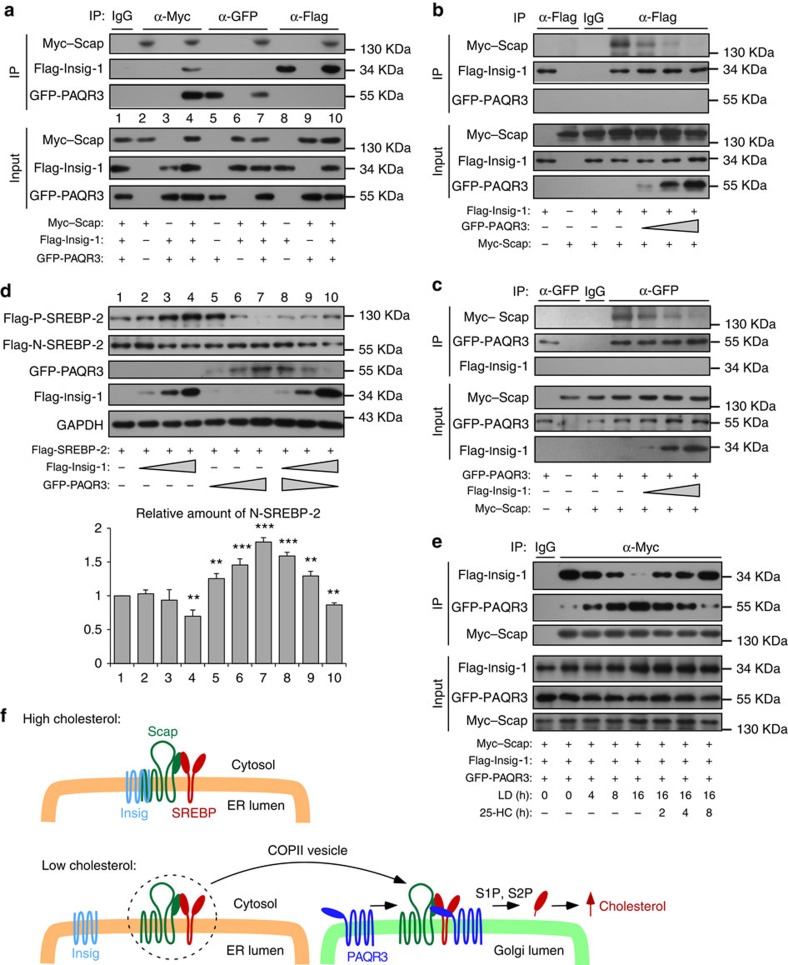
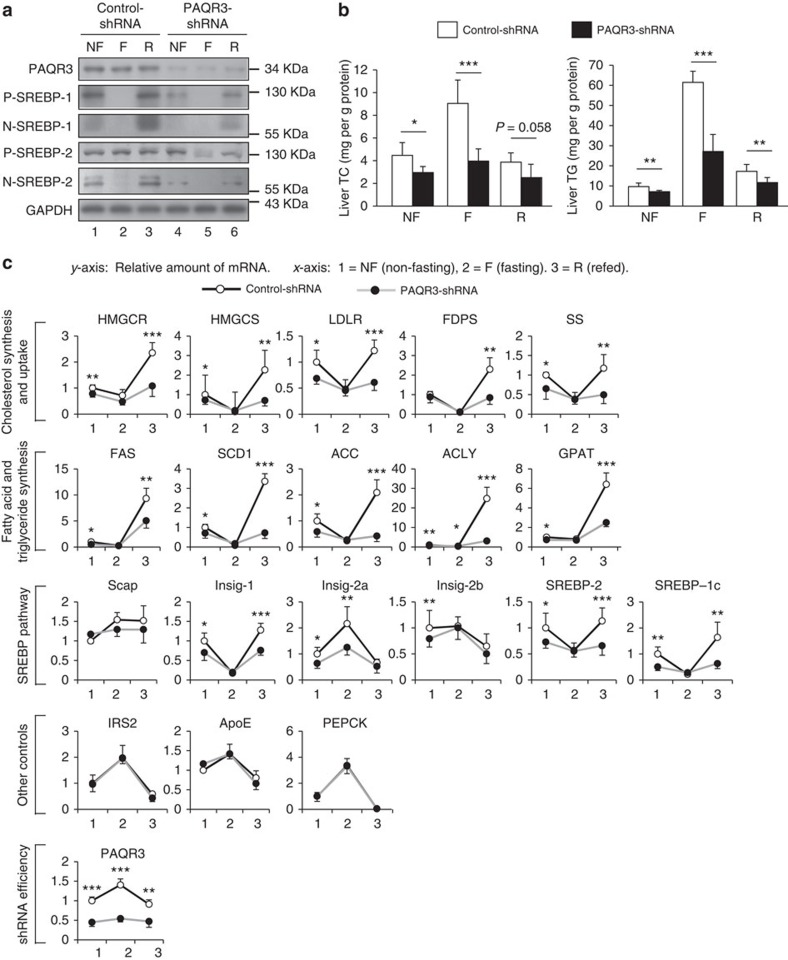
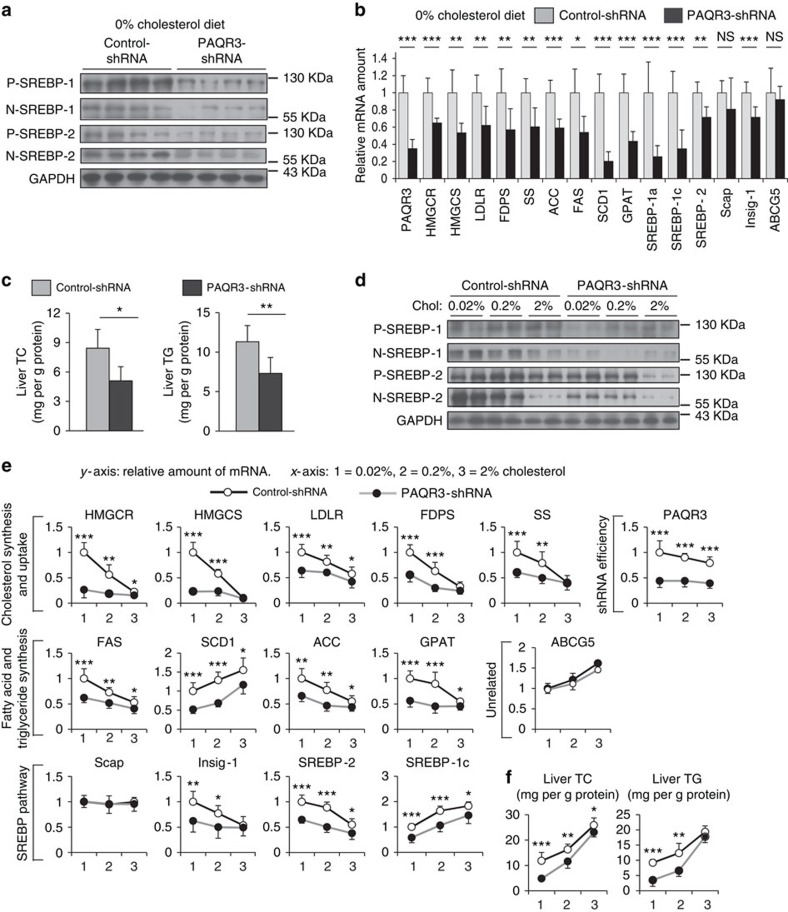
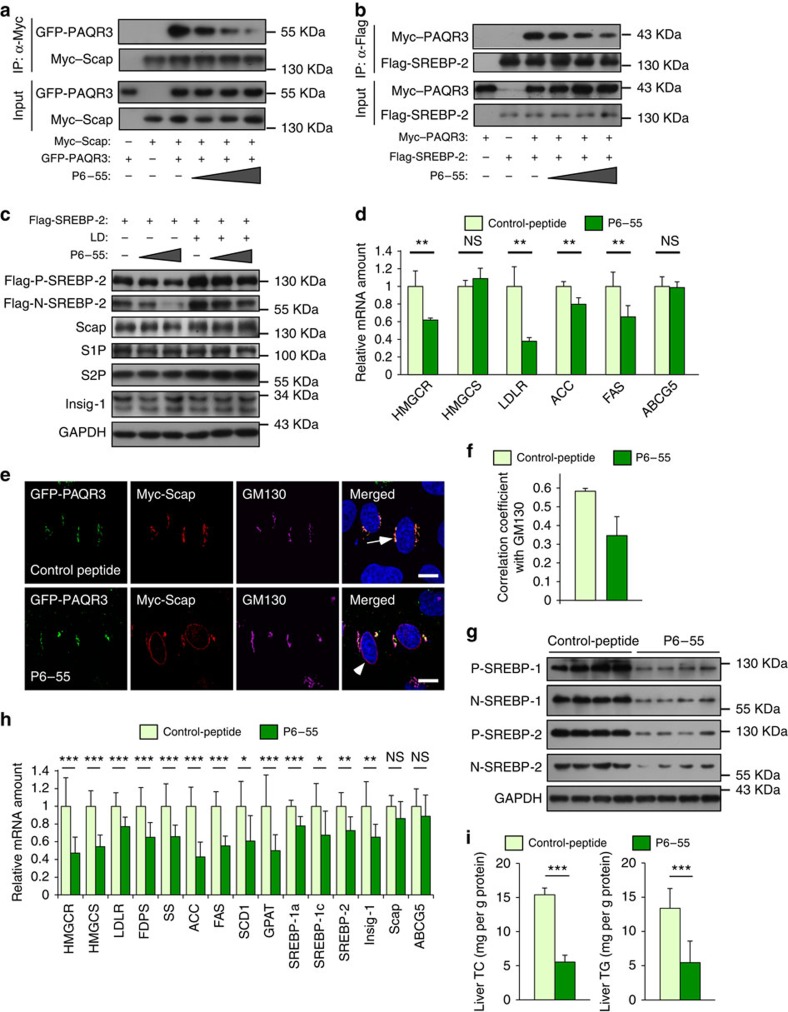
Cholesterol biosynthesis is regulated by transcription factors SREBPs and their escort protein Scap. On sterol depletion, Scap/SREBP complex is transported from endoplasmic reticulum (ER) to the Golgi apparatus where SREBP is activated. Under cholesterol sufficient condition, Insigs act as anchor proteins to retain Scap/SREBP in the ER. However, the anchor protein of Scap/SREBP in the Golgi is unknown. Here we report that a Golgi-localized membrane protein progestin and adipoQ receptors 3 (PAQR3) interacts with Scap and SREBP and tethers them to the Golgi. PAQR3 promotes Scap/SREBP complex formation, potentiates SREBP processing and enhances lipid synthesis. The mutually exclusive interaction between Scap and PAQR3 or Insig-1 is regulated by cholesterol level. PAQR3 knockdown in liver blunts SREBP pathway and decreases hepatic cholesterol content. Disrupting the interaction of PAQR3 with Scap/SREBP by a synthetic peptide inhibits SREBP processing and activation. Thus, PAQR3 regulates cholesterol homeostasis by anchoring Scap/SREBP to the Golgi and disruption of such function reduces cholesterol biosynthesis.


Figures

Figure 1
Figure 1. PAQR3 modulates SREBP activation and cholesterol biosynthesis.
(a) Serum levels of total cholesterol (TC) and LDL-C measured in wild-type (wt, n=15) or PAQR3 deletion (Paqr3−/−, n=13) mice fed with high fat diet for 16 weeks.(b) Cellular TC and TG contents measured in primary hepatocyte infected with control-shRNA or PAQR3-shRNA adenoviruses. (c) Gene expression levels measured by reverse transcription–PCR (RT–PCR) in primary hepatocytes infected with control-shRNA or PAQR3-shRNA adenoviruses in normal medium. (d) Gene expression levels measured by RT–PCR in HepG2 cells transfected with control or PAQR3-overexpression plasmids in normal medium. (e,f) Huh7 cells were transiently transfected with the plasmids as indicated together with β-galactosidase and SRE-containing luciferase reporter. Luciferase activities were determined under lipid-loaded medium (control), lipid depletion medium (LD) with or without 25-HC/cholesterol replenishment after normalization to β-galactosidase activities. (g,h) Western blot analysis of CHO-7 cells transfected with the plasmids as indicated. Cells were cultured in normal medium (g) or LD medium (h). (j) Western blot analysis of CHO-7 cells transfected with the plasmids as indicated. Cells were cultured in LD medium for 16 h and then with or without 25-HC replenishment for 6 h. (i) Western blot analysis of primary hepatocyte from wt or Paqr3−/− mice in normal medium or LD medium for different times as indicated. All bars show mean±s.d., *P<0.05, **P<0.01, ***P<0.001 by Student's t-test; NS, not significant. All experiments were repeated at least twice with similar results and representative data are shown.
Figure 2
Figure 2. PAQR3 tethers Scap to the Golgi apparatus.
(a) Analysis of Scap and PAQR3 subcellular localization by fractionation. Myc-tagged Scap (for all three groups) and GFP-fused PAQR3 (for the last group) were transfected into sterol-sensitive and Scap-deficient SRD-13A cells. At 36 h after the transfection, the cells were switched to normal medium or lipid depletion medium for 90 min, and then subjected to homogenization and cell fractionation by gradient centrifugation. The relative distribution of each protein in different fractions is shown in the lower panels after densitometry analysis of the blots. (b) PAQR3 overexpression promotes Golgi localization of Scap. SRD-13A cells were transiently transfected with the plasmids as in a and used in immunofluorescence staining and confocal analysis. The arrows indicate apparent localization of Scap in the Golgi. (c) Knockdown of PAQR3 reduces lipid depletion-induced Golgi localization of Scap. SRD-13A cells were transfected either with control siRNA or PAQR3 siRNA. At 24 h after transfection, the cells were transfected with Myc-tagged Scap and cultured for 24 h. Then the cells were subjected to normal culture medium or lipid depletion medium before immunofluorescence staining and confocal analysis. The arrow indicates LD-induced localization of Scap in the Golgi. Scale bar,10 μm. All experiments were repeated at least twice with similar results and representative data are shown.
Figure 3
Figure 3. PAQR3 interacts with SREBP-2 and Scap via distinct structural motifs.
(a,b) Interaction of PAQR3 with Scap and SREBP-2. HEK293T cells were transiently transfected with the plasmids as indicated. The cell lysate was used in immunoblotting (IB) and immunoprecipitation (IP) with the antibodies as indicated. (c,d) Interaction of endogenous PAQR3 with endogenous Scap and SREBP-2 in HEK293T cells. The cell lysate was used in IB and IP using the antibodies as indicated. (e) A two-step co-immunoprecipitation assay to determine the ternary complex containing PAQR3, Scap and SREBP-2. The procedures of the two-step co-immunoprecipitation are outlined in the left. HEK293T cells were transfected with the plasmids as indicated and used in the immunoprecipitation. (f,g) Determination of PAQR3 domains required for its interaction with Scap and SREBP-2. Different PAQR3 deletion constructs were co-transfected with Myc-tagged Scap (f) or Flag-tagged SREBP-2 (g) into HEK293T cells. The cells were then subjected to lysis and IP, followed by IB with different antibodies as indicated. (h) A schematic diagram depicts critical domains of PAQR3 involved in the interaction with Scap and SREBP-2, respectively. (i) PAQR3 promotes Scap and SREBP-2 interaction. HEK293T cells were transiently transfected with the plasmids as indicated and the cell lysate was used in IB and IP with the antibodies as indicated. All experiments were repeated three times with similar results and representative data are shown.
Figure 4
Figure 4. Mutually exclusive interaction of Scap with PAQR3 or Insig-1 in the control of cholesterol homeostasis.
(a) Mutually exclusive interaction of Scap with PAQR3 or Insig-1. HEK293T cells were transfected with the plasmids as indicated and the cell lysate was used in immunoblotting (IB) and immunoprecipitation (IP) with the antibodies as indicated. (b,c) Mutually exclusive competition between PAQR3 and Insig-1 for Scap binding. HEK293T cells were transfected with plasmids as indicated, followed by IB and IP. (d) The relative levels of PAQR3 and Insig-1 determine SREBP-2 activation. CHO-7 cells were transfected with the plasmids as indicated and the cell lysate was used in IB. The relative ratios of N-SREBP-2 versus P-SREBP-2 were obtained by densitometric analysis (shown in the lower penal, **P<0.01, ***P<0.001 by Student's t-test). (e) The interaction of Scap with PAQR3 or Insig-1 is regulated by cholesterol. HEK293T cells were transfected with the plasmids as indicated and subjected to normal medium, LD medium with or without 25-HC replenishment for different time as indicated, followed by IB and IP assays. All experiments were repeated three times with similar results and representative data are shown.(f) A model depicts the functional role of PAQR3 in regulating cholesterol biosynthesis. When cellular cholesterol level is high, Scap/SREBP complex is retained in the ER by Insig, resulting in inactivation of SREBP. When cholesterol level is low, Insig is separated from Scap/SREBP complex which is then transported to the GA via COPII vesicles. PAQR3 facilitates anchoring of Scap/SREBP complex in the GA and promotes SREBP activation. What is not illustrated in the model is that this process is regulated by cholesterol. Low cholesterol induces degradation of Insig-1 while elevates PAQR3 expression, favouring retention of Scap/SREBP complex in the GA.
Figure 5
Figure 5. PAQR3 modulates SREBP activity and lipid synthesis of the liver on refeeding.
Eight-week-old male C57BL/6J mice were injected with control or PAQR3 knockdown adenovirus i.v. Seven days after injection, the mice (n=6 per group) were subjected to fasting and refeeding. The non-fasted group (NF) was fed a chow diet ad libitum, the fasted group (F) was fasted for 24 h, and the refed group (R) was fasted for 24 h and then refed a high-carbohydrate/low-fat diet for 12 h. (a) Western blot analysis of the mouse livers. (b) Total cholesterol (TC) and triglyceride (TG) contents in the livers. (c) Gene expression profiles in the mouse liver measured by RT–PCR. The same experiment was repeated twice with similar results. All data show mean±s.d., *P<0.05, **P<0.01, ***P<0.001 by Student's t-test.
Figure 6
Figure 6. PAQR3 modulates SREBP activity and lipid biosynthesis mainly at low dietary cholesterol levels.
Seven-week-old male C57BL/6J mice were injected with control or PAQR3-shRNA adenovirus i.v. Seven days after injection, the mice (n=7 per group) were subjected to diets containing different cholesterol levels ad libitum for 3 days, and then killed for analysis. (ac) Western blotting analysis, gene expression levels as measured by RT–PCR and lipid measurement in the livers of mice fed with a diet containing 0% cholesterol. (df) Western blotting analysis, mRNA and lipid levels in the livers of mice fed with diets of varying cholesterol concentrations. All data show mean±s.d., *P<0.05, **P<0.01, ***P<0.001 by Student's t-test, NS, not significant. All experiments were repeated at least twice with similar results and representative data are shown.
Figure 7
Figure 7. Disruption of PAQR3 interaction with Scap/SREBP by a synthetic peptide effectively blunts SREBP activity and lipid biosynthesis in the liver.
(a,b) A synthetic peptide P6–55 blocks the interaction of PAQR3 with Scap and SREBP-2. HEK293T cells were transfected with the plasmids as indicated. At 24 h after transfection, the cells were treated with P6–55 (1, 4 or 20 ng μl−1) for 12 h and the cell lysate was used for immunoblotting (IB) and immunoprecipitation (IP) using the indicated antibodies. (c) P6–55 reduces SREBP activation. CHO-7 cell was transfected with Flag-tagged SREBP-2. At 6 h after transfection, the cells were treated with P6–55 (4 or 20 ng μl−1) in normal medium or LD medium for 16 h, and the cell lysate was used in western blotting with the indicated antibodies. (d) P6–55 decreases lipid-synthesizing gene expression in cells. CHO-7 cells were treated with control peptide or P6–55 (20 ng μl−1) for 96 h and then used in RT–PCR. (e,f) P6–55 alleviates PAQR3-mediated Golgi localization of Scap. HeLa cells were transiently transfected with PAQR3 and Scap. After culturing in normal medium for 48 h, the cells were treated with 20 ng μl−1 of control peptide or P6–55 for 12 h before immunofluorescence staining and confocal analysis. The nuclei were stained with Hoechst 33342 (only shown in the merged images). The arrows denote co-localization of PAQR3 with Scap in the GA. The arrowheads indicate apparent loss of co-localization of PAQR3 with Scap in the GA. Quantitation of the co-localization of the proteins in the GA is shown in f. (gi) P6–55 shuts down SREBP activation and cholesterol synthesis in the liver. Western blotting analysis, gene expression analysis and lipid levels in the livers of mice (n=7 per group) treated with a control peptide or P6–55 (500 μg kg−1 per day) for 14 days. All bars show mean±s.d., *P<0.05, **P<0.01, ***P<0.001 by Student's t-test; NS, not significant. Scale bar, 10 μm. All experiments were repeated at least twice with similar results and representative data are shown.

Similar articles

Cited by

References

    1. Bloch K. The biological synthesis of cholesterol. Science 150, 19–28 (1965) . - PubMed
    1. Bucher N. L., Mc G. K., Gould E. & Loud A. V. Cholesterol biosynthesis in preparations of liver from normal, fasting, x-irradiated, cholesterol-fed, triton, or delta 4-cholesten-3-one-treated rats. J. Biol. Chem. 234, 262–267 (1959) . - PubMed
    1. Siperstein M. D. & Guest M. J. Studies on the site of the feedback control of cholesterol synthesis. J. Clin. Invest. 39, 642–652 (1960) . - PMC - PubMed
    1. Chin D. J. et al. Molecular cloning of 3-hydroxy-3-methylglutaryl coenzyme a reductase and evidence for regulation of its mRNA. Proc. Natl Acad. Sci. USA 79, 7704–7708 (1982) . - PMC - PubMed
    1. Goldstein J. L., DeBose-Boyd R. A. & Brown M. S. Protein sensors for membrane sterols. Cell 124, 35–46 (2006) . - PubMed

Publication types

MeSH terms