. 2015 Sep 7;282(1814):20151139.
doi: 10.1098/rspb.2015.1139.

The ecology of microscopic life in household dust

The ecology of microscopic life in household dust

Albert Barberán et al. Proc Biol Sci. .

Abstract

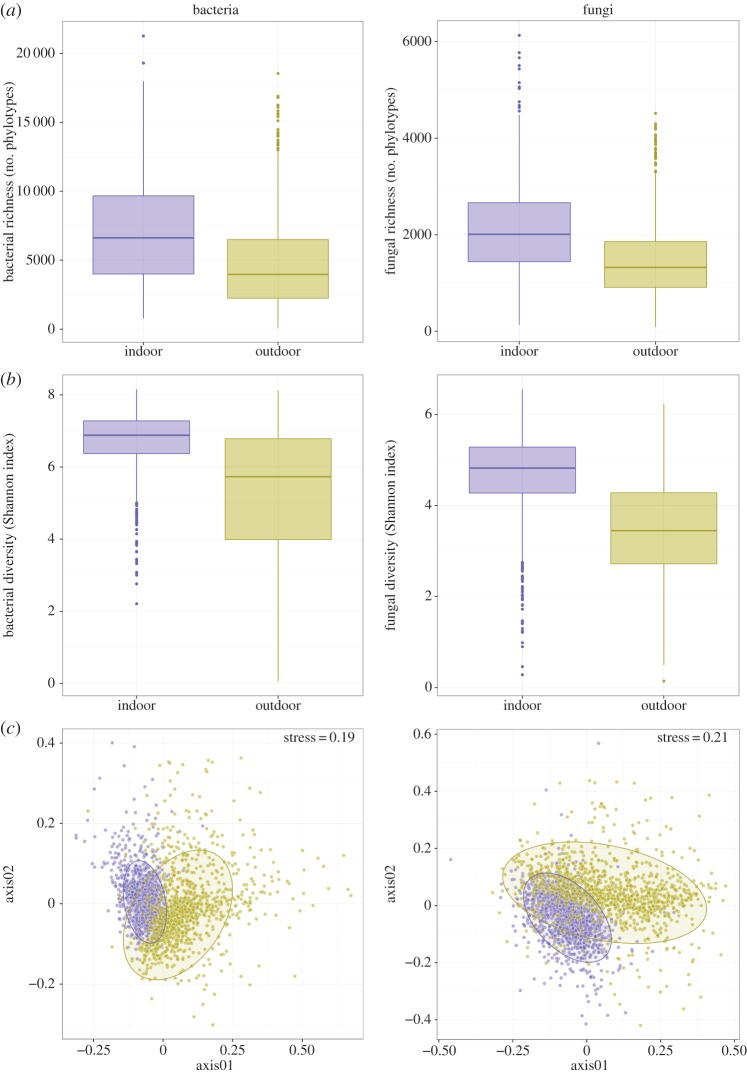
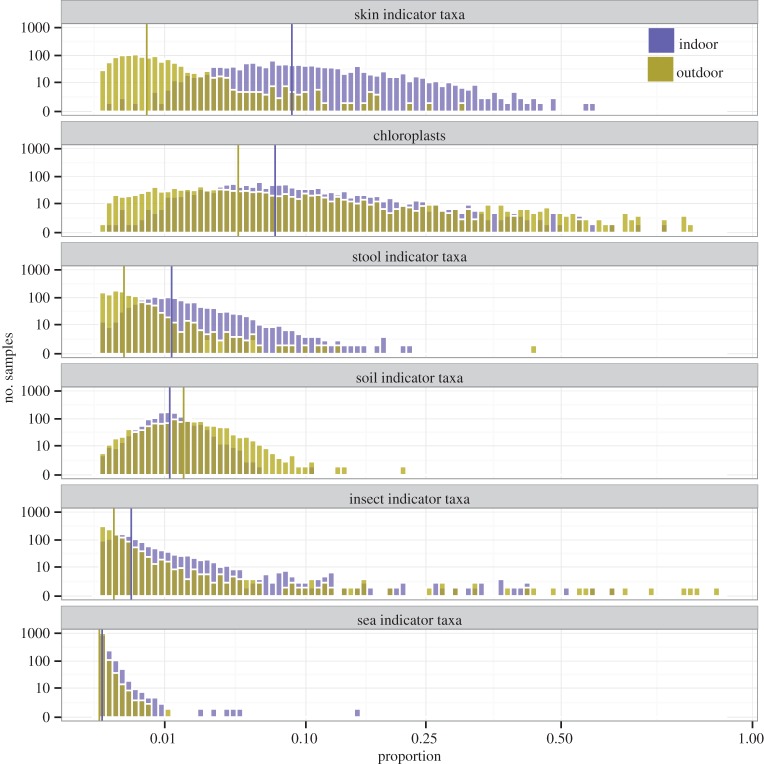
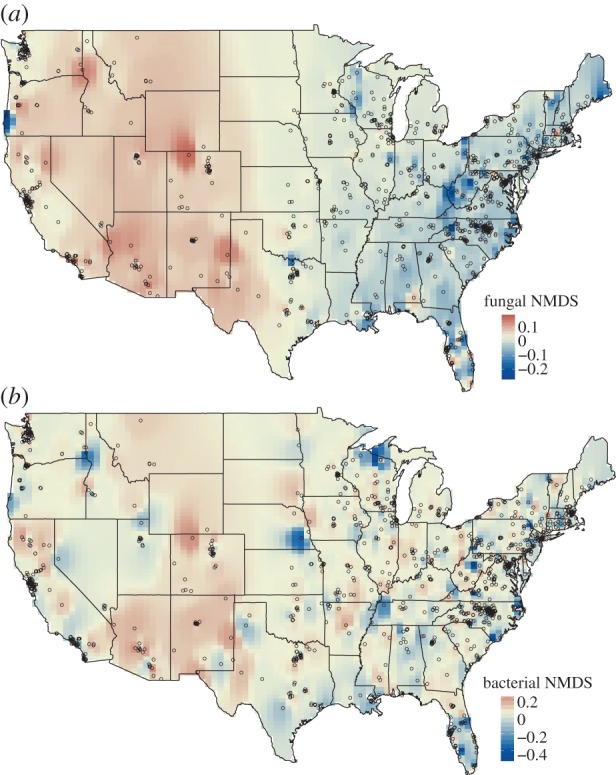
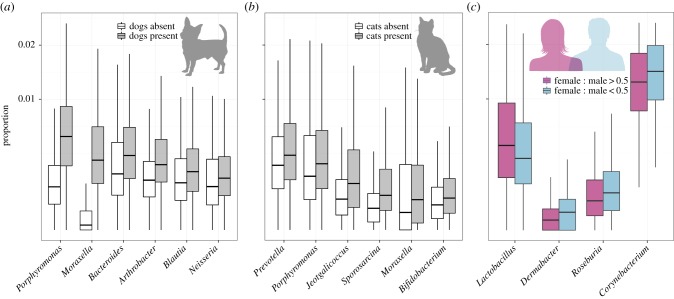
We spend the majority of our lives indoors; yet, we currently lack a comprehensive understanding of how the microbial communities found in homes vary across broad geographical regions and what factors are most important in shaping the types of microorganisms found inside homes. Here, we investigated the fungal and bacterial communities found in settled dust collected from inside and outside approximately 1200 homes located across the continental US, homes that represent a broad range of home designs and span many climatic zones. Indoor and outdoor dust samples harboured distinct microbial communities, but these differences were larger for bacteria than for fungi with most indoor fungi originating outside the home. Indoor fungal communities and the distribution of potential allergens varied predictably across climate and geographical regions; where you live determines what fungi live with you inside your home. By contrast, bacterial communities in indoor dust were more strongly influenced by the number and types of occupants living in the homes. In particular, the female : male ratio and whether a house had pets had a significant influence on the types of bacteria found inside our homes highlighting that who you live with determines what bacteria are found inside your home.


Figures

Figure 1.
Figure 1.
Differences in the richness, diversity and composition of indoor versus outdoor bacterial and fungal communities (panels a, b and c, respectively). (a,b) Differences in observed richness (number of phylotypes per sample) and diversity of phylotype distribution for the bacterial and fungal communities. (c) Differences in community composition for the bacterial and fungal communities using non-metric multidimensional scaling (ellipses represent 90% confidence intervals). In all panels, blue colours indicate those dust samples collected from inside homes, while yellow colours indicate dust samples collected from outside homes. (Online version in colour.)
Figure 2.
Figure 2.
Differences in the proportional abundances of bacterial indicator taxa of potential source environments between indoor (blue) and outdoor (yellow) dust samples across the more than 1100 homes for which we had data from both indoor and outdoor dust samples. Vertical lines correspond to medians. (Online version in colour.)
Figure 3.
Figure 3.
Maps of community similarity (NMDS axis scores) for fungal (a) and bacterial communities (b) found in the indoor dust samples. NMDS axis scores were mapped by inverse distance weighting interpolation on 100 × 100 grid cells. Similar colours indicate microbial communities that are more similar in overall community composition. Points represent sampling locations. (Online version in colour.)
Figure 4.
Figure 4.
Relative abundance of potential allergenic genera of fungi in dust samples collected from inside homes (a), map of the relative abundance of potential fungal allergens (interpolated using inverse distance weighting on 100 × 100 grid cells; b), and the distribution of total relative abundances of potential fungal allergens across the indoor dust samples (c). Points in (b) represent sampling locations. (Online version in colour.)
Figure 5.
Figure 5.
Differences in the proportion of bacterial indoor genera (Mann–Whitney test p < 0.01 after false discovery rate correction) between homes with or without dogs (a), and between homes with or without cats (b). (c) Differences in the proportion of bacterial indoor genera (Spearman's rank correlation p < 0.01 after false discovery rate correction) between homes with more females than males (female : male ratio > 0.5) and homes with more males than females (female : male < 0.5). (Online version in colour.)

References

    1. Qian J, Hospodsky D, Yamamoto N, Nazaroff WW, Peccia J. 2012. Size-resolved emission rates of airborne bacteria and fungi in an occupied classroom. Indoor Air 22, 339–351. (10.1111/j.1600-0668.2012.00769.x) - DOI - PMC - PubMed
    1. Adams RI, Miletto M, Taylor JW, Bruns TD. 2013. The diversity and distribution of fungi on residential surfaces. PLoS ONE 8, e78866 (10.1371/journal.pone.0078866) - DOI - PMC - PubMed
    1. Dunn R, Fierer N, Henley J, Leff J, Menninger H. 2013. Home life: factors structuring the bacterial diversity found within and between homes. PLoS ONE 8, e64133 (10.1371/journal.pone.0064133) - DOI - PMC - PubMed
    1. Prussin AJ, Garcia EB, Marr LC. 2015. Total concentrations of virus and bacteria in indoor and outdoor air. Environ. Sci. Technol. Lett. 2, 84–88. (10.1021/acs.estlett.5b00050) - DOI - PMC - PubMed
    1. Klepeis NE, Nelson WC, Ott WR, Robinson JP, Tsang AM, Switzer P, Behar JV, Hern SC, Engelmann WH. 2001. The National Human Activity Pattern Survey (NHAPS): a resource for assessing exposure to environmental pollutants. J. Expo. Anal. Environ. Epidemiol. 11, 231–252. (10.1038/sj.jea.7500165) - DOI - PubMed

Publication types