. 2015 Aug 26;35(34):11830-47.
doi: 10.1523/JNEUROSCI.4672-14.2015.

Parvalbumin+ Neurons and Npas1+ Neurons Are Distinct Neuron Classes in the Mouse External Globus Pallidus

Affiliations

Parvalbumin+ Neurons and Npas1+ Neurons Are Distinct Neuron Classes in the Mouse External Globus Pallidus

Vivian M Hernández et al. J Neurosci. .

Abstract

Compelling evidence suggests that pathological activity of the external globus pallidus (GPe), a nucleus in the basal ganglia, contributes to the motor symptoms of a variety of movement disorders such as Parkinson's disease. Recent studies have challenged the idea that the GPe comprises a single, homogenous population of neurons that serves as a simple relay in the indirect pathway. However, we still lack a full understanding of the diversity of the neurons that make up the GPe. Specifically, a more precise classification scheme is needed to better describe the fundamental biology and function of different GPe neuron classes. To this end, we generated a novel multicistronic BAC (bacterial artificial chromosome) transgenic mouse line under the regulatory elements of the Npas1 gene. Using a combinatorial transgenic and immunohistochemical approach, we discovered that parvalbumin-expressing neurons and Npas1-expressing neurons in the GPe represent two nonoverlapping cell classes, amounting to 55% and 27% of the total GPe neuron population, respectively. These two genetically identified cell classes projected primarily to the subthalamic nucleus and to the striatum, respectively. Additionally, parvalbumin-expressing neurons and Npas1-expressing neurons were distinct in their autonomous and driven firing characteristics, their expression of intrinsic ion conductances, and their responsiveness to chronic 6-hydroxydopamine lesion. In summary, our data argue that parvalbumin-expressing neurons and Npas1-expressing neurons are two distinct functional classes of GPe neurons. This work revises our understanding of the GPe, and provides the foundation for future studies of its function and dysfunction.

Significance statement: Until recently, the heterogeneity of the constituent neurons within the external globus pallidus (GPe) was not fully appreciated. We addressed this knowledge gap by discovering two principal GPe neuron classes, which were identified by their nonoverlapping expression of the markers parvalbumin and Npas1. Our study provides evidence that parvalbumin and Npas1 neurons have different topologies within the basal ganglia.

Keywords: 6-OHDA; BAC transgenic mice; HCN; Kv4; Nav; intrinsic properties.


Figures

Figure 1.
Figure 1.
Npas1-tdTom BAC transgenic mice faithfully report the localization of Npas1+ neurons in the CNS, including the GPe. a, Top, A photomicrograph of a mouse brain section showing the distribution of tdTomato-expressing neurons (black) in an Npas1-Cre-2A-tdTomato (Npas1-tdTom) BAC mouse. Bottom, A higher-magnification image showing the GPe and its neighboring areas. Note the labeling of neuropil in both the dStr and thalamic reticular nucleus (TRN). In contrast, the anterior commissure (ac) and the internal capsule (ic) were devoid of labeling. b, Immunohistochemical labeling of Npas1+ neurons in the GPe of Npas1-tdTom founder lines 1 (top) and 2 (middle). Note the high degree of colocalization between the Npas1-tdTom signal and the labeling of the endogenous Npas1 protein with the antibody. Bottom, Double immunofluorescent labeling of the endogenous Npas1 protein with a novel guinea pig (gp) antibody and a previously characterized (Erbel-Sieler et al., 2004) antibody. c, Immunofluorescent labeling with guinea pig (gp) and rabbit (rb) Npas1 antibodies in an Npas1 knock-out mouse. The lack of specific labeling further demonstrates the specificity of these novel antibodies. Abbreviations: anterior commissure (ac), basal magnocellular complex (bMg), cortex (Ctx), dorsal striatum (dStr), hippocampus (Hp), internal capsule (ic), substantia nigra pars reticulata (SNr), superior colliculus (SC), thalamus (Th), thalamic reticular nucleus (TRN), and zona incerta (ZI).
Figure 2.
Figure 2.
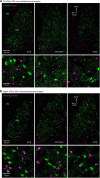
PV+ neurons and Npas1+ neurons are segregated in the GPe. a, Top, Low-magnification photomicrographs of sagittal sections showing an overview of the spatial distributions of PV+ (green) and Npas1+ (magenta) neurons within the GPe at lateral, intermediate, and medial levels (∼2.5, 2.1, and 1.7 mm lateral from bregma) in PV-tdTom mice. Bottom, High-magnification images of sections shown above. b, Parallel analysis was performed on Npas1-tdTom mice. ic, Internal capsule.
Figure 3.
Figure 3.
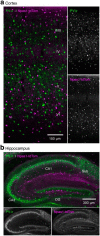
PV+ neurons and Npas1+ neurons are segregated in both the cortex and hippocampus. a, b, Photomicrographs of sagittal sections showing the subregion-specific expression and segregation of PV+ (green) and Npas1+ (magenta) neurons within the sensorimotor cortex (a) and the hippocampus (b) in the Npas1-tdTom mice. For clarity, the two channels are separated and presented in monochrome. DG, Dentate gyrus; sub, subiculum.
Figure 4.
Figure 4.
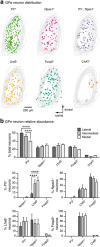
Spatial distribution and relative abundance of different GPe neuron classes. a, Graphic representation of densities and spatial distributions of identified GPe neurons across the dorsoventral and rostrocaudal axes. The confines of the GPe were defined by the cytoarchitecture. Cells located at lateral, intermediate, and medial levels (∼2.5, 2.1, and 1.7 lateral from bregma) were charted and collapsed onto a single sagittal plane. Representative data from a single mouse are shown in each case. Outlines of the GPe from a few representative examples were overlaid. Except for ChAT neurons, which often lined the caudoventral border of the GPe, all other identified GPe neurons are distributed throughout the GPe. b, Relative abundance of neuron classes in different lateromedial subdivisions of the GPe. (PV+ = 55 ± 6%, n = 1792 neurons; Npas1+ = 27 ± 4%, n = 2464 neurons; Lhx6+ = 30 ± 4%, n = 1028 neurons; Foxp2+ = 24 ± 3%, n = 1369 neurons; ChAT+ = 5 ± 1%, n = 1071 neurons) Percentage total was calculated from HuCD+ cells within each section. Note that PV and Npas1 were expressed in a largely nonoverlapping fashion (0 ± 0%). In contrast, considerable overlap between Lhx6 with PV (27 ± 7%, n = 619) or Npas1 (26 ± 8%, n = 1140) was observed; the remaining fraction was uniquely labeled with Lhx6. 80 ± 10% (n = 941) of the Foxp2 neurons coexpress Npas1; the remaining 20% were uniquely labeled with Foxp2. Medians ± MADs and two-tailed p values are listed. Medians and MADs are also represented in a graphical format. Asterisks denote statistical significance level: ****p < 0.0001, χ2 test.
Figure 5.
Figure 5.
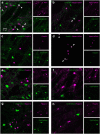
Immunohistochemical analysis of identified GPe neuron classes. Composite confocal micrographs demonstrating the cellular expression of various GPe neuron markers. Colocalization of cell markers are indicated by arrowheads (white). a, Colocalization of PV immunoreactivity (magenta) with GFP fluorescence (green) in an Lhx6-GFP mouse. b, Colocalization of GFP (green) and tdTom (magenta) signals in a genetic cross between an Npas1-tdTom mouse and Lhx6-GFP mouse. c, No colocalization was observed between Foxp2 immunoreactivity (magenta) and GFP fluorescence (green) in an Lhx6-GFP mouse. d, Colocalization was observed between Foxp2 immunoreactivity (green) and Npas1 immunoreactivity (magenta). e, No colocalization was observed between Foxp2 immunoreactivity (magenta) and tdTom fluorescence (green) in a PV-tdTom mouse. f, No colocalization was observed between PV immunoreactivity (magenta) and tdTom fluorescence (green) in a ChAT-tdTom mouse. g, No colocalization was observed between Npas1 immunoreactivity (magenta) and tdTom fluorescence (green) in a ChAT-tdTom mouse. h, No colocalization was observed between Foxp2 immunoreactivity (magenta) and tdTom fluorescence (green) in a ChAT-tdTom mouse.
Figure 6.
Figure 6.
Identified GPe neurons differ in their axonal projections patterns. a, b, Left, Sagittal mouse brain sections showing the axonal projections from PV+ neurons and Npas1+ neurons. A Cre-inducible eYFP (green) adeno-associated virus was injected into PV-tdTom and Npas1-tdTom mice. PV+ neurons produced a high density of eYFP+ GPe axons in the center of the STN (b) but not the dStr (a). In contrast, Npas1+ neurons project heavily to the dStr (a) but not the STN (b). Sections were also immunolabeled for HuCD (blue) to decipher the cytoarchitecture. A single confocal optical plane is illustrated in both examples. Right, High-magnification images corresponding to those shown on the left are included. c, Confocal micrographs depicting the results from retrograde tracing using Fluorogold injections into the STN. Top, Images showing the majority of STN-projecting GPe neurons (94 ± 2%, n = 664 neurons) were PV+. Bottom, Identical analysis in the Lhx6-eGFP mouse revealed that 41% (41 ± 4%; n = 639 neurons) of STN projection GPe neurons were Lhx6+. d, Representative examples of IPSC recordings in whole-cell voltage-clamped identified GPe neurons. IPSCs were evoked with electrical stimulation of the dStr ex vivo. cp, Cerebral peduncle; ZI, zona incerta.
Figure 7.
Figure 7.
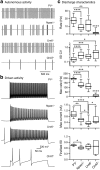
Identified GPe neurons differ in their autonomous and driven activity. a, Representative cell-attached recordings from PV+ neurons, Npas1+ neurons, Lhx6+ neurons, and ChAT+ neurons identified by fluorescent protein expression in their respective mouse lines. b, Representative traces of maximum firing in response to current injection from PV+ neurons, Npas1+ neurons, Lhx6+ neurons, and ChAT+ neurons identified by fluorescent protein expression in their respective mouse lines. c, Top, Box plots summarizing the autonomous pacemaking rate in GPe neuron classes (PV+ = 17.3 ± 3.6 Hz, n = 64; Npas1+ = 8.7 ± 3.4 Hz, n = 36; Lhx6+ = 12.2 ± 6.1 Hz, n = 18; ChAT+ = 1.5 ± 0.9 Hz, n = 8; p < 0.0001, Kruskal–Wallis test). ChAT+ neurons were significantly different from all other cell classes examined. Second from top, Box plots summarizing the firing regularity (ISI CV) of GPe neuron classes (PV+ = 0.14 ± 0.04, n = 64; Npas1+ = 0.26 ± 0.12, n = 36; Lhx6+ = 0.24 ± 0.07, n = 18; ChAT+ = 0.43 ± 0.24, n = 8; p < 0.0001, Kruskal–Wallis test). Third from top, Box plots summarizing the maximum firing rate of GPe neuron classes (PV+ = 196 ± 5 Hz, n = 8; Npas1+ = 120 ± 10 Hz, n = 9; Lhx6+ = 106 ± 28 Hz, n = 15; ChAT+ = 6 ± 2 Hz, n = 9; p < 0.0001, Kruskal–Wallis test). ChAT+ neurons were significantly different from all other cell classes examined. Fourth from top, Box plots summarizing the current injection amplitude at which neurons reached their maximum rate (PV+ = 910 ± 105 pA, n = 8; Npas1+ = 600 ± 110 pA, n = 9; Lhx6+ = 330 ± 80 pA, n = 15; ChAT+ = 440 ± 90 pA, n = 9; p = 0.0008, Kruskal–Wallis test). Bottom, Box plots summarizing the rate accommodation (calculated as ratio of the first ISI to the last ISI in the spike train with maximum firing rate) in GPe neuron classes (PV+ = 0.74 ± 0.01, n = 8; Npas1+ = 0.61 ± 0.05, n = 9; Lhx6+ = 0.70 ± 0.07, n = 15; ChAT+ = 0.70 ± 0.3, n = 9; p = 0.0835, Kruskal–Wallis test). Medians ± MADs and two-tailed p values are listed. Medians, interquartile ranges, and 10th to 90th percentiles are also represented in a graphical format. Asterisks denote statistical significance level: *p < 0.05, **p < 0.01, ***p < 0.005, ****p < 0.001, Mann–Whitney U test.
Figure 8.
Figure 8.
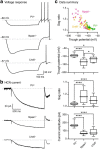
Identified GPe neurons have different levels of HCN currents. a, Representative voltage responses to a −160 pA current injection in PV+ neurons, Npas1+ neurons, and Lhx6+ neurons. b, Representative, leak-subtracted HCN currents evoked using a voltage step protocol (from −50 to −130 mV) in PV+ neurons, Npas1+ neurons, and Lhx6+ neurons. Capacitance transients were suppressed for clarity. c, Top, Scatter plot showing the relationship between trough and sag ratio in response to a −160 pA current injection in PV+ neurons (green), Npas1+ neurons (magenta), and Lhx6+ neurons (mustard). Middle, Box plots of trough potentials (PV+ = −91.8 ± 8.8 mV, n = 33; Npas1+ = −132.7 ± 17.7 mV, n = 21; Lhx6+ = −114.3 ± 17.3 mV, n = 29; p < 0.0001, Kruskal–Wallis test) and sag ratios (PV+ = 1.04 ± 0.01, n = 33; Npas1+ = 1.16 ± 0.08, n = 21; Lhx6+ = 1.09 ± 0.06, n = 29; p < 0.0001, Kruskal–Wallis test) in response to a −160 pA current injection in PV+ neurons, Npas1+ neurons, and Lhx6+ neurons. Bottom, Box plots of HCN current amplitude in PV+ neurons, Npas1+ neurons, and Lhx6+ neurons (PV+ = 168.4 ± 9.9 pA, n = 9; Npas1+ = 68.4 ± 7.1 pA, n = 11; Lhx6+ = 74.5 ± 28.4 pA, n = 9; p = 0.0001, Kruskal–Wallis test). Medians ± MADs and two-tailed p values are listed. Medians, interquartile ranges, and 10th to 90th percentiles are also represented in a graphical format. Asterisks denote statistical significance level: *p < 0.05, **p < 0.01, ***p < 0.005, ****p < 0.001, Mann–Whitney U test.
Figure 9.
Figure 9.
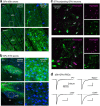
Identified GPe neurons have different levels of Kv4 currents. a, Light micrographs showing Kv4.2 (top) and Kv4.3 (bottom) immunoreactivity in the GPe and neighboring areas in two adjacent coronal mouse brain sections. amyg, Amygdala; GPi, internal globus pallidus; ic, internal capsule; Thal, thalamus. Higher-magnification images are showed on the right. b, Left, A composite confocal image showing the colocalization of Kv4.2 (cyan) and Kv4.3 (red) proteins in the GPe. Right, For clarity, the two channels are separated and presented in monochrome. c, Representative voltage-clamp recordings of Kv4-like current in identified PV+ neurons (n = 10), Npas1+ neurons (n = 6), and Lhx6+ neurons (n = 4). A family of currents was elicited from −70 to 0 mV from a holding potential of −50 mV. Prepulses at −110 and −40 mV were used to biophysically isolate Kv4-like currents (bottom). Voltage protocol for the isolation is illustrated as an inset. d, Difference currents (at −30 mV) were measured in identified GPe neurons and in double-null mutants (Kv4.2−/− and Kv4.3−/−). A representative recording from each cell group is shown. e, Box plots summarizing the amplitude of difference (top) currents (PV+ = 419.8 ± 80.6 pA, n = 18; Npas1+ = 95.8 ± 19.3 pA, n = 7; Lhx6+ = 572.2 ± 120.2 pA, n = 12; nulls = 80.9 ± 17.9 pA, n = 11; p = 0.0001, Kruskal–Wallis test) and sustained (bottom) current (PV+ = 388.0 ± 92.9 pA, n = 18; Npas1+ = 128.0 ± 70.9 pA, n = 7; Lhx6+ = 244.8 ± 28.4 pA, n = 12; nulls = 429.8 ± 142.2 pA, n = 11; p < 0.0001, Kruskal–Wallis test) measured in different GPe cell groups. Medians ± MADs and two-tailed P values are listed. Medians, interquartile ranges, and 10th to 90th percentiles are also represented in a graphical format. Asterisks denote statistical significance level: *p < 0.05, **p < 0.01, ***p < 0.005, ****p < 0.001, Mann–Whitney U test.
Figure 10.
Figure 10.
PV+ and PV GPe neurons have different levels of persistent Na+ currents. a, Representative voltage records of persistent sodium (NaP) currents evoked using a voltage ramp protocol (inset) in PV+ neurons and PV neurons. b, Box plots of NaP amplitude in PV+ neurons and PV neurons (PV+ = 129.9 ± 27.9 pA, n = 12; PV = 47.6 ± 12.6 pA, n = 6; p = 0.0020, Mann–Whitney U test). Medians ± MADs and two-tailed p values are listed. Medians, interquartile ranges, and 10th to 90th percentiles are also represented in a graphic format. Asterisks denote statistical significance level: ***p < 0.005, Mann–Whitney U test.
Figure 11.
Figure 11.
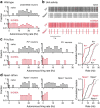
Autonomous firing of Npas1+ neurons is selectively reduced in a mouse model of PD. a, Frequency distribution histograms of unidentified GPe neurons in naive (black) and 6-OHDA lesioned (red) mice (naive = 17.1 ± 3.7 Hz, n = 37; 6-OHDA = 7.3 ± 5.8, n = 46; p = 0.0002). b, Representative cell-attached recordings from PV+ neurons and Npas1+ neurons in naive (black) and 6-OHDA lesioned (red) mice. Neurons were identified by fluorescent protein expression in PV-tdTom and Npas1-tdTom mouse lines. c, Frequency distribution histograms of PV+ neurons (left) and PV neurons (middle) in naive (black) and 6-OHDA lesioned (red) PV-tdTom mice. Data are summarized as a cumulative plot (right). d, Frequency distribution histograms of Npas1 neurons (left) and Npas1+ neurons (middle) in naive (black) and 6-OHDA lesioned (red) PV-tdTom mice. Data are summarized as a cumulative plot (right).
Figure 12.
Figure 12.
Diagrams summarizing the classification scheme derived from the current study. a, A diagram showing the neuronal makeup of the mouse GPe. PV+ neurons (green), Npas1+ neurons (magenta), Lhx6+ neurons (mustard), Foxp2+ neurons (teal), and ChAT+ neurons (rust) are included in this classification scheme. The area of the rectangles represents the size of each neuron population. ChAT+ neurons are 5% of the total GPe neuron population and show no overlap with other known classes of GPe neurons. b, PV+ neurons and Npas1+ neurons are two principal, largely nonoverlapping neuron classes in the mouse GPe. They represent 55% and 27% of the total GPe neuron population. PV+ neurons and Foxp2+ neurons are also nonoverlapping. The latter constitutes 24% of the total GPe population. In contrast, 27% of PV+ neurons are Lhx6+. c, Npas1+ neurons and Foxp2+ neurons are two largely overlapping populations; 80% of Foxp2 neurons express Npas1. The remaining (28%) Foxp2-Npas1+ population is Lhx6+.

Similar articles

Cited by

References

    1. Abdi A, Mallet N, Mohamed FY, Sharott A, Dodson PD, Nakamura KC, Suri S, Avery SV, Larvin JT, Garas FN, Garas SN, Vinciati F, Morin S, Bezard E, Baufreton J, Magill PJ. Prototypic and arkypallidal neurons in the dopamine-intact external globus pallidus. J Neurosci. 2015;35:6667–6688. doi: 10.1523/JNEUROSCI.4662-14.2015. - DOI - PMC - PubMed
    1. Albin RL, Young AB, Penney JB. The functional anatomy of basal ganglia disorders. Trends Neurosci. 1989;12:366–375. doi: 10.1016/0166-2236(89)90074-X. - DOI - PubMed
    1. Albin RL, Young AB, Penney JB. The functional anatomy of disorders of the basal ganglia. Trends Neurosci. 1995;18:63–64. doi: 10.1016/0166-2236(95)80020-3. - DOI - PubMed
    1. Alexander GE, Crutcher MD. Functional architecture of basal ganglia circuits: neural substrates of parallel processing. Trends Neurosci. 1990;13:266–271. doi: 10.1016/0166-2236(90)90107-L. - DOI - PubMed
    1. Anderson ME, Horak FB. Influence of the globus pallidus on arm movements in monkeys. III. Timing of movement-related information. J Neurophysiol. 1985;54:433–448. - PubMed

Publication types

Substances

LinkOut - more resources