. 2015 Aug 26;35(34):12002-17.
doi: 10.1523/JNEUROSCI.1668-15.2015.

Defects of Lipid Synthesis Are Linked to the Age-Dependent Demyelination Caused by Lamin B1 Overexpression

Affiliations

Defects of Lipid Synthesis Are Linked to the Age-Dependent Demyelination Caused by Lamin B1 Overexpression

Harshvardhan Rolyan et al. J Neurosci. .

Abstract

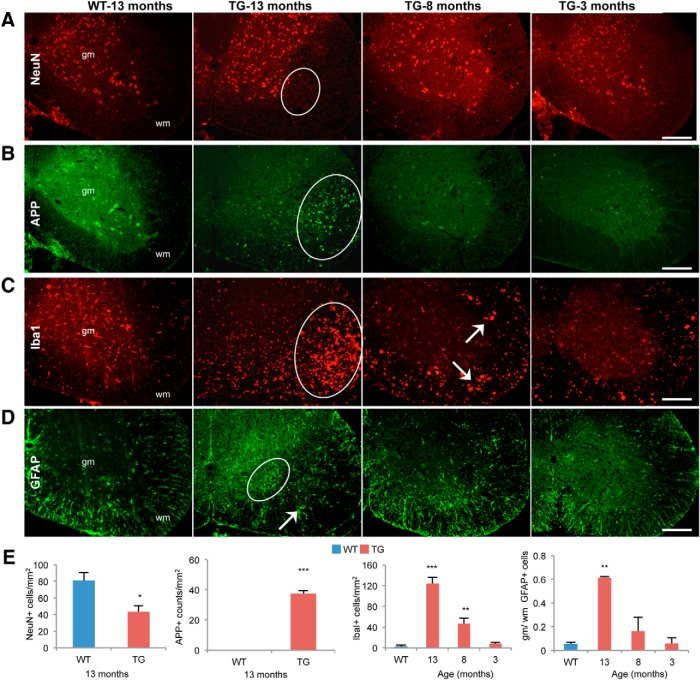
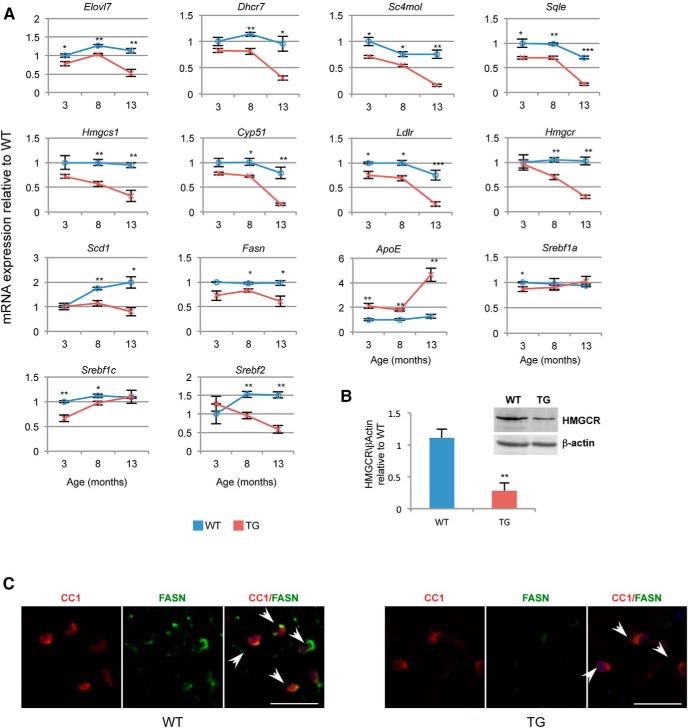
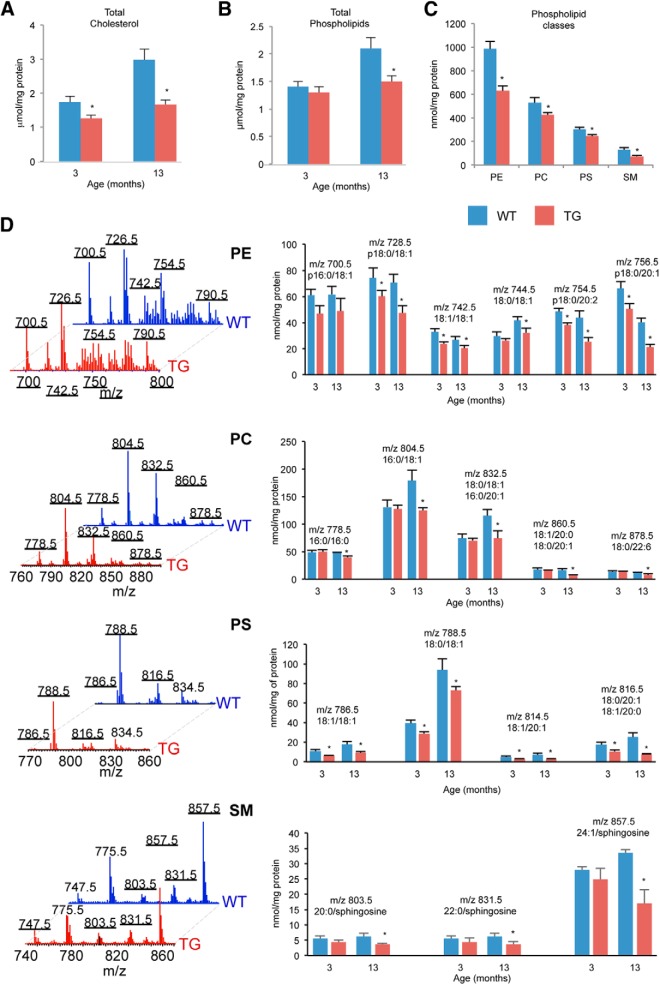
Lamin B1 is a component of the nuclear lamina and plays a critical role in maintaining nuclear architecture, regulating gene expression and modulating chromatin positioning. We have previously shown that LMNB1 gene duplications cause autosomal dominant leukodystrophy (ADLD), a fatal adult onset demyelinating disease. The mechanisms by which increased LMNB1 levels cause ADLD are unclear. To address this, we used a transgenic mouse model where Lamin B1 overexpression is targeted to oligodendrocytes. These mice showed severe vacuolar degeneration of the spinal cord white matter together with marked astrogliosis, microglial infiltration, and secondary axonal damage. Oligodendrocytes in the transgenic mice revealed alterations in histone modifications favoring a transcriptionally repressed state. Chromatin changes were accompanied by reduced expression of genes involved in lipid synthesis pathways, many of which are known to play important roles in myelin regulation and are preferentially expressed in oligodendrocytes. Decreased lipogenic gene expression resulted in a significant reduction in multiple classes of lipids involved in myelin formation. Many of these gene expression changes and lipid alterations were observed even before the onset of the phenotype, suggesting a causal role. Our findings establish, for the first time, a link between LMNB1 and lipid synthesis in oligodendrocytes, and provide a mechanistic framework to explain the age dependence and white matter involvement of the disease phenotype. These results have implications for disease pathogenesis and may also shed light on the regulation of lipid synthesis pathways in myelin maintenance and turnover.

Significance statement: Autosomal dominant leukodystrophy (ADLD) is fatal neurological disorder caused by increased levels of the nuclear protein, Lamin B1. The disease is characterized by an age-dependent loss of myelin, the fatty sheath that covers nerve fibers. We have studied a mouse model where Lamin B1 level are increased in oligodendrocytes, the cell type that produces myelin in the CNS. We demonstrate that destruction of myelin in the spinal cord is responsible for the degenerative phenotype in our mouse model. We show that this degeneration is mediated by reduced expression of lipid synthesis genes and the subsequent reduction in myelin enriched lipids. These findings provide a mechanistic framework to explain the age dependence and tissue specificity of the ADLD disease phenotype.

Keywords: Lamin B1; chromatin; demyelination; gene expression; inflammation; lipid.


Figures

Figure 1.
Figure 1.
Plp-FLAG-LMNB1 TG mice show accurately targeted exogenous lamin B1 expression and age-dependent motor dysfunction. A, Representative immunoblot of TG and WT protein lysates from different CNS regions showed the presence of the FLAG tagged LMNB1 band (arrow) that migrated slightly higher than the endogenous LMNB1 protein. This higher band and the band in the FLAG immunoblot were present only in the TG samples. FB, Forebrain; BS, brainstem; CB, cerebellum; SC, spinal cord. B, Quantitation of immunoblot data revealed overexpression of LMNB1 was highest in the spinal cord. The ratio of the top lamin B1 band intensity to the total lamin B1 (both top and bottom) band intensities were plotted for the TG samples. Data plotted were mean ± SEM; *p < 0.05, **p < 0.01, ***p < 0.001; n = 3 TG animals per CNS region. C, IHC from brain sections of TG mice showed the colocalization of FLAG (red) and LMNB1 (green) staining. Colocalization was also observed with FLAG (red) and the oligodendrocyte maker, CC1 (green). However, no colocalization is observed between FLAG (red) with the neuronal marker, NeuN (green), and astrocyte marker GFAP (green). Scale bar, 50 μm. D, WT 13-month-old mice showed no obvious phenotype, whereas TG littermate showed kyphosis (arrow) and forelimb atrophy (arrowhead). E, Open-field activity analysis shows a significant reduction in average velocity in the 13-month-old TG mice. Data plotted are mean ± SEM; ***p < 0.001; n = 3–4 animal per genotype per time point.
Figure 2.
Figure 2.
Plp-FLAG-LMNB1 TG mice show age-dependent degeneration of the spinal cord white matter. A, Representative H&E staining of WT and TG spinal cord sections. TG sections showed severe vacuolar degeneration of ventral and lateral white matter regions (arrows) at the 13 and 8 month time points. Three month TG sections do not show any obvious pathology. B, Representative Fluoromyelin staining of WT and TG spinal cord sections. TG sections showed a loss of staining in ventral and lateral white matter regions (arrows) only at the 13 and 8 month time points. Scale bars: A, B, 500 μm. C, Quantitation of vacuolar degeneration from H&E sections. The ratio of the area involved in vacuolar degeneration relative to the total area of the spinal cord was plotted. Note that no vacuolar degeneration was observed in the WT or 3 month TG samples. Data plotted are mean ± SEM; **p < 0.01, ***p < 0.001; n = 3 animal per genotype per time point. D, Representative H&E staining of 13 month WT and TG brainstem sections. E, Representative Fluoromyelin staining of 13 month WT and TG brainstem sections. No obvious degeneration is observed in the brainstem. Scale bars: D, E, 200 μm. F, Representative images of CC1+ cells in TG and WT spinal cords. Scale bar, 50 μm. G, Quantitation of CC1+ cells in TG and WT spinal cord sections across three time points revealed statistically significant increases in oligodendrocyte number in TG animals at the 13 and 8 month time points. **p < 0.01, ***p < 0.001; n = 3 animals per genotype per time point. H, Representative images of TUNEL staining for apoptotic nuclei in 13 month TG and WT spinal cord sections. No TUNEL-positive cells were observed in either of the samples. Scale bars, 100 μm.
Figure 3.
Figure 3.
Plp-FLAG-LMNB1 TG spinal cord show secondary neuronal loss, axonal degeneration, astrogliosis, and microglial infiltration. A, IHC with the neuronal marker NeuN showed loss of neurons in the ventral horn only in the 13 month TG spinal cord sections (oval region). gm, Gray matter; wm, white matter. B, APP, a marker for axonal degeneration, showed increased and punctate staining (oval region) only in the 13 month TG spinal cord sections. C, The microglial marker Iba-1 showed significant increase in IbaI + cells in 13 and 8 month TG samples (arrows). D, GFAP staining, a marker for astrocyte infiltration, was increased in the 13 month TG mice (arrow). In these sections, there also appeared to be a reorganization of astrocytes to the gray matter (oval). Scale bars, 200 μm. E, Quantitation of histological alterations shown in A–D. In all cases, WT was from a 13 month time point. For GFAP quantitation, ratio of GFAP+ counts in the gray matter (gm) versus white matter (wm) were plotted. Data plotted are mean ± SEM; *p < 0.05, **p < 0.01, ***p < 0.001; n = 3 animal per genotype per time point.
Figure 4.
Figure 4.
EM of Plp-FLAG-LMNB1 TG spinal cord. A, EM images of 13 month WT spinal cords showed no obvious abnormalities. B, C, EM images from 13-month-old TG mice showed severe demyelination and a general loss of organization of myelinated axons. White arrows show degenerating myelin sheaths that remain after axonal loss. Black star shows edematous vacuole without axon. Inset: edematous vacuole with preservation of axon (B, black arrow). Four pointed stars indicate very thinly myelinated axons consistent with remyelination. Inset, A redundant myelin profile is indicated by the white arrowhead (C). D, EM image of an 8 month TG spinal cord shows thinly myelinated axon (black star) and myelin debris engulfed by a phagocyte (black arrow). E, F, EM image of a 3 month TG spinal cord shows no obvious pathology (E) and is similar to 3 month WT sections (F). Scale bars: A–C, E, F, 10 μm; D, 2 μm. G, Quantitation of EM alterations in 13-month-old TG animals. Data plotted are mean ± SEM; **p < 0.01, ***p < 0.001 (n = 2–3 animals, >400 axons were analyzed per animal).
Figure 5.
Figure 5.
Altered age-dependent oligodendrocyte-specific chromatin modifications in Plp-FLAG-LMNB1 TG mice. A–D, Confocal images of spinal cord sections from WT and TG mice at 3 months (3 mo) and 13 months (13 mo) stained with antibodies against different histone modifications in oligodendrocytes. In all cases, the histone antibodies are in green, the oligodendrocyte marker CC1 in red, and DAPI in blue. For each figure, bottom shows a quantitative plot of the immunoreactivity at different time points (data plotted are mean ± SEM). H3K9me3 staining (A) and HeK27me3 staining (B). Note that both these repressive marks show significant increases in TG samples at both the 13 and 3 month time points relative to WT. AcH3 staining (C) and AcH4 staining (D). Note that both these activating histone marks show a reduction in TG samples relative to WT at the 13 month time point. For all graphs n = 3–4 animals per genotype at each time point. Data plotted are mean ± SEM; ***p < 0.001.
Figure 6.
Figure 6.
Plp-FLAG-LMNB1 TG mice do not show significant alterations of myelin-specific proteins. A, Immunoblots of spinal cord protein lysates from 13 month WT and TG animals probed with antibodies against the myelin-specific proteins CNPase, MBP, MOG, MAG, and PLP1. B, Quantitation of immunoblot from A show no significant differences in the levels of these proteins between WT and TG samples. Data plotted are mean band intensities ± SEM, first normalized to loading control and then to WT samples (n = 8 for TG; n = 4 for WT). C, Quantitation of real time PCR analysis of the expression levels of these genes also shows no significant differences between TG and WT samples. Data plotted are mean expression levels ± SEM, first normalized to internal control and then to WT samples (n = 3–4 animals for each genotype).
Figure 7.
Figure 7.
Transcriptomic analysis reveals downregulation of lipid-synthesis gene expression in Plp-FLAG-LMNB1 TG mice. A, B, RNA-Seq analysis of spinal cords from TG mice revealed a significant overlap of genes that were differentially expressed relative to WT at 3 months (3 mo) and 13 months (13 mo). C, Nine of the 12 genes that were downregulated and common between the 3 and 13 month time points (green) were involved in lipid synthesis. Expression of the ApoE gene (red) is significantly upregulated at both time points. D, Genes differentially expressed at 13 months are involved in GO pathways of lipid (left) and cholesterol (right) biosynthesis. Pie charts show percentage of genes that were upregulated and downregulated. For each pathway, pie charts to the right show the subset of these genes that were highly expressed in myelinating oligodendrocytes (OL). In all cases, n represents the number of genes differentially expressed at the 13 month time point and numbers in parenthesis represent the total number of genes in each of these pathways.
Figure 8.
Figure 8.
Age-dependent reduction of lipid gene expression in Plp-FLAG-LMNB1 TG mice. A, QT-PCR validation of RNA-Seq data showed that all nine lipid synthesis genes common between 3 and 13 month time points were consistently downregulated in TG samples and showed significant age-dependent decline comparative to age matched WT controls. Expression levels of ApoE and Fasn are also shown. In addition, Srebf2 showed significant age-dependent reductions in expression in TG samples, whereas Srebf1a and 1c show reduction in expression only at earlier time points. Expression levels of TG samples are first normalized to internal control and then to WT controls for each time point. Data plotted are mean ± SEM; *p < 0.05, **p < 0.01, ***p < 0.001; n = 3–4 animals per genotype for each time point. B, Protein levels of HMGCR are significantly reduced in 13 month TG spinal cords, data plotted are mean ± SEM; **p < 0.01; n = 3. C, Oligodendrocyte-specific reductions of FASN expression in 13 month TG spinal cord sections. Arrows point to oligodendrocytes stained with antibodies against CC1 and FASN. Scale bar, 25 μm.
Figure 9.
Figure 9.
Lipidomic analysis of Plp-FLAG-LMNB1 TG mice spinal cord. A, Quantitation of total cholesterol content in spinal cord extracts showed significant reduction in TG samples at 3 and 13 month time points compared with WT. Data plotted are mean ± SEM; *p < 0.05; n = 4 animals for each genotype. B, Quantitation of total PL content in spinal cord extracts showed significant reduction in TG samples at the 13 month time point. Data plotted are mean ± SD; *p < 0.05, n = 3 animals for each genotype. C, Quantitation of Individual PL classes in 13 month spinal cord extracts. TG samples showed significant reduction of different PL classes: PE, PC, PS, and SM. Data plotted are mean ± SD; *p < 0.05, n = 3 animals for each genotype. D, Representative MS spectra of PE, PC, PS, and SM obtained from spinal cords of 13-month-old WT and TG mice (left). Numbers above peaks represent the mass/charge (m/z) ratio, which identifies individual molecular species. Right, Quantitative assessment of these individual molecular species from 3 and 13-month-old TG and WT animals. Each molecular species is represented by the m/z ratio and the corresponding length of the fatty acid side chain. PC and SM were detected as adducts with acetic and formic acid. p- sn-1 vinyl ether (alkenyl- or plasmalogen) linkage. Data plotted are mean ± SD; *p < 0.05, n = 3 for per genotype for each time point.
Figure 10.
Figure 10.
MALDI imaging of spinal cord and model for disease mechanism in Plp-FLAG-LMNB1 TG mice. A, MALDI lipid imaging of spinal cord sections from 3-month-old TG and WT mice for individual PE and PC molecular species (listed below each image). Images are pseudocolored and the TG intensities have been normalized to maximal WT intensity to allow direct comparison across TG and WT images. Intensities of these lipid species showed reduction in white matter regions of TG spinal cord. For PE images, p16:0/18:1 and p18:0/18:1 refer to the plasmalogen type of fatty acid side chains. In the case of PC (18:1/20:0), (18:0/20:1), both these species are isobaric and cannot be differentiated by MALDI imaging. Scale bar, 500 μm. B, Mechanistic model linking lamin B1 overexpression, chromatin modification, lipid synthesis, and demyelination. This model provides a rationale for the age dependence and white matter involvement in ADLD.

Similar articles

Cited by

References

    1. Amoscato AA, Sparvero LJ, He RR, Watkins S, Bayir H, Kagan VE. Imaging mass spectrometry of diversified cardiolipin molecular species in the brain. Anal Chem. 2014;86:6587–6595. doi: 10.1021/ac5011876. - DOI - PMC - PubMed
    1. Anders S, Huber W. Differential expression analysis for sequence count data. Genome Biol. 2010;11:R106. doi: 10.1186/gb-2010-11-10-r106. - DOI - PMC - PubMed
    1. Barascu A, Le Chalony C, Pennarun G, Genet D, Imam N, Lopez B, Bertrand P. Oxidative stress induces an ATM-independent senescence pathway through p38 MAPK-mediated lamin B1 accumulation. EMBO J. 2012;31:1080–1094. doi: 10.1038/emboj.2011.492. - DOI - PMC - PubMed
    1. Bartoletti-Stella A, Gasparini L, Giacomini C, Corrado P, Terlizzi R, Giorgio E, Magini P, Seri M, Baruzzi A, Parchi P, Brusco A, Cortelli P, Capellari S. Messenger RNA processing is altered in autosomal dominant leukodystrophydagger. Hum Mol Genet. 2015;24:2746–2756. doi: 10.1093/hmg/ddv034. - DOI - PMC - PubMed
    1. Bidault G, Vatier C, Capeau J, Vigouroux C, Béréziat V. LMNA-linked lipodystrophies: from altered fat distribution to cellular alterations. Biochem Soc Trans. 2011;39:1752–1757. doi: 10.1042/BST20110675. - DOI - PubMed

Publication types