. 2015 Aug 26;35(34):12018-32.
doi: 10.1523/JNEUROSCI.5151-14.2015.

Myelin Proteolipid Protein Complexes with αv Integrin and AMPA Receptors In Vivo and Regulates AMPA-Dependent Oligodendrocyte Progenitor Cell Migration through the Modulation of Cell-Surface GluR2 Expression

Affiliations

Myelin Proteolipid Protein Complexes with αv Integrin and AMPA Receptors In Vivo and Regulates AMPA-Dependent Oligodendrocyte Progenitor Cell Migration through the Modulation of Cell-Surface GluR2 Expression

Danielle E Harlow et al. J Neurosci. .

Abstract

In previous studies, stimulation of ionotropic AMPA/kainate glutamate receptors on cultured oligodendrocyte cells induced the formation of a signaling complex that includes the AMPA receptor, integrins, calcium-binding proteins, and, surprisingly, the myelin proteolipid protein (PLP). AMPA stimulation of cultured oligodendrocyte progenitor cells (OPCs) also caused an increase in OPC migration. The current studies focused primarily on the formation of the PLP-αv integrin-AMPA receptor complex in vivo and whether complex formation impacts OPC migration in the brain. We found that in wild-type cerebellum, PLP associates with αv integrin and the calcium-impermeable GluR2 subunit of the AMPA receptor, but in mice lacking PLP, αv integrin did not associate with GluR2. Live imaging studies of OPC migration in ex vivo cerebellar slices demonstrated altered OPC migratory responses to neurotransmitter stimulation in the absence of PLP and GluR2 or when αv integrin levels were reduced. Chemotaxis assays of purified OPCs revealed that AMPA stimulation was neither attractive nor repulsive but clearly increased the migration rate of wild-type but not PLP null OPCs. AMPA receptor stimulation of wild-type OPCs caused decreased cell-surface expression of the GluR2 AMPA receptor subunit and increased intracellular Ca(2+) signaling, whereas PLP null OPCs did not reduce GluR2 at the cell surface or increase Ca(2+) signaling in response to AMPA treatment. Together, these studies demonstrate that PLP is critical for OPC responses to glutamate signaling and has important implications for OPC responses when levels of glutamate are high in the extracellular space, such as following demyelination.

Significance statement: After demyelination, such as occurs in multiple sclerosis, remyelination of axons is often incomplete, leading to loss of neuronal function and clinical disability. Remyelination may fail because oligodendrocyte precursor cells (OPCs) do not completely migrate into demyelinated areas or OPCs in lesions may not mature into myelinating oligodendrocytes. We have found that the myelin proteolipid protein is critical to regulating OPC migratory responses to the neurotransmitter glutamate through modulation of cell-surface expression of the calcium-impermeable GluR2 subunit of the AMPA glutamate receptor and increased intercellular Ca(2+) signaling. Altered glutamate homeostasis has been reported in demyelinated lesions. Therefore, understanding how OPCs respond to glutamate has important implications for treatment after white matter injury and disease.

Keywords: AMPA; GluR2; integrin; migration; myelin proteolipid protein; oligodendrocyte.


Figures

Figure 1.
Figure 1.
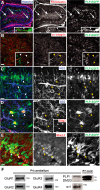
Expression of fibronectin, PLP–EGFP, αv integrin, and AMPA receptor subunits in cerebellum at P4. A, PLP–EGFP-labeled OPCs in P4 cerebellum migrated in areas of fibronectin expression (arrows; red). B, The αv integrin (red) was expressed along PLP–EGFP OPC processes (inset, arrowheads). C, Bipolar migratory PLP–EGFP cells expressed NG2 (arrowheads). D, Olig2 and NG2 expression in PLP–EGFP-positive cells (arrowheads). E, Nkx2.2, an early marker of oligodendrocytes, in PLP–EGFP-positive cells. F, Expression of AMPA receptor GluR subunits, αv integrin (αvI), and PLP/DM20 in P4 cerebellum. Scale bars: A, C, 50 μm; A, inset, 10 μm; B, D, 25 μm; E, 10 μm.
Figure 2.
Figure 2.
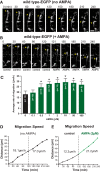
AMPA increases migration of OPCs in the P4 cerebellum. A, Time-lapse images of a PLP–EGFP-expressing OPC that migrates toward the direction of the tip of the long leading process. Scale bar, 18 μm. B, Time-lapse images of baseline OPC migration before the addition of AMPA (0–120 min) and after the addition of AMPA (121–240 min). Scale bar, 20 μm. For A and B, yellow asterisks mark the OPC soma, and the elapsed time in minutes is indicated above each image. C, Histogram showing the effects of 0.1–100 μm AMPA on the rate of OPC migration in slices of P4 wild-type PLP-EGFP mouse cerebella. Numbers in parentheses in each column indicate the number of OPCs tested. Error bars indicate SD. Asterisks indicate statistical significance (p < 0.05). D, Sequential changes in the total distance plotted as a function of elapsed time and calculated speed by the OPC soma during each 30 min of the imaging period shown in A. E, Sequential changes in the total distance and average calculated speed during each 30 min of the imaging period by the OPC soma shown in B were plotted as a function of elapsed time before and after application of 2 μm AMPA. Application of 2 μm AMPA immediately accelerated the migration of OPC.
Figure 3.
Figure 3.
AMPA-induced alteration of number and amplitude of Ca2+ transients in OPCs in P4 cerebellum. A, B, The alterations of number (A) and amplitude (B) of Ca2+ transients of OPCs in P4 cerebellum from wild-type-PLP-EGFP mice were plotted over elapsed time before and after application of 2 μm AMPA. Each value represents the average of 12 OPCs, and error bars represent SDs. Asterisks indicate statistical significance (p < 0.05). C, D, AMPA (2 μm) treatment alone (green bars) increased the number (C) and amplitude (D) of Ca2+ transients in OPCs above baseline (black bars). Treatment with 20 μm nifedipine, an L-type Ca2+ channel inhibitor, reduced the number (C) and amplitude (D) of Ca2+ transients in OPCs in the absence of AMPA (blue bars). When OPCs were treated with 20 μm nifedipine plus 2 μm AMPA (brown bars), there was a reduction in the number (C) and amplitude (D) of Ca2+ transients compared with AMPA treatment alone. The percentage change in number and amplitude of Ca2+ transients of OPCs in P4 cerebellum from wild type was evaluated by dividing the amplitude and number of Ca2+ transients after application of each regent by the amplitude and number of Ca2+ transients before application of each reagent. Each bar represents the average of OPCs from all experiments (AMPA, n = 12; nifedipine, n = 10; AMPA plus nifedipine, n = 13), and error bars represent SDs. Asterisks indicate statistical significance (p < 0.01).
Figure 4.
Figure 4.
In the absence of PLP, OPC migration did not increase in response to AMPA and αv integrin did not associate with GluR2. A, Time-lapse images of cerebellar slices obtained from P4 PLP−/Y-PLP-EGFP mice. OPC soma is marked by yellow asterisks. The elapsed time is indicated above each image. Scale bar, 20 μm. B, Sequential changes in the total distance and average calculated speed during each 30 min of the imaging period by the OPC soma shown in A were plotted as a function of elapsed time before and after application of 2 μm AMPA. Application of AMPA did not accelerate the migration of PLP−/Y OPCs. C, Immunoprecipitation of PLP from P7 wild-type cerebellum demonstrated association of GluR2, GluR4, and αv integrin with PLP, minimal association with GluR1, and no association with GluR3. D, Immunoprecipitation of αv integrin from the cerebellum of P7 wild-type and PLP−/Y mice. PLP was detected in the complex in wild-type mice and was absent in PLP null mice. The association of GluR2 with αv integrin was disrupted in PLP−/Y mice. GluR3 was associated with αv integrin in both WT and PLP null mice. GluR4 was not associated with αv integrin in either WT or PLP null mice.
Figure 5.
Figure 5.
OPCs that were null for GluR2 or deficient in αv integrin did not accelerate their migration rate in response to AMPA in P4 cerebellum. A, Time-lapse images of OPC migration in P4 cerebellum from GluR2−/− PLP-EGFP mouse. Yellow asterisks mark the soma of OPC. The elapsed time is indicated above each image. Application of AMPA (2 μm) did not accelerate the migration of GluR2−/− OPCs. Scale bar, 15 μm. B, Sequential changes in the total distance and calculated speed traveled during each 30 min of the testing period by the OPC soma shown in A were plotted as a function of elapsed time before and after application of 2 μm AMPA. C, Time-lapse images representing OPC migration in the cerebellum of P4 αv integrin+/− PLP-EGFP mice. Application of AMPA (2 μm) did not accelerate the migration of αv integrin+/− OPCs. Scale bar, 10 μm. D, Sequential changes in the total distance and average calculated speed traveled during each 30 min of the testing period by the OPC soma shown in C were plotted as a function of elapsed time before and after application of 2 μm AMPA.
Figure 6.
Figure 6.
Summary of cerebellar slice experiments. OPCs deficient in PLP, GluR2, or αv integrin had reduced baseline migration speeds and did not accelerate in response to AMPA treatment of cerebellar slices. A, The average speed of OPC migration was significantly slower in all mutant slices compared with wild-type PLP–EGFP OPCs. B, Differential effects of the application of 2 μm AMPA on the percentage change in migration speed from the baseline speed of PLP–EGFP-expressing OPCs in P4 cerebellum from wild-type, GluR2+/−, PLP−/Y, or αv integrin+/− mice. C, Baseline Ca2+ transients in untreated slices from WT, PLP−/Y, GluR2−/−, or αv integrin+/−. D, Differential effects of the application of 2 μm AMPA on the percentage change in the number of Ca2+ transients from the baseline of OPCs in P4 cerebellum from wild-type, GluR2−/−, PLP−/Y, or αv integrin +/− mice. Each bar represents the average of OPCs from all experiments, and error bars represent SDs. Asterisks indicate statistical significance (p < 0.05).
Figure 7.
Figure 7.
AMPA increased the association of PLP and GluR2 with αv integrin and the migration rate in wild-type but not PLP null OPCs, but it is neither attractive nor repulsive to migratory OPCs. A, OPCs isolated from wild-type or PLP null (−/Y) mouse mixed glia cultures expressed αv integrin (αvI), GluR2, and PLP in culture. B, Treatment of wild-type OPCs with 2 μm AMPA resulted in an increased association of αv integrin with PLP. C, Treatment of WT OPCs, but not PLP null OPCs, with 2 μm AMPA resulted in an increased association of GluR2 with αv integrin. D, Diagram of setup for live imaging in channel slides. To establish gradients for chemotaxis assays shown in F–H, cells were seeded in the middle channel, and control medium or medium containing AMPA was added to individual chambers on either side. E, Dose–response of WT (circles) and PLP−/Y null (squares) OPCs to AMPA. F, Individual tracks of wild-type OPCs from live imaging experiment in channel slide with medium in both chambers. The starting point for each track was placed at the origin. Black lines indicate OPCs whose overall migration was toward the left chamber, whereas red lines indicate OPCs whose overall migration was toward the right chamber. The overall distribution around the origin is uniform, indicating that migration was not directional. G, When 2 μm AMPA was placed in both chambers (bath application), wild-type OPC migration remained nondirectional. H, When 5 μm AMPA was placed only in the left chamber to set up a gradient of 2 μm AMPA across wild-type OPCs in the channel, migration also remained nondirectional. Rayleigh's test for uniform distribution was used, and p > 0.05 for all conditions.
Figure 8.
Figure 8.
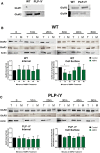
AMPA-induced internalization of GluR2 is disrupted in PLP null OPCs. A, Expression of GluR subunits in WT and PLP−/Y null OPCs. B, Western blots of GluR2 and GluR3 and actin protein expression in total (T), internal (I), and the cell-surface or membrane (M) fractions of WT OPCs after a time course of treatment with 100 μm AMPA plus 60 μm cyclothiazide. Treatment of wild-type OPCs did not alter internal protein levels (one-way ANOVA, F(5,18) = 0.09474, p = 0.9919) but caused a decrease in the amount of GluR2 present on the cell surface, peaking at 20 min (one-way ANOVA, F(5,12) = 3.498, p = 0.0351). C, Treatment of PLP null OPCs did not increase the internalization of GluR2 (one-way ANOVA, F(5,11) = 0.3868, p = 0.8480). Graphs depict the mean ratio ± SD of internal/total and membrane/total ratios of GluR2 normalized to the ratio at baseline (t = 0) for n = 4 experiments for each genotype.
Figure 9.
Figure 9.
Model of signaling complex formation. A, In wild-type OPCs, activation of AMPA receptors leads to the formation of a complex containing PLP–αv integrin and GluR2. After complex formation, there is increased internalization of GluR2, increased intracellular calcium signaling, and reduced fibronectin binding, which leads to increased OPC migration. B, In the absence of PLP, the PLP–αv integrin–GluR2 complex fails to form, and OPCs do not accelerate in response to AMPA receptor stimulation. C, Summary of events after AMPA receptor activation in wild-type cells.

Similar articles

Cited by

References

    1. Ahlgren SC, Wallace H, Bishop J, Neophytou C, Raff MC. Effects of thyroid hormone on embryonic oligodendrocyte precursor cell development in vivo and in vitro. Mol Cell Neurosci. 1997;9:420–432. doi: 10.1006/mcne.1997.0631. - DOI - PubMed
    1. Bader BL, Rayburn H, Crowley D, Hynes RO. Extensive vasculogenesis, angiogenesis, and organogenesis precede lethality in mice lacking all alpha v integrins. Cell. 1998;95:507–519. doi: 10.1016/S0092-8674(00)81618-9. - DOI - PubMed
    1. Bagayogo IP, Dreyfus CF. Regulated release of BDNF by cortical oligodendrocytes is mediated through metabotropic glutamate receptors and the PLC pathway. ASN Neuro. 2009;1:e00001. doi: 10.1042/AN20090006. pii. - DOI - PMC - PubMed
    1. Barres BA, Lazar MA, Raff MC. A novel role for thyroid hormone, glucocorticoids and retinoic acid in timing oligodendrocyte development. Development. 1994;120:1097–1108. - PubMed
    1. Bassani S, Cingolani LA. Tetraspanins: interactions and interplay with integrins. Int J Biochem Cell Biol. 2012;44:703–708. doi: 10.1016/j.biocel.2012.01.020. - DOI - PubMed

Publication types