. 2015 Aug 26;35(34):12063-79.
doi: 10.1523/JNEUROSCI.0608-15.2015.

IGF-1R Reduction Triggers Neuroprotective Signaling Pathways in Spinal Muscular Atrophy Mice

Affiliations

IGF-1R Reduction Triggers Neuroprotective Signaling Pathways in Spinal Muscular Atrophy Mice

Olivier Biondi et al. J Neurosci. .

Abstract

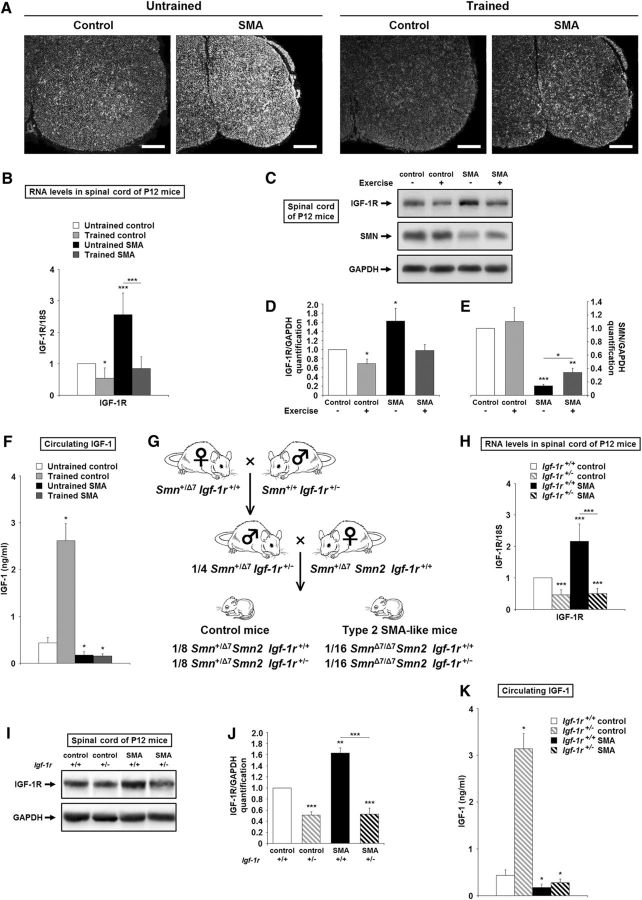
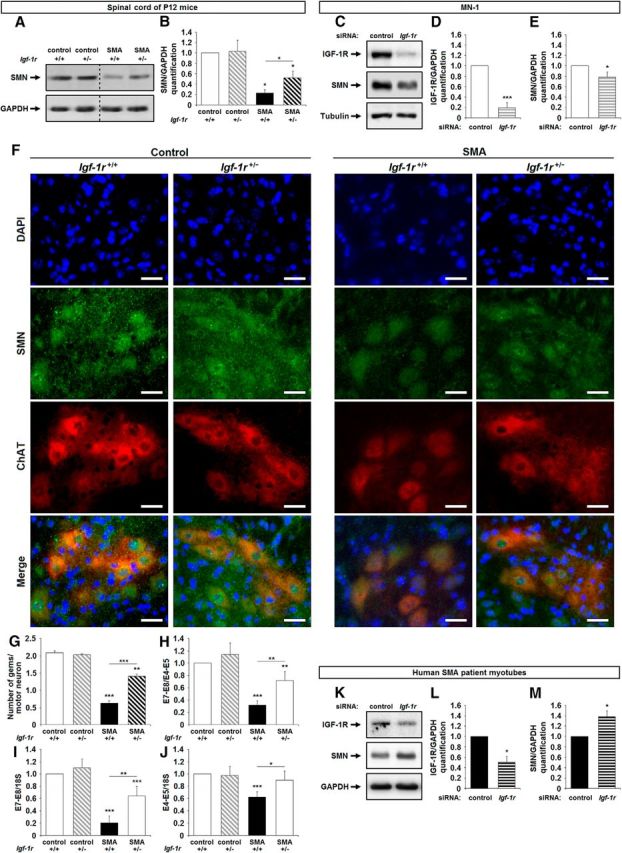
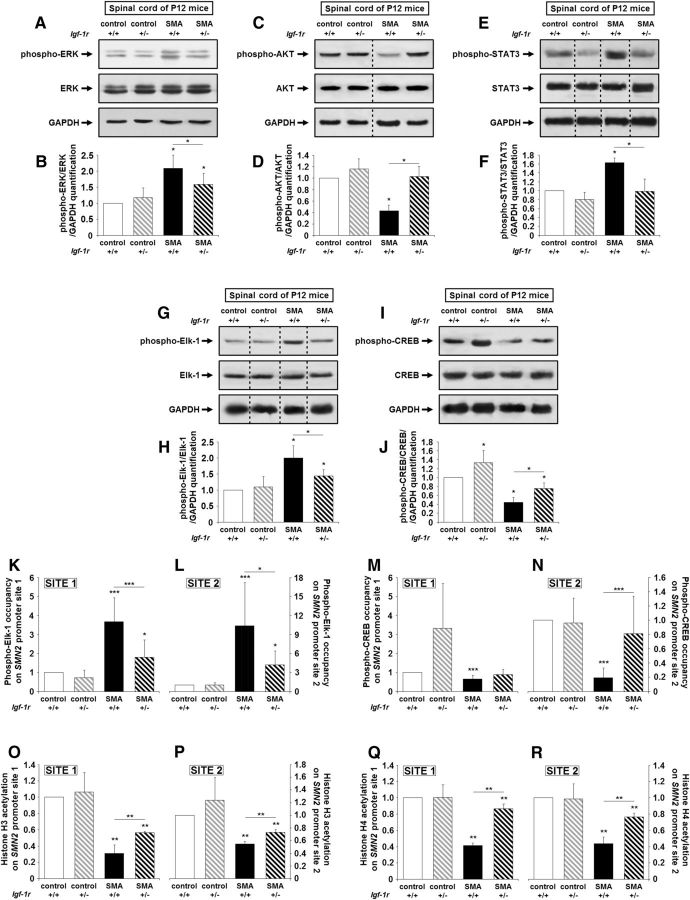
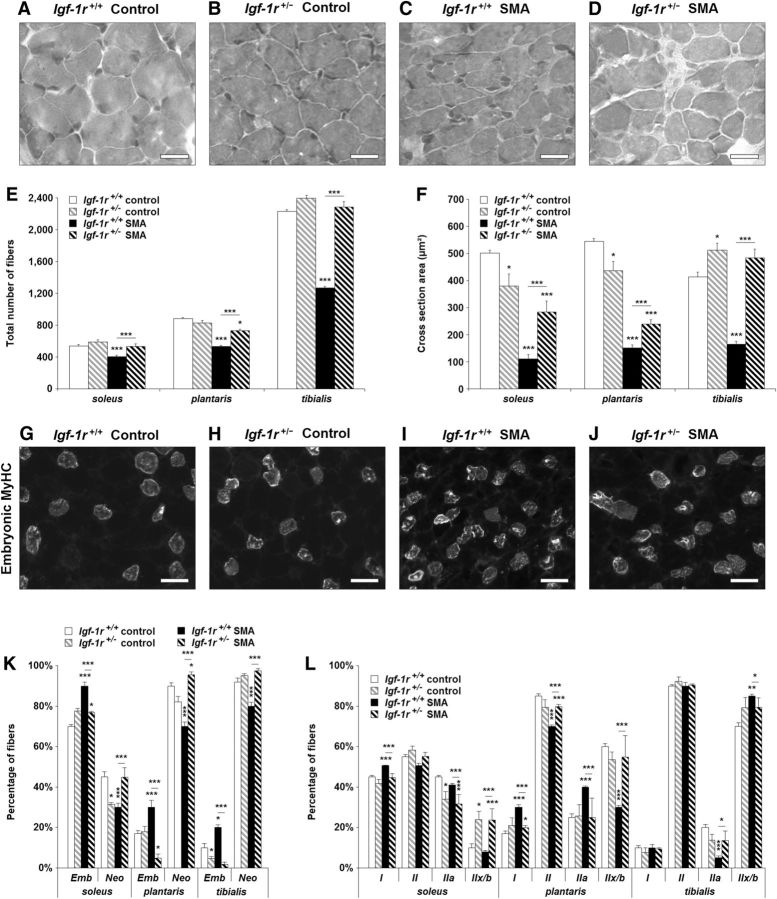
Spinal muscular atrophy (SMA) is a neuromuscular disease characterized by the selective loss of spinal motor neurons due to the depletion of the survival of motor neuron (SMN) protein. No therapy is currently available for SMA, which represents the leading genetic cause of death in childhood. In the present study, we report that insulin-like growth factor-1 receptor (Igf-1r) gene expression is enhanced in the spinal cords of SMA-like mice. The reduction of expression, either at the physiological (through physical exercise) or genetic level, resulted in the following: (1) a significant improvement in lifespan and motor behavior, (2) a significant motor neuron protection, and (3) an increase in SMN expression in spinal cord and skeletal muscles through both transcriptional and posttranscriptional mechanisms. Furthermore, we have found that reducing IGF-1R expression is sufficient to restore intracellular signaling pathway activation profile lying downstream of IGF-1R, resulting in both the powerful activation of the neuroprotective AKT/CREB pathway and the inhibition of the ERK and JAK pathways. Therefore, reducing rather than enhancing the IGF-1 pathway could constitute a useful strategy to limit neurodegeneration in SMA.

Significance statement: Recent evidence of IGF-1 axis alteration in spinal muscular atrophy (SMA), a very severe neurodegenerative disease affecting specifically the motor neurons, have triggered a renewed interest in insulin-like growth factor-1 (IGF-1) pathway activation as a potential therapeutic approach for motor neuron diseases. The present study challenges this point of view and brings the alternative hypothesis that reducing rather than enhancing the IGF-1 signaling pathway exerts a neuroprotective effect in SMA. Furthermore, the present data substantiate a newly emerging concept that the modulation of IGF-1 receptor expression is a key event selectively determining the activation level of intracellular pathways that lie downstream of the receptor. This aspect should be considered when designing IGF-1-based treatments for neurodegenerative diseases.

Keywords: IGF-1R; SMN; gene expression; model mice; signaling pathways; spinal muscular atrophy.


Figures

Figure 1.
Figure 1.
The IGF-1 axis is altered in the spinal cords of severe SMA-like mice. A, In situ hybridization on Igf-1r mRNA for the localization of expression in the lumbar spinal cords (L1–L5) of untrained control and type 2 SMA-like mice (left) compared with trained control and type 2 SMA-like mice (right) at 12 d of age (n = 4). Scale bar, 100 μm. B, Quantification by real-time qRT-PCR of Igf-1r transcripts normalized by 18S transcripts in the ventral lumbar spinal cords of untrained control and type 2 SMA-like mice compared with trained control and type 2 SMA-like mice at 12 d of age (n = 10). CE, Western blot analysis (C) and quantification of IGF-1Rβ (D) and SMN (E) protein expression in the ventral lumbar spinal cords of untrained control and type 2 SMA-like mice compared with trained control and type 2 SMA-like mice at 12 d of age (n = 4). F, Quantification of circulating IGF-1 concentration by ELISA in the serum of untrained control and type 2 SMA-like mice compared with trained control and type 2 SMA-like mice at 12 d of age (n = 4). G, Schematic representation of the crossings yielding to Igf-1r+/− SMA mice. H, Quantification by real time qRT-PCR of Igf-1r transcripts normalized by 18S transcripts in the ventral lumbar spinal cords of Igf-1r+/+ and Igf-1r+/− control mice compared with Igf-1r+/+ and Igf-1r+/− SMA mice at 12 d of age (n = 10). I, J, Western blot analysis (I) and quantification (J) of IGF-1Rβ protein expression in the ventral lumbar spinal cords of Igf-1r+/+ and Igf-1r+/− control mice compared with Igf-1r+/+ and Igf-1r+/− SMA mice at 12 d of age (n = 5). K, Quantification of circulating IGF-1 concentration by ELISA in the serum of IGF-1R+/+ and IGF-1R+/− control mice compared with Igf-1r+/+ and Igf-1r+/− SMA mice at 12 d of age (n = 4). Data are represented as mean ± SEM and significance is reported versus untrained or Igf-1r+/+ control mice, respectively (*p < 0.05, **p < 0.01, ***p < 0.001).
Figure 2.
Figure 2.
Genetic reduction of IGF-1R expression extends survival and motor behavior and promotes neuroprotection in SMA mice. A, Phenotype of Igf-1r+/− control mice compared with SMA mice and Igf-1r+/− SMA mice at 12 d of age. Scale bar, 1 cm. B, Lifespan of Igf-1r+/+ compared with Igf-1r+/− control and SMA mice (n = 40). C, Weight curve of Igf-1r+/+ and Igf-1r+/− control (left) and SMA (right) mice until SMA death (n = 40). D, Grip time of Igf-1r+/+ and Igf-1r+/− control (left) and SMA (right) mice until SMA death (D; n = 20). E, Total number of squares crossings during 5 min in the open-field test for Igf-1r+/+ and Igf-1r+/− control (left) and SMA (right) mice until SMA death (E; n = 20). FI, Immunodetection of ChAT-positive motor neurons in the lumbar spinal cord (L1–L5) of Igf-1r+/+ (F) and Igf-1r+/− control mice (G) compared with Igf-1r+/+ (H) and Igf-1r+/− SMA mice (I) at 12 d of age (n = 10. Scale bar, 50 μm. J, K, Quantitative analysis of the number (J) and the cell body area (K) of motor neurons per ventral horn in the ventral lumbar spinal cord of Igf-1r+/+ and Igf-1r+/− control mice compared with Igf-1r+/+ and Igf-1r+/− SMA mice at 12 d of age (n = 10). L, M, Western blot analysis (L) and quantification (M) of cleaved caspase-3 protein expression in the ventral lumbar spinal cord of Igf-1r+/+ and Igf-1r+/− control mice compared with Igf-1r+/+ and Igf-1r+/− SMA mice at 12 d of age (n = 4). Dotted lines on Western blot images symbolize some removed interspacing lanes for a side-by-side display of samples from all groups. Data are represented as mean ± SEM and significance is reported versus Igf-1r+/+ control mice (*p < 0.05, **p < 0.01, ***p < 0.001).
Figure 3.
Figure 3.
Genetic reduction of IGF-1R expression promotes SMN expression in mouse SMA spinal cords. A, B, Western blot analysis (A) and quantification (B) of SMN protein expression in the ventral lumbar spinal cords of Igf-1r+/+ and Igf-1r+/− control mice compared with Igf-1r+/+ and Igf-1r+/− SMA mice at 12 d of age (n = 4). CE, Western blot analysis (C) and quantification of IGF-1Rβ (D) and SMN (E) protein expression in MN-1 cell culture transfected with either a nonrelevant siRNA (siRNA Control) or an siRNA against Igf-1r (siRNA Igf-1r; n = 3). F, Immunodetection of SMN protein (SMN, green) in the nucleus (DAPI, blue) of ChAT-positive motor neurons (red) in the lumbar spinal cord (L1–L5) of Igf-1r+/+ and Igf-1r+/− control mice (left) compared with Igf-1r+/+ and Igf-1r+/− SMA mice (right) at 12 d of age (n = 4). Scale bar, 25 μm. G, Number of Gems per nucleus of ChAT-positive motor neurons in the ventral lumbar spinal cord of Igf-1r+/+ and Igf-1r+/− control mice compared with Igf-1r+/+ and Igf-1r+/− SMA mice at 12 d of age (100 motor neurons per mouse; n = 4). HJ, Quantification by real-time 1RT-PCR of the E7–E8 segment containing SMN transcripts normalized either by the E4–E5 segment containing SMN transcripts (H) or by 18S transcripts (I) and of total E4–E5 segment SMN transcripts normalized by 18S transcripts (J) in the ventral lumbar spinal cord of Igf-1r+/+ and Igf-1r+/− control mice compared with Igf-1r+/+ and Igf-1r+/− SMA mice at 12 d of age (n = 10). KM, Western blot analysis (K) and quantification of IGF-1Rβ (L) and SMN (M) protein expression in primary culture of myotubes from human SMA patient transfected with either a nonrelevant siRNA (siRNA Control) or an siRNA against IGF-1R (siRNA IGF-1R; n = 3). Dotted lines on Western blot images symbolize some removed interspacing lanes for a side-by-side display of samples from all groups. Data are represented as mean ± SEM and significance is reported versus Igf-1r+/+ control mice or siRNA control MN-1 or siRNA control myotube-transfected cells, respectively (*p < 0.05, **p < 0.01, ***p < 0.001).
Figure 4.
Figure 4.
Genetic reduction of IGF-1R expression restores intracellular pathway activation profile and promotes phospho-CREB-binding on SMN2 promoter in the spinal cords of SMA mice. A, B, Western blot analysis (A) and quantification (B) of ERK protein phosphorylation in the ventral lumbar spinal cords of Igf-1r+/+ and Igf-1r+/− control mice compared with Igf-1r+/+ and Igf-1r+/− SMA mice at 12 d of age (n = 5). C, D, Western blot analysis (C) and quantification (D) of AKT protein phosphorylation in the ventral lumbar spinal cords of Igf-1r+/+ and Igf-1r+/− control mice compared with Igf-1r+/+ and Igf-1r+/− SMA mice at 12 d of age (n = 5). E, F, Western blot analysis (E) and quantification (F) of STAT3 protein phosphorylation in the ventral lumbar spinal cords of Igf-1r+/+ and Igf-1r+/− control mice compared with Igf-1r+/+ and Igf-1r+/− SMA mice at 12 d of age (n = 5). G, H, Western blot analysis (G) and quantification (H) of Elk-1 protein phosphorylation in the ventral lumbar spinal cords of Igf-1r+/+ and Igf-1r+/− control mice compared with Igf-1r+/+ and Igf-1r+/− SMA mice at 12 d of age (n = 5). I, J, Western blot analysis (I) and quantification (J) of CREB protein phosphorylation in the ventral lumbar spinal cords of Igf-1r+/+ and Igf-1r+/− control mice compared with Igf-1r+/+ and Igf-1r+/− SMA mice at 12 d of age (n = 5). KN, ChIP analysis of phospho-Elk-1 (K, L) and phospho-CREB (M, N) in the ventral lumbar spinal cords of Igf-1r+/+ and Igf-1r+/− control mice compared with Igf-1r+/+ and Igf-1r+/− SMA mice at 12 d of age. Real-time qRT-PCR was performed to detect the SMN2 promoter site 1 (K, M) and site 2 (L, N; n = 12). OR, ChIP analysis of Histone H3 (O, P) and H4 (Q, R) acetylation in the ventral lumbar spinal cords of Igf-1r+/+ and Igf-1r+/− control mice compared with Igf-1r+/+ and Igf-1r+/− SMA mice at 12 d of age. Real-time qRT-PCR was performed to detect SMN2 promoter site 1 (O, Q) and site 2 (P, R; n = 12). Dotted lines on Western blot images symbolize some removed interspacing lanes for a side-by-side display of samples from all groups. Data are represented as mean ± SEM and significance is reported versus Igf-1r+/+ control mice (*p < 0.05, **p < 0.01, ***p < 0.001).
Figure 5.
Figure 5.
Genetic reduction of IGF-1R expression accelerates NMJ maturation in SMA mice. AG, Motor end-plate labeling with α-bungarotoxin (left) and anti-neufilament plus anti-synaptophysin antibodies (right), representing “Uniform-plaque” (A), “Perforated-plaque” (B), and “Pretzel-like plaque” (C), in the soleus of Igf-1r+/+ control mice (D), Igf-1r+/− control mice (E), Igf-1r+/+ SMA mice (F), and Igf-1r+/− SMA mice (G) at 12 d of age. Scale bars, 10 μm for high magnifications, 25 μm for low magnifications, and 5 μm for crops. H, I, Determination of the NMJ maturation (H) and area (I) in the soleus muscle from Igf-1r+/+ and Igf-1r+/− control mice compared with Igf-1r+/+ and Igf-1r+/− SMA mice at 12 d of age (n = 5). J, K, Determination of the NMJ maturation (J) and area (K) in the plantaris muscle from Igf-1r+/+ and Igf-1r+/− control mice compared with Igf-1r+/+ and Igf-1r+/− SMA mice at 12 d of age (n = 5). L, M, Determination of the NMJ maturation (L) and area (M) in the tibialis muscle from Igf-1r+/+ and Igf-1r+/− control mice compared with Igf-1r+/+ and Igf-1r+/− SMA mice at 12 d of age (n = 5). Data are represented as mean ± SEM and significance is reported versus Igf-1r+/+ control mice (*p < 0.05, **p < 0.01, ***p < 0.001).
Figure 6.
Figure 6.
Genetic reduction of IGF-1R expression limits muscle impairments and accelerates muscle maturation in SMA mice. AD. H&E staining on the tibialis of Igf-1r+/+ control mice (A), Igf-1r+/− control mice (B), Igf-1r+/+ SMA mice (C), and Igf-1r+/− SMA mice (D) at 12 d of age. Scale bar, 25 μm. E, F, Total number (E) and cross-sectional area (F) of myofibers in the soleus, plantaris, and tibialis muscles from control mice compared with Igf-1r+/+ and Igf-1r+/− SMA mice at 12 d of age (n = 4). GJ, Immunodetection of embryonic MyHC in the soleus of Igf-1r+/+ control mice (G), Igf-1r+/− control mice (H), Igf-1r+/+ SMA mice (I), and Igf-1r+/− SMA mice (J) at 12 d of age. Scale bar, 50 μm. K, L. Analysis of developmental (i.e., embryonic and neonatal; K) and adults (i.e., I, II, IIa and IIx/IIb; L) MyHC isoforms typology of the soleus, plantaris, and tibialis of control mice compared with Igf-1r+/+ and Igf-1r+/− SMA mice at 12 d of age (n = 4). Data are represented as mean ± SEM and significance is reported versus Igf-1r+/+ control mice (*p < 0.05, **p < 0.01, ***p < 0.001).
Figure 7.
Figure 7.
Genetic reduction of IGF-1R expression restores the intracellular pathway activation profile in the skeletal muscle tibialis in SMA mice. A, B, Western blot analysis (A) and quantification (B) of ERK protein phosphorylation in the tibialis muscle of Igf-1r+/+ and Igf-1r+/− control mice compared with Igf-1r+/+ and Igf-1r+/− SMA mice at 12 d of age (n = 4). C, D, Western blot analysis (C) and quantification (D) of AKT protein phosphorylation in the tibialis muscle of Igf-1r+/+ and Igf-1r+/− control mice compared with Igf-1r+/+ and Igf-1r+/− SMA mice at 12 d of age (n = 4). E, F, Western blot analysis (E) and quantification (F) of Elk-1 protein phosphorylation in the tibialis muscle of Igf-1r+/+ and Igf-1r+/− control mice compared with Igf-1r+/+ and Igf-1r+/− SMA mice at 12 d of age (n = 4). G, H, Western blot analysis (G) and quantification (H) of CREB protein phosphorylation in the tibialis muscle of Igf-1r+/+ and Igf-1r+/− control mice compared with Igf-1r+/+ and Igf-1r+/− SMA mice at 12 d of age (n = 4). I, J, Western blot analysis (I) and quantification (J) of SMN protein expression in the tibialis muscle of Igf-1r+/+ and Igf-1r+/− control mice compared with Igf-1r+/+ and Igf-1r+/− SMA mice at 12 d of age (n = 4). KM, Quantification by real-time qRT-PCR of the E7–E8 segment containing SMN2 transcripts normalized either by the E4–E5 segment containing SMN2 transcripts (K) or by 18S transcripts (L) and of total E4–E5 segment SMN2 transcripts normalized by 18S transcripts (M) in the tibialis muscle of Igf-1r+/+ and Igf-1r+/− control mice compared with Igf-1r+/+ and Igf-1r+/− SMA mice at 12 d of age (n = 8). Dotted lines on Western blot images symbolize some removed interspacing lanes for a side-by-side display of samples from all groups. Data are represented as mean ± SEM and significance is reported versus Igf-1r+/+ control mice (*p < 0.05, **p < 0.01, ***p < 0.001).
Figure 8.
Figure 8.
The modulation of IGF-1R expression levels is sufficient to restore the AKT/CREB and ERK/Elk-1 intracellular signaling pathway activation profile, resulting in SMN expression increase in SMA mice. AC, Proposed mechanisms involved in the increase of SMN expression induced by the genetic reduction of IGF-1R expression in severe SMA-like mice. Modulation of the activation profile of ERK/Elk-1 and AKT/CREB signaling pathways in control (A) compared with Igf-1r+/+ (B) and Igf-1r+/− SMA (C) mice at 12 d of age. Large characters indicate activated molecules.

References

    1. Bigot A, Klein AF, Gasnier E, Jacquemin V, Ravassard P, Butler-Browne G, Mouly V, Furling D. Large CTG repeats trigger p16-dependent premature senescence in myotonic dystrophy type 1 muscle precursor cells. Am J Pathol. 2009;174:1435–1442. doi: 10.2353/ajpath.2009.080560. - DOI - PMC - PubMed
    1. Biondi O, Grondard C, Lécolle S, Deforges S, Pariset C, Lopes P, Cifuentes-Diaz C, Li H, della Gaspera B, Chanoine C, Charbonnier F. Exercise-induced activation of NMDA receptor promotes motor unit development and survival in a type 2 spinal muscular atrophy model mouse. J Neurosci. 2008;28:953–962. doi: 10.1523/JNEUROSCI.3237-07.2008. - DOI - PMC - PubMed
    1. Biondi O, Branchu J, Sanchez G, Lancelin C, Deforges S, Lopes P, Pariset C, Lécolle S, Côté J, Chanoine C, Charbonnier F. In vivo NMDA receptor activation accelerates motor unit maturation, protects spinal motor neurons, and enhances SMN2 gene expression in severe spinal muscular atrophy mice. J Neurosci. 2010;30:11288–11299. doi: 10.1523/JNEUROSCI.1764-10.2010. - DOI - PMC - PubMed
    1. Bosch-Marcé M, Wee CD, Martinez TL, Lipkes CE, Choe DW, Kong L, Van Meerbeke JP, Musarò A, Sumner CJ. Increased IGF-1 in muscle modulates the phenotype of severe SMA mice. Hum Mol Genet. 2011;20:1844–1853. doi: 10.1093/hmg/ddr067. - DOI - PMC - PubMed
    1. Branchu J, Biondi O, Chali F, Collin T, Leroy F, Mamchaoui K, Makoukji J, Pariset C, Lopes P, Massaad C, Chanoine C, Charbonnier F. Shift from extracellular signal-regulated kinase to AKT/cAMP response element-binding protein pathway increases survival-motor-neuron expression in spinal-muscular-atrophy-like mice and patient cells. J Neurosci. 2013;33:4280–4294. doi: 10.1523/JNEUROSCI.2728-12.2013. - DOI - PMC - PubMed

Publication types

Substances