. 2015 Sep 8;112(36):11353-8.
doi: 10.1073/pnas.1503058112. Epub 2015 Aug 26.

Pel is a cationic exopolysaccharide that cross-links extracellular DNA in the Pseudomonas aeruginosa biofilm matrix

Affiliations

Pel is a cationic exopolysaccharide that cross-links extracellular DNA in the Pseudomonas aeruginosa biofilm matrix

Laura K Jennings et al. Proc Natl Acad Sci U S A. .

Abstract

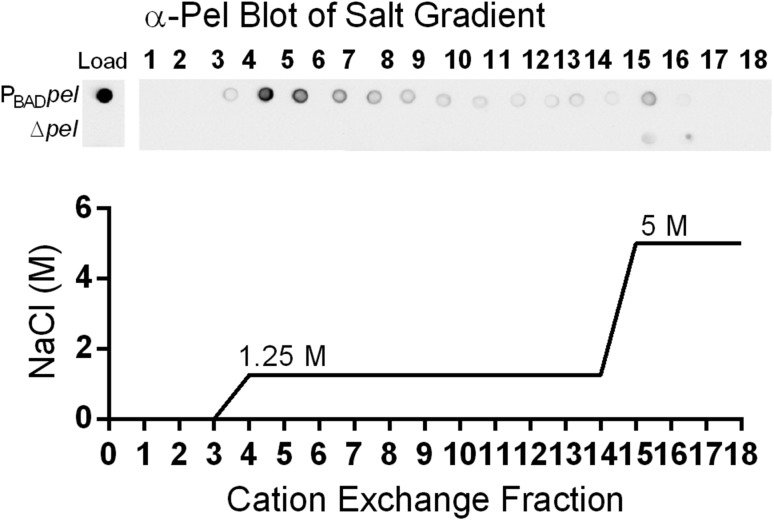
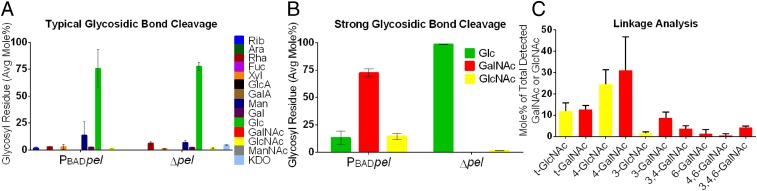
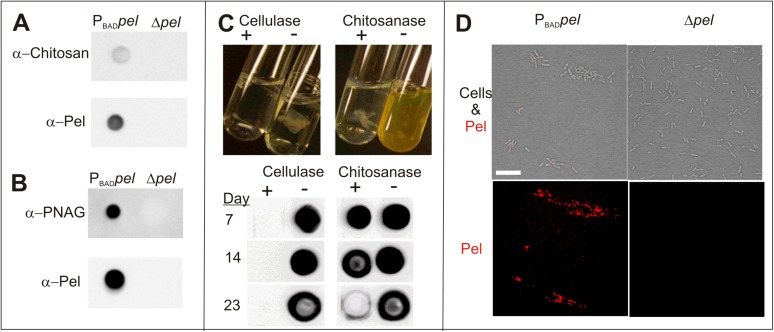
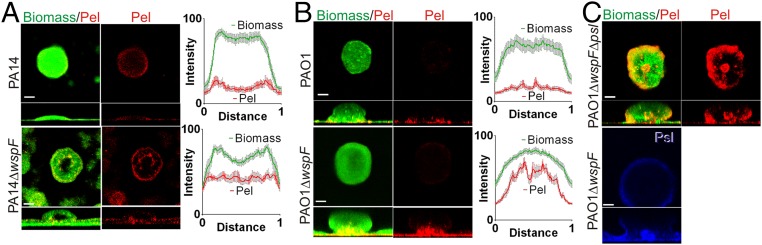
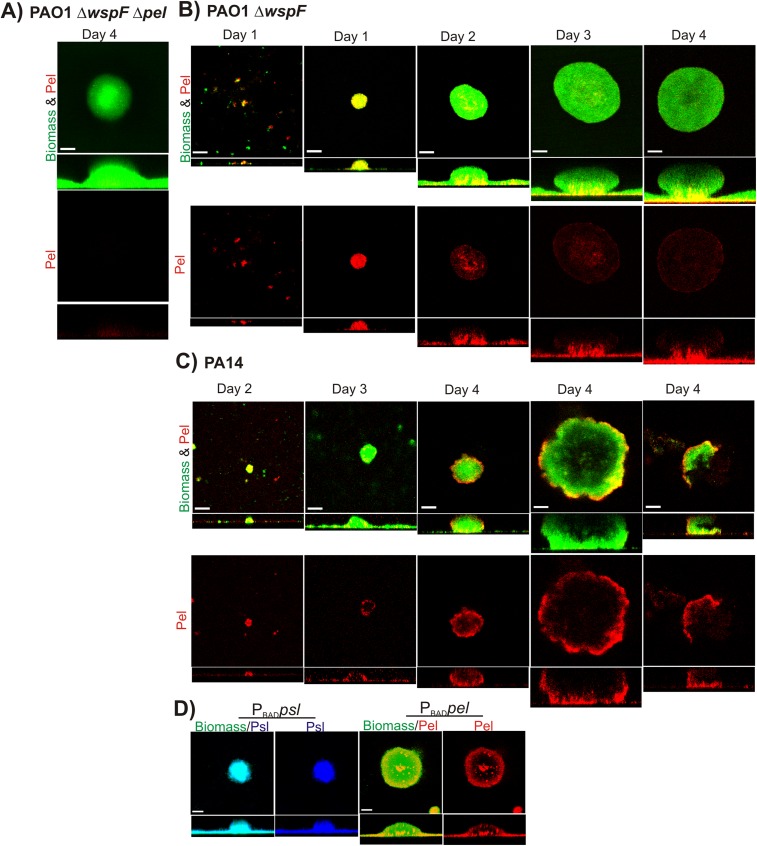
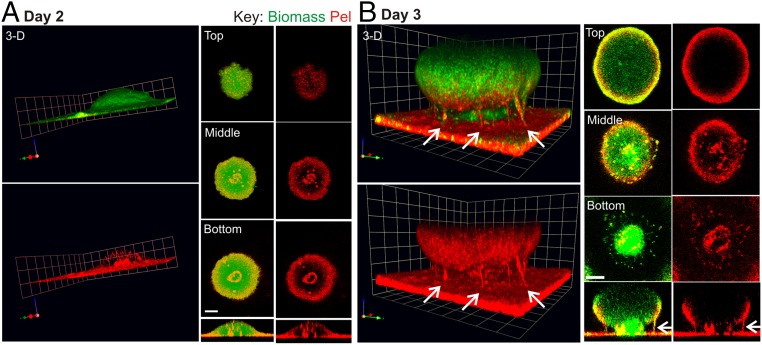
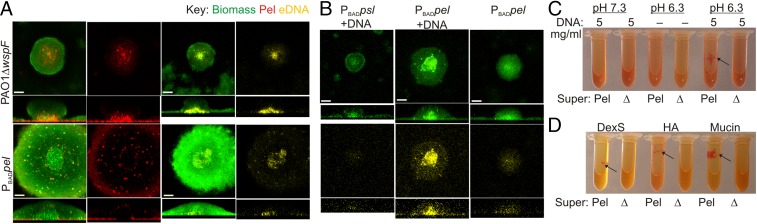
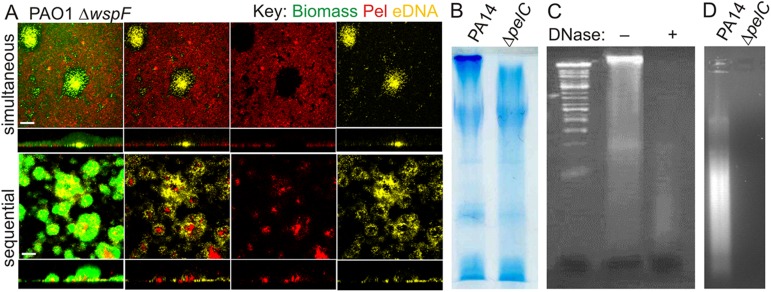
Biofilm formation is a complex, ordered process. In the opportunistic pathogen Pseudomonas aeruginosa, Psl and Pel exopolysaccharides and extracellular DNA (eDNA) serve as structural components of the biofilm matrix. Despite intensive study, Pel's chemical structure and spatial localization within mature biofilms remain unknown. Using specialized carbohydrate chemical analyses, we unexpectedly found that Pel is a positively charged exopolysaccharide composed of partially acetylated 1→4 glycosidic linkages of N-acetylgalactosamine and N-acetylglucosamine. Guided by the knowledge of Pel's sugar composition, we developed a tool for the direct visualization of Pel in biofilms by combining Pel-specific Wisteria floribunda lectin staining with confocal microscopy. The results indicate that Pel cross-links eDNA in the biofilm stalk via ionic interactions. Our data demonstrate that the cationic charge of Pel is distinct from that of other known P. aeruginosa exopolysaccharides and is instrumental in its ability to interact with other key biofilm matrix components.

Keywords: Pel; Psl; biofilms; exopolysaccharide; extracellular DNA.


Conflict of interest statement

The authors declare no conflict of interest.

Figures

Fig. S1.
Fig. S1.
α-Pel immunoblot indicates that LPS biosynthesis enzymes and UDP-Glc are not required for Pel production. Cell-associated and secreted (supernatant) Pel extracts from PBADpel (+) and Δpel (−) in a PAO1 ΔwspF Δpsl ΔR2 background were blotted. LPS is a major constituent of the outer membrane in Gram-negative bacteria and is composed of three parts: lipid A, a core containing KDO, and O-antigen polysaccharides (A and B bands). Mutant phenotypes were as follows: ΔwbpX, deficient in A band LPS; ΔwbpJ and ΔwbpM, deficient in B band LPS; ΔwbpL, deficient in A and B bands; ΔalgC, deficient in A band with a truncated LPS core; and ΔgalU, unable to synthesize UDP-Glc, deficient in A and B bands with a truncated LPS core.
Fig. S2.
Fig. S2.
PelF, the predicted glycosyltransferase, binds UDP with micromolar affinity. Isothermal titration calorimetry of PelF with the indicated nucleosides. For each nucleoside, the heats of injection (Upper) and normalized integration as a function of the molar syringe and cell concentrations (Lower) are shown. The calculated dissociation constant (KD) is indicated where binding was observed.
Fig. 1.
Fig. 1.
Secreted Pel is a low molecular weight cation. (A) The average molecular weight of secreted Pel is 0.5 kDa and was determined by comparison of Pel, detected with α-Pel immunoblot in size-exclusion fractions, to dextran and cellobiose standards, detected with a colorimetric assay for neutral sugars. A single replicate is shown for clarity, but a duplicate replicate from an independent experiment behaved similarly. (B) A pH gradient applied to a cation column with secreted Pel bound indicated that Pel, detected with α-Pel immunoblot, had an isoelectric point of 6.7–6.9.
Fig. S3.
Fig. S3.
Size-exclusion calibration curve for molecular weight determination of secreted Pel. The partition coefficient (KAV) versus molecular weight (log scale) of standards and PBAD pel supernatant is shown. KAV is defined as (VeVo)/(VtVo), where Ve is the elution volume, Vo is the column void volume, and Vt is the total bed volume. Error bars represent SD (n = 2).
Fig. S4.
Fig. S4.
Secreted Pel has an overall positive charge. Supernatant from PBADpel, but not from Δpel, bound a strong-cation exchange column at pH 5.5 and eluted at 1.25 M NaCl. Fractions from the cation column were probed with Pel antiserum (Top). Load indicates immunoblot of samples loaded to the column. Results shown are from a step gradient (Bottom), but a continuous gradient of salt concentration was initially used to determine the minimum salt concentration needed to elute Pel.
Fig. 2.
Fig. 2.
Glycosyl composition and linkage analyses of PBADpel and Δpel culture supernatant indicates that Pel is composed of 1→4 glycosidic linkages of GalNAc and GlcNAc. (A) Typical glycosidic cleavage conditions (no acid hydrolysis before methanolysis) were not sufficient to cleave Pel into monosaccharide components and resulted in detection of an abundance of glucose (Glc). (B) Strong glycosidic cleavage conditions (acid hydrolysis followed by methanolysis) enabled detection of amino sugars GalNAc and GlcNAc. (C) Glycosyl linkage analysis indicated that 4-linked GalNAc and GlcNAc were the most abundant residues detected of the total GalNAc and GlcNAc linkages. t, terminal. Error bars represent SD (n = 2).
Fig. S5.
Fig. S5.
Antibody binding, enzyme digestion, and lectin staining provide supportive evidence that Pel contains partially acetylated GalNAc and GlcNAc. (A) Monoclonal antibodies for chitosan bind secreted Pel from a cation-exchange purification of PBADpel, but not Δpel, culture supernatant. (B) Monoclonal antibodies for PNAG bind cell-associated Pel from EDTA extraction of cell pellets in PBADpel, but not in Δpel. (C) Chitosanase has activity on pellicles. PBADpel pellicles were grown statically before liquid was removed and replaced with buffer (−) or buffer plus enzyme (+). (Upper) Images of enzyme digest taken after 2 d. (Lower) α-Pel immunoblot of enzyme digests show chitosanase results in slow degradation of Pel-antisera signal compared with more rapid degradation by cellulase. (D) WFL, which recognizes GalNAc sugars, specifically binds PBADpel cell clusters (red), but not Δpel cells. A merge of bright field and red channel (Upper) and red channel only (Lower) are shown. (Scale bar: 10 µm.)
Fig. 3.
Fig. 3.
Pel localization in biofilms (AC). Representative confocal images are from biofilms cultivated for 3–4 d in flow cells and imaged with the Pel-specific lectin (WFL, red), Psl-specific lectin (HHA, blue), and/or biomass stain (Syto62, green). Horizontal optical cross-sections (large square) captured in the middle of the microcolony and side view (rectangle) are shown. (Scale bars: 30 µm.) Line profiles were quantified from a horizontal line drawn in the stalk (bottom quarter of the microcolony). The average normalized fluorescence signal intensity (100 × [intensity/maximum intensity]) from 12 to 16 microcolonies from at least two independent experiments is plotted versus normalized distance (distance/total length of the microcolony).
Fig. S6.
Fig. S6.
Localization patterns of Pel are consistent in biofilm time course. (A) Pel lectin was specific for Pel and showed minimal staining in PAO1 ΔwspF Δpel cultivated for 4 d on glucose minimal media. (B) Pel was localized to the stalk with minimal periphery staining in mature PAO1 ΔwspF microcolonies. (C) In PA14, Pel was localized to the stalk and periphery of the mushroom cap. For both strains, Pel staining was uniform in younger microcolonies (days 1–2). Shown are representative confocal images of flow cell biofilms cultivated for 1–4 d before staining with Pel-specific lectin (WFL, red) and biomass stain (Syto62, green). (D) Pel was localized in induced strain to the periphery and stalk, but Psl was uniformly distributed throughout the entire biofilm population. Shown are representative confocal images of flow cell biofilms from PBADpel and PBADpsl cultivated for 2 d in the presence of arabinose before staining with biomass stain (Syto62, green) and Pel-specific lectin (WFL, red) or Psl-specific lectin (HHA, blue). (Scale bars: 30 µm.)
Fig. 4.
Fig. 4.
Pel is localized to the periphery and stalk in a PBADpel biofilm and is a major structural component of the stalk. Shown are representative confocal images of flow cell biofilms cultivated for 2 d (A) and 3 d (B) before staining with biomass stain (Syto62, green) and Pel-specific lectin (WFL, red). Arrows indicate columns of Pel in the biofilm stalk. (Scale bars: 30 µm.) For 3D images, 1 U = 22.6 µm for 2 d biofilms and 1 U = 14.15 µm for 3 d biofilms. The gamma was adjusted on the red channel of the 3D images to reduce periphery staining and enhance visualization of Pel in the microcolony interior (day 2, γ = 3; day 3, γ = 2).
Fig. 5.
Fig. 5.
Pel cross-links eDNA in the biofilm stalk via an ionic binding mechanism. (A and B) Representative confocal images of flow cell biofilms before staining with Pel-specific lectin (WFL, red), biomass stain (Syto62, green), and/or eDNA stain (PI, yellow). Horizontal cross-sectional views were captured in the biofilm stalk (lower quarter of the microcolony). (Scale bars: 30 µm.) (A) Pel and eDNA colocalized in PAO1 ΔwspF and PBADpel biofilms. (B) Salmon sperm DNA incubated for 15 min with mature PBADpel biofilms concentrated in the stalk compared with PBADpel without added DNA. Exogenous DNA was not localized in PBADpsl biofilms. (C) Cross-linking of secreted Pel from PBADpel supernatant (Pel) to salmon sperm DNA resulted in visible aggregates that bind Congo red (arrow). (D) Aggregation of the anionic polymers dextran sulfate (DexS), hyaluronan (HA), and mucin with positively charged Pel from PBADpel supernatant (Pel) at pH 6.3 (arrows). Aggregation was not observed in Δpel supernatant (Δ).
Fig. S7.
Fig. S7.
(A) Pel and eDNA interfere with staining of each other when stained with WFL and PI simultaneously in the same microcolony (top row) or sequentially with WFL followed by PI (bottom row). Shown are representative confocal images of flow cell biofilms from PAO1 ΔwspF cultivated for 4 d before staining. (Scale bars: 30 µm.) (B) An HMW band is visible in DOC-PAGE gel profiles of the phenol extracts from PA14 cells, but not from ΔpelC cells. The gel was stained with alcian blue. (C) An HMW band in DOC-PAGE gel profile of the phenol extracts from PA14 before (−) and after (+) DNase treatment. The gel was stained with ethidium bromide. A DNA ladder is shown in leftmost lane. (D) Abundant DNA is present in 2% agarose gel profiles of the phenol extracts from PA14 cells, but not from ΔpelC cells.

References

    1. Costerton JW, Stewart PS, Greenberg EP. Bacterial biofilms: A common cause of persistent infections. Science. 1999;284(5418):1318–1322. - PubMed
    1. Parsek MR, Singh PK. Bacterial biofilms: An emerging link to disease pathogenesis. Annu Rev Microbiol. 2003;57:677–701. - PubMed
    1. Hall-Stoodley L, Costerton JW, Stoodley P. Bacterial biofilms: From the natural environment to infectious diseases. Nat Rev Microbiol. 2004;2(2):95–108. - PubMed
    1. Costerton JW, Lewandowski Z, Caldwell DE, Korber DR, Lappin-Scott HM. Microbial biofilms. Annu Rev Microbiol. 1995;49(1):711–745. - PubMed
    1. Flemming H-C, Wingender J. The biofilm matrix. Nat Rev Microbiol. 2010;8(9):623–633. - PubMed

Publication types

MeSH terms