

doi: 10.1128/JVI.01608-15.
Epub 2015 Aug 26.
Reorganization of Nuclear Pore Complexes and the Lamina in Late-Stage Parvovirus Infection
Affiliations
- PMID: 26311881
- PMCID: PMC4645667
- DOI: 10.1128/JVI.01608-15
Item in Clipboard
Reorganization of Nuclear Pore Complexes and the Lamina in Late-Stage Parvovirus Infection
J Virol.
2015 Nov.
Abstract
Canine parvovirus (CPV) infection induces reorganization of nuclear structures. Our studies indicated that late-stage infection induces accumulation of nuclear pore complexes (NPCs) and lamin B1 concomitantly with a decrease of lamin A/C levels on the apical side of the nucleus. Newly formed CPV capsids are located in close proximity to NPCs on the apical side. These results suggest that parvoviruses cause apical enrichment of NPCs and reorganization of nuclear lamina, presumably to facilitate the late-stage infection.
Copyright © 2015, American Society for Microbiology. All Rights Reserved.
Figures
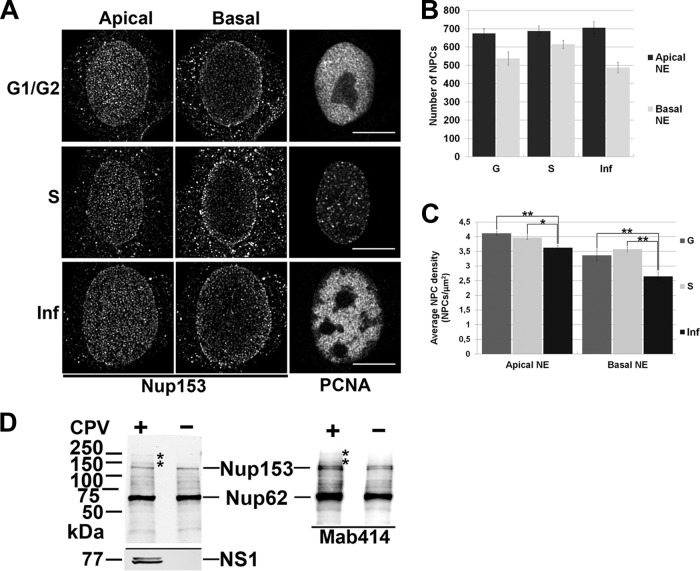
Infection- and cell cycle-dependent distribution of nuclear pore complexes. (A) Confocal microscopy images of the infected cells (Inf) at 24 h p.i. and the mock-infected cells in S and G1/G2 phases. NPCs and PCNA were visualized with Nup153 (left and middle panels) and PCNA (right panel) antibodies. (B) The amount of NPCs calculated from the apical and basal sides of NE. (C) Average density of NPCs in apical and basal side of NE. The average values of the results of triplicate experiments ± SDs are shown. (D) Western blot analysis of Nup153 and Nup62 proteins harvested from the infected and mock-infected cells and their structural integrity. Nups were detected with Nup153-specific antibody and Mab414 antibody recognizing FG-repeated Nup62 and Nup153 in feline cells. Statistical significance in comparison to the mock-infected cells is shown (Student's t test P values: *, P < 0.05; **, P < 0.01). Bars, 10 μm. Error bars represent the 95% confidence interval.
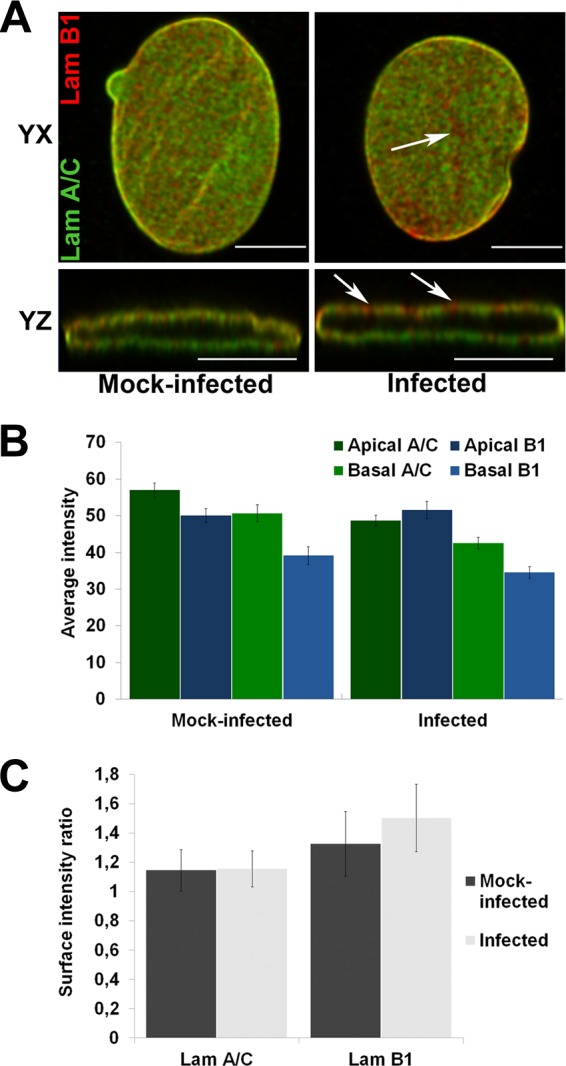
Distributions of lamin A/C and lamin B1. (A) Confocal yx and yz cross sections taken through the nucleus show localization of lamin A/C (Lam A/C) (green) and lamin B1 (Lam B1) (red) Abs in mock-infected (left) and infected (right) cells. Arrowheads show lamin B1-enriched areas. (B) Average intensities of lamin A/C and B in apical and basal sides of NE. (C) Surface intensity ratio between the apical and basal sides for both lamins individually per ImageJ analysis. Error bars represent the 95% confidence intervals. Bars, 10 μm.
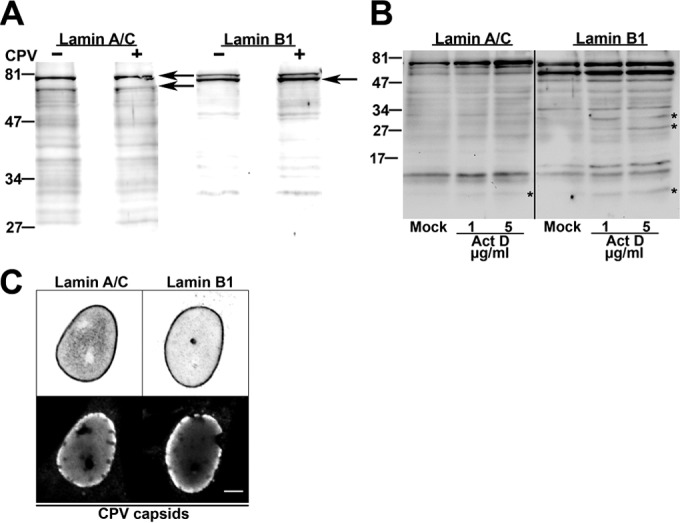
Structural integrity of lamins. (A and B) Western blot analysis of structural integrity of lamins A/C and B1 in infected, mock-infected cells (A) and actinomycin D (1 to 5 μg/ml)-treated cells (B). Asterisks indicate disintegration products of lamins. (C) Confocal microscopy sections of infected cells showing distributions of lamin A/C and lamin B1 and accumulation of viral capsids at the nuclear periphery at 24 h p.i. Bar, 5 μm.
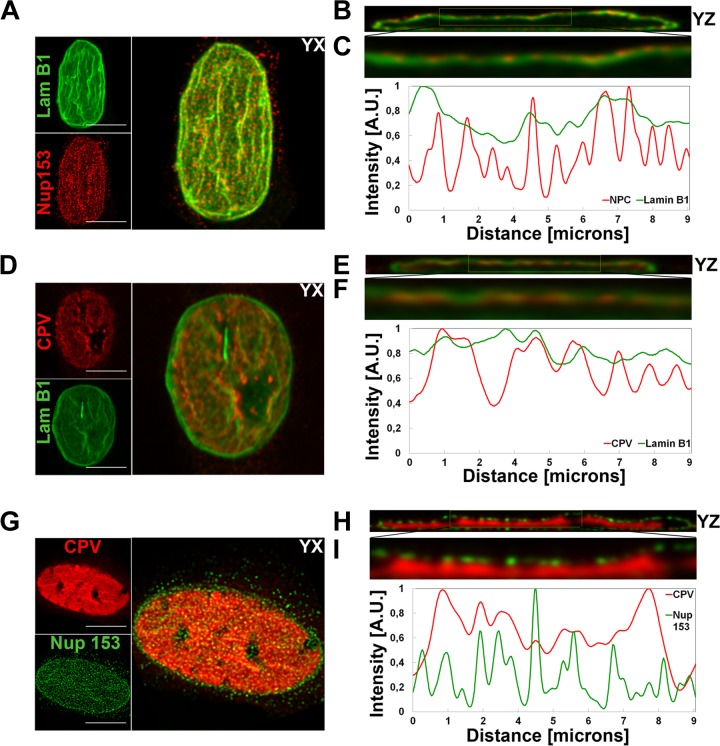
Intranuclear localization of lamin B1, NPCs, and viral capsids. Confocal microscopy-derived apical maximum-intensity projections are visualized with yz cross sections showing intranuclear distribution of NPCs (red) and lamin B1 (green) (A and B), virus capsids (red) and lamin B1 (green) (D and F), and virus capsids (red) and NPCs (green) (G and H). Capsids, NPC, and lamin B1 were visualized with capsid protein, Nup153, and lamin B1 antibodies. (C, F, and I) Normalized correlative intensity profiles from yz cross-section closeups are shown. Results of fluorescence line profile analysis of the intensity of capsids (red), NPCs (red/green), and lamin B1 (green) in a single optical section through the center of each nucleus are shown beside each image. Analysis was performed with ImageJ and the Plot RGB Profile plugin. A.U., arbitrary units. Bars, 10 μm.
Similar articles
-
Nuclear pore protein TPR associates with lamin B1 and affects nuclear lamina organization and nuclear pore distribution.Cell Mol Life Sci. 2019 Jun;76(11):2199-2216. doi: 10.1007/s00018-019-03037-0. Epub 2019 Feb 14. Cell Mol Life Sci. 2019. PMID: 30762072 Free PMC article.
-
Computational analyses reveal spatial relationships between nuclear pore complexes and specific lamins.J Cell Biol. 2021 Apr 5;220(4):e202007082. doi: 10.1083/jcb.202007082. J Cell Biol. 2021. PMID: 33570570 Free PMC article.
-
Analysis of the VP2 protein gene of canine parvovirus strains from affected dogs in Japan.Res Vet Sci. 2013 Apr;94(2):368-71. doi: 10.1016/j.rvsc.2012.09.013. Epub 2012 Oct 12. Res Vet Sci. 2013. PMID: 23063259
-
Parvovirus infection in domestic companion animals.Vet Clin North Am Small Anim Pract. 2008 Jul;38(4):837-50, viii-ix. doi: 10.1016/j.cvsm.2008.03.008. Vet Clin North Am Small Anim Pract. 2008. PMID: 18501282 Review.
-
The nuclear envelopathies and human diseases.J Biomed Sci. 2009 Oct 22;16(1):96. doi: 10.1186/1423-0127-16-96. J Biomed Sci. 2009. PMID: 19849840 Free PMC article. Review.
Cited by
-
Structural and Mechanical Aberrations of the Nuclear Lamina in Disease.Cells. 2020 Aug 11;9(8):1884. doi: 10.3390/cells9081884. Cells. 2020. PMID: 32796718 Free PMC article. Review.
-
Construction of Nuclear Envelope Shape by a High-Genus Vesicle with Pore-Size Constraint.Biophys J. 2016 Aug 23;111(4):824-831. doi: 10.1016/j.bpj.2016.07.010. Biophys J. 2016. PMID: 27558725 Free PMC article.
-
Nuclear Cytoskeleton in Virus Infection.Int J Mol Sci. 2022 Jan 5;23(1):578. doi: 10.3390/ijms23010578. Int J Mol Sci. 2022. PMID: 35009004 Free PMC article. Review.
-
Cytoplasmic Parvovirus Capsids Recruit Importin Beta for Nuclear Delivery.J Virol. 2020 Jan 31;94(4):e01532-19. doi: 10.1128/JVI.01532-19. Print 2020 Jan 31. J Virol. 2020. PMID: 31748386 Free PMC article.
-
Nuclear envelope budding and its cellular functions.Nucleus. 2023 Dec;14(1):2178184. doi: 10.1080/19491034.2023.2178184. Nucleus. 2023. PMID: 36814098 Free PMC article.
References
Publication types
MeSH terms
Substances
LinkOut - more resources
Full Text Sources
Research Materials
