

Global-scale seasonally resolved black carbon vertical profiles over the Pacific
- PMID: 26311916
- PMCID: PMC4542199
- DOI: 10.1002/2013GL057775
Global-scale seasonally resolved black carbon vertical profiles over the Pacific
Abstract
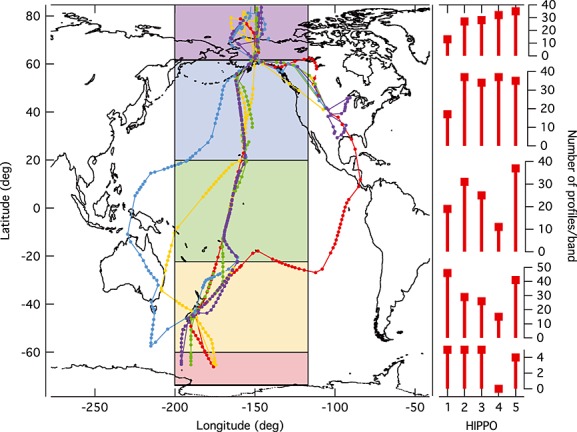
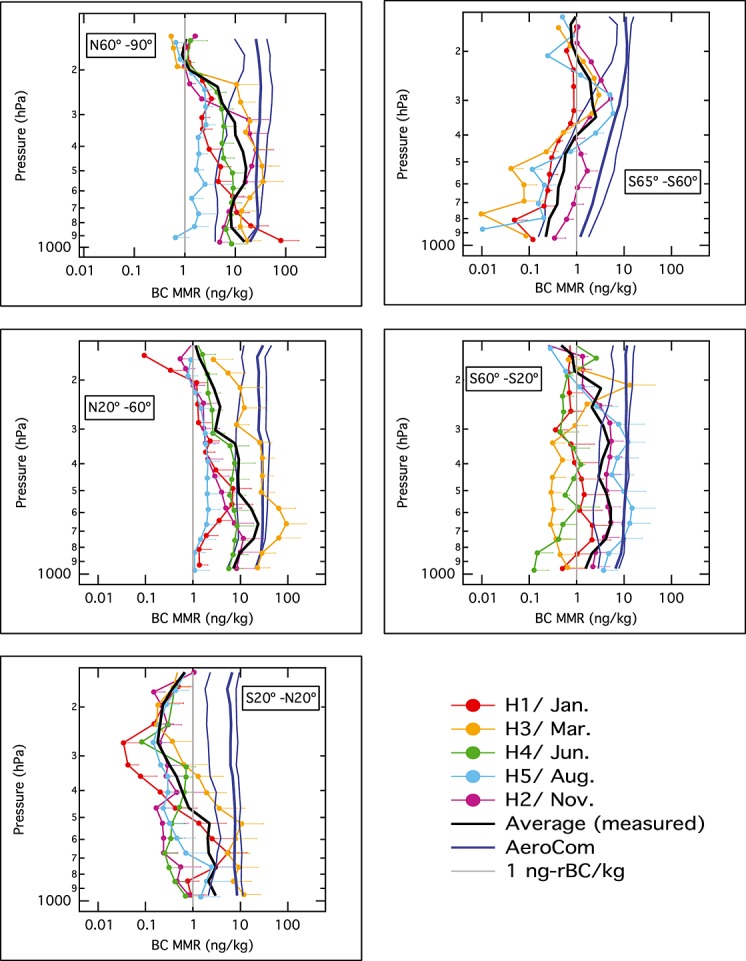
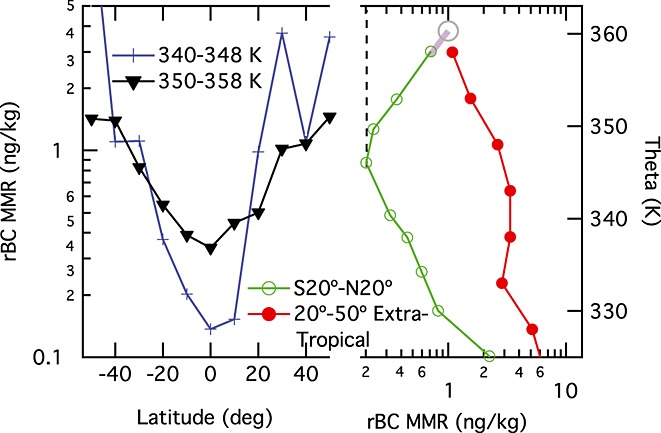
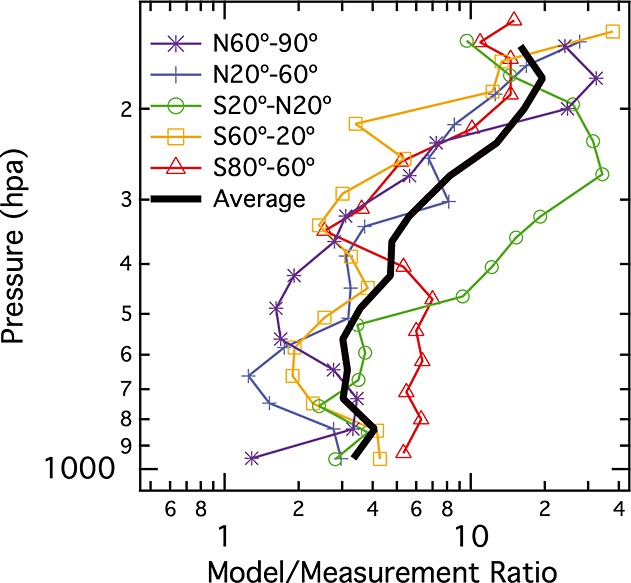
[1] Black carbon (BC) aerosol loadings were measured during the High-performance Instrumented Airborne Platform for Environmental Research Pole-to-Pole Observations (HIPPO) campaign above the remote Pacific from 85°N to 67°S. Over 700 vertical profiles extending from near the surface to max ∼14 km altitude were obtained with a single-particle soot photometer between early 2009 and mid-2011. The data provides a climatology of BC in the remote regions that reveals gradients of BC concentration reflecting global-scale transport and removal of pollution. BC is identified as a sensitive tracer of extratropical mixing into the lower tropical tropopause layer and trends toward surprisingly uniform loadings in the lower stratosphere of ∼1 ng/kg. The climatology is compared to predictions from the AeroCom global model intercomparison initiative. The AeroCom model suite overestimates loads in the upper troposphere/lower stratosphere (∼10×) more severely than at lower altitudes (∼3×), with bias roughly independent of season or geographic location; these results indicate that it overestimates BC lifetime.
Keywords: AeroCom; HIPPO; aerosol; black carbon; remote; tropical tropopause layer.
Figures
References
-
- Bond TC. Bounding the role of black carbon in the climate system: A scientific assessment. J. Geophys. Res. Atmos. 2013;118:5380–5552. doi: 10.1002/jgrd.50171. - DOI
-
- Fan S-M, Schwarz JP, Liu J, Fahey DW, Ginoux P, Horowitz LW, Levy H, II, Ming Y, Spackman JR. Inferring ice formation processes from global-scale black carbon profiles observed in the remote atmosphere and model simulations. J. Geophys. Res. 2012;117 D23205, doi: 10.1029/2012JD018126. - DOI
-
- Folkins I, Martin RV. The vertical structure of tropical convection and its impact on the budgets of water vapor and ozone. J. Atmos. Sci. 2005;62:1560–1573.
-
- Kipling Z, Stier P, Schwarz JP, Perring AE, Spackman JR, Mann GW, Johnson CE, Telford PJ. Constraints on aerosol processes in climate models from vertically resolved aircraft observations of black carbon. Atmos. Chem. Phys. 2013;13:5969–5986. doi: 10.5194/acp-13-5969-2013. - DOI
-
- Koch D. Evaluation of black carbon estimations in global aerosol models. Atmos. Chem. Phys. 2009;9:9001–9026.
LinkOut - more resources
Full Text Sources
Other Literature Sources