Review
. 2015;1(2):49-59.
doi: 10.1007/s40641-015-0009-3.

Precipitation Extremes Under Climate Change

Affiliations
Review

Precipitation Extremes Under Climate Change

Paul A O'Gorman. Curr Clim Change Rep. 2015.

Abstract

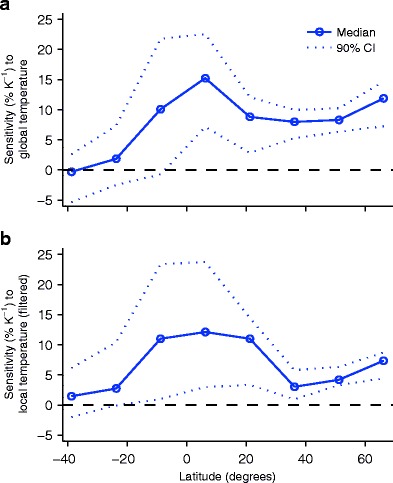
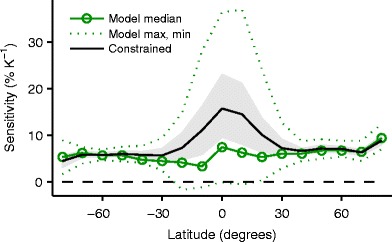
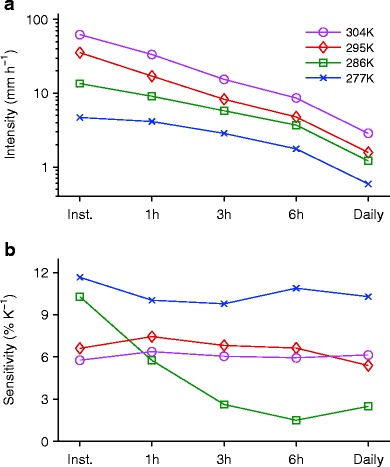
The response of precipitation extremes to climate change is considered using results from theory, modeling, and observations, with a focus on the physical factors that control the response. Observations and simulations with climate models show that precipitation extremes intensify in response to a warming climate. However, the sensitivity of precipitation extremes to warming remains uncertain when convection is important, and it may be higher in the tropics than the extratropics. Several physical contributions govern the response of precipitation extremes. The thermodynamic contribution is robust and well understood, but theoretical understanding of the microphysical and dynamical contributions is still being developed. Orographic precipitation extremes and snowfall extremes respond differently from other precipitation extremes and require particular attention. Outstanding research challenges include the influence of mesoscale convective organization, the dependence on the duration considered, and the need to better constrain the sensitivity of tropical precipitation extremes to warming.

Keywords: Climate models; Convection; Extremes; Global warming; Orographic precipitation; Rainfall; Snowfall.


Figures

Fig 1
Fig 1
Sensitivities of observed annual-maximum daily precipitation over land (solid lines with circles; dotted lines show the 90 % confidence interval) in 15° latitude bands relative to a global-mean surface temperature or b mean surface temperature over the 15° latitude band. Precipitation is from HadEX2, sensitivities are calculated for grid boxes with at least 30 annual values, and the median sensitivity is plotted for each 15° latitude band. Temperatures are over land and ocean from NOAA MLOST, and for b the temperature time series were smoothed with a 9-year running-mean filter
Fig 2
Fig 2
Sensitivity of the 99.9th percentile of daily precipitation to global-mean surface temperature for climate change under the RCP8.5 scenario in CMIP5 global climate-model simulations. Shown are the multimodel median (green line with circles) and the full model range (dotted lines). Also shown are sensitivities inferred by constraining the model sensitivities using observations of tropical variability (black line) with a 90 % confidence interval obtained by bootstrapping as in [58] (gray shading)
Fig 3
Fig 3
a The 99.99th percentile of precipitation for different durations (instantaneous, 1 h, 3 h, 6 h, and daily) in simulations of radiative-convective equilibrium with a cloud-system resolving model at selected mean surface-air temperatures as given in the legend. b The sensitivity of the 99.99th percentile of precipitation to mean surface air temperature changes for the same temperatures shown in (a). The natural logarithm of the 99.99th percentile of precipitation as a function of mean surface-air temperature from ten simulations is linearly interpolated to a uniform grid in temperature and sensitivities (% K−1) are calculated as the change for a 3-K warming

Similar articles

Cited by

References

    1. Alexander LV, Zhang X, Peterson TC, Caesar J, Gleason B, Klein Tank AMG, et al. Global observed changes in daily climate extremes of temperature and precipitation. J Geophys Res Atmos. 2006;111:D05109. doi: 10.1029/2005JE002462. - DOI
    1. Allan RP, Soden BJ. Atmospheric warming and the amplification of precipitation extremes. Science. 2008;321:1481–1484. doi: 10.1126/science.1160787. - DOI - PubMed
    1. Allan RP, Soden BJ, John VO, Ingram W, Good P. Current changes in tropical precipitation. Environ Res Lett. 2010;5:025205. doi: 10.1088/1748-9326/5/2/025205. - DOI
    1. Allen MR, Ingram WJ. Constraints on future changes in climate and the hydrologic cycle. Nature. 2002;419:224–232. doi: 10.1038/nature01092. - DOI - PubMed
    1. Arnold NP, Kuang Z, Tziperman E. Enhanced MJO-like variability at high SST. J Clim. 2013;26:988–1001. doi: 10.1175/JCLI-D-12-00272.1. - DOI

LinkOut - more resources