

Review
doi: 10.1021/acs.chemrev.5b00321.
Epub 2015 Aug 27.
Nanoparticle Probes for the Detection of Cancer Biomarkers, Cells, and Tissues by Fluorescence
Affiliations
- PMID: 26313138
- PMCID: PMC5457709
- DOI: 10.1021/acs.chemrev.5b00321
Item in Clipboard
Review
Nanoparticle Probes for the Detection of Cancer Biomarkers, Cells, and Tissues by Fluorescence
Chem Rev.
.
Abstract
Conflict of interest statement
The authors declare the following competing financial interest(s): C.A.M. is a cofounder of AuraSense, LLC, a startup biotechnology company that licenses the NanoFlare technology from Northwestern University.
Figures
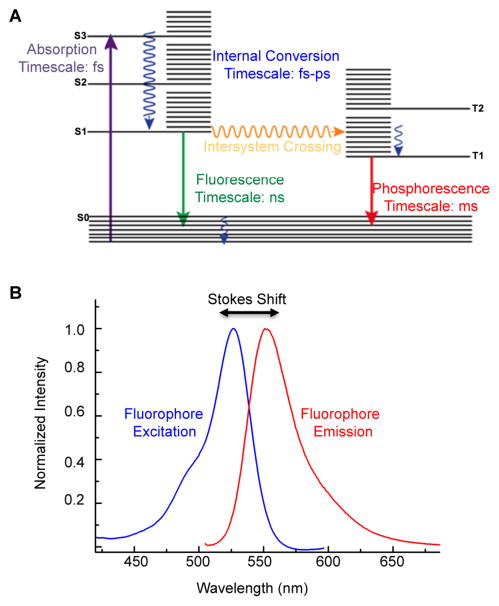
(A) Jablonski diagram including typical time scales of photophysical processes for organic molecules. (B) Molecular fluorescence spectrum illustrating the broadening of the spectral lines due to the presence of vibrational energy levels, and the Stokes shift between the excitation and emission maxima. Adapted from ref . Copyright 2010 American Chemical Society.
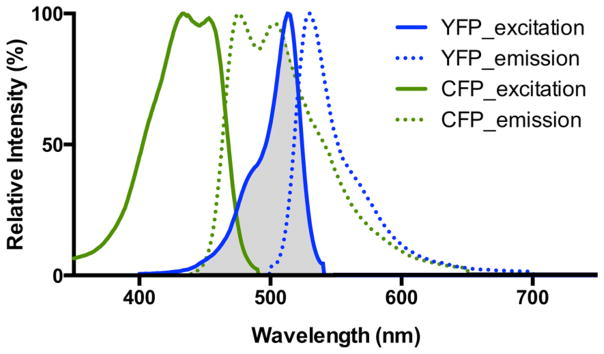
Emission and excitation spectra of CYP and YFP, a commonly used FRET pair, with the spectral overlap shown in gray.
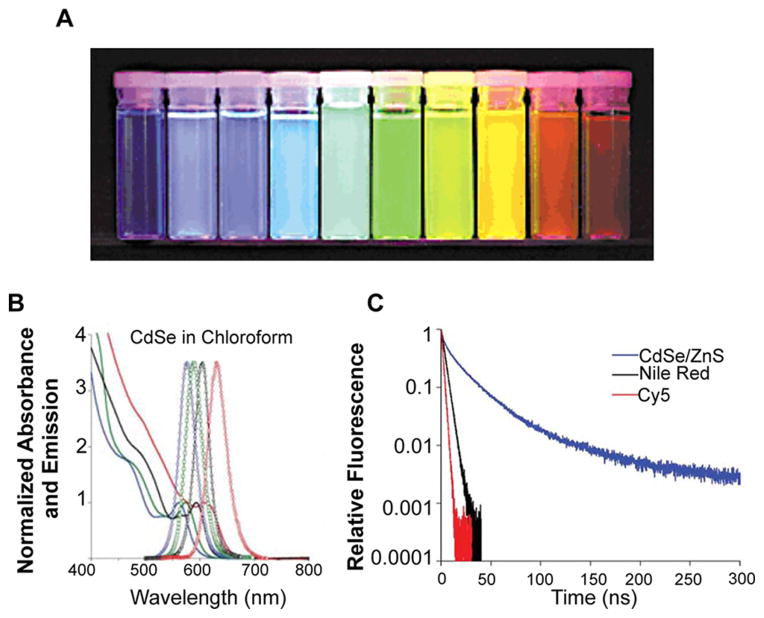
(A) Increasing QD size results in a red shift in QD emission: ZnS-capped CdSe QDs of varying size with emission maxima ranging from 443 to 655 nm. Samples were excited with a near-UV lamp. (B) Representative CdSe QD absorption (represented by lines) and emission profiles (represented by circles). QD size increases from left to right, resulting in red-shifted emission. Note the broad absorption. (C) Fluorescence lifetime of CdS/ZnS QD compared to organic dyes Nile Red and Cy5. (A) Reprinted with permission from ref . Copyright 2001 Macmillan Publishers Ltd. (B and C) Reprinted with permission from ref . Copyright 2008 Macmillan Publishers Ltd.
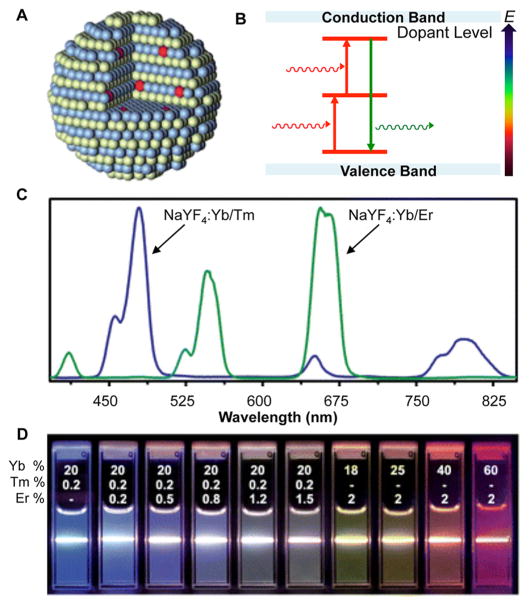
(A) Schematic representation of rare earth element crystalline host with Ln3+ dopant (red). (B) Two-photon excitation mechanisms common in UCNPs result in the release of a photon of higher energy and an anti-Stokes shift. (C) Emission spectra of NaYF4:Yb/Tm compared to NaYF4:Yb/Er demonstrates the composition-dependent emission profiles of UCNPs. (D) Luminescent photos showing colloidal solutions of UCNPs doped with varying ratios of Yb, Tm, and Er are excited at 980 nm with a 600 mW diode laser. The different colors represent changes in the emission spectra. (A and B) Reprinted with permission from ref . Copyright 2010 The Royal Society of Chemistry. (C and D) Adapted from ref . Copyright 2008 American Chemical Society.
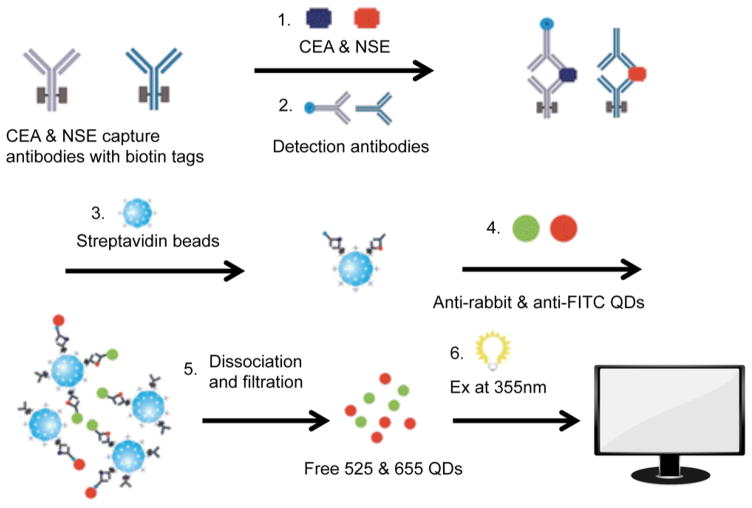
Homogenous in-solution sandwich assay for detecting CEA and NSE. (1, 2) Biotinylated capture antibodies and QD-functionalized detection antibodies against each biomarker bind the analyte of interest to form a sandwich. (3) Streptavidin beads are then used to capture the in-solution sandwich constructs. (5, 6) Finally, QDs are freed from the sandwich, and detected using a plate reader (fluorophore excitation at 355 nm). Adapted with permission from ref . Copyright 2011 The Royal Society of Chemistry.
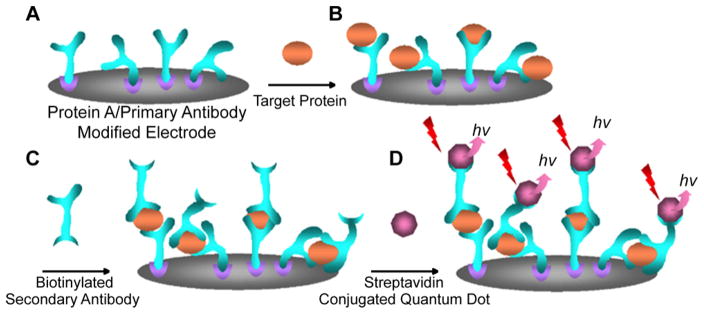
Scheme for a QD immunosensor utilized to detect TPSA. (A) Protein A and an anti-TPSA antibody are immobilized onto a screen-printed carbon substrate. (B) Upon introduction to the sensor, the analyte binds to the capture antibody and (C) a biotinylated a second antibody. (D) Streptavidin functionalized QDs sandwich the analyte onto the sensor, and produce fluorescence with an emission at 525 nm. Adapted with permission from ref . Copyright 2007 Elsevier.
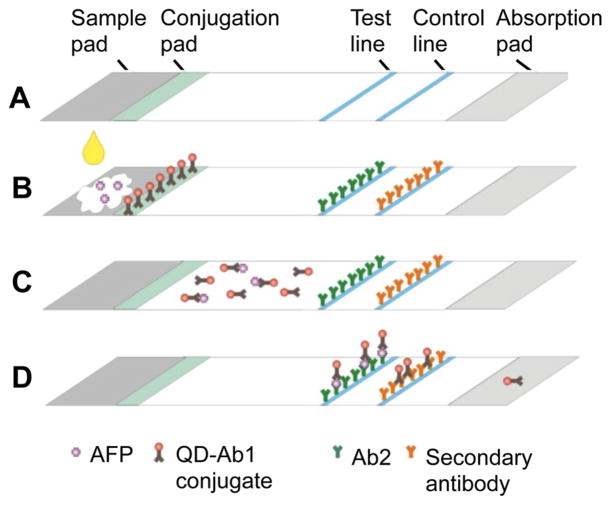
(A) Immunochromatography test strip for AFP detection. (B) AFP-containing sample is loaded onto the sample pad, and binds QD antibodies (QD-Ab1 conjugates) on the conjugation pad. (C) Next, AFP-QD-Ab1 travels to the test line and binds to immobilized anti-AFP antibodies. (D) Unbound QD-Ab1 conjugates bind to a secondary antibody. Fluorescence along the test and control line is quantified using a fluorescence reader. Adapted with permission from ref . Copyright 2011 Elsevier.
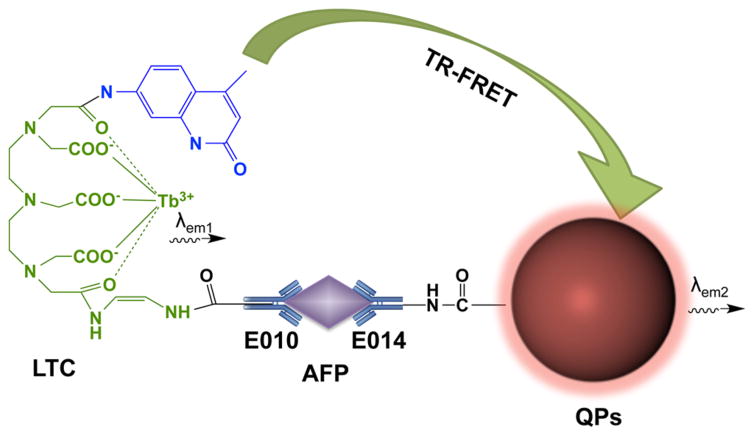
In-solution FRET fluoroimmunoassay to detect AFP. QDs are incorporated onto the surface of polymeric microparticles (QPs) that are conjugated to an anti-AFP antibody. Luminescent terbium chelates (LTC) are also conjugated to an anti-AFP antibody, and in the presence of AFP, the target is sandwiched, and brings the QDs and LTC in close proximity to each other, initiating FRET. Adapted with permission from ref . Copyright 2012 Elsevier.
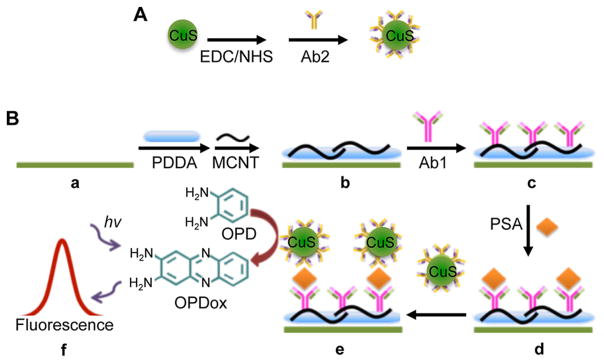
Multiwalled carbon nanotube (MCNT) immunosensor for PSA detection. (A) First, CuS QDs are functionalized with an anti-PSA antibody while (B) (a–c) ITO substrates are functionalized with carbon nanotubes and poly(diallyldimethylammonium chloride) (PDDA) before anti-PSA capture antibodies are immobilized to the surface. (B) (d, e) Next, the anti-PSA capture antibodies and the CuS QDs sandwich PSA, resulting in the oxidation of o-phenylenediamine (OPD) to 2,3-diaminophenazine (OPDox), thus producing a fluorescence signal. Adapted with permission from ref . Copyright 2014 The Royal Society of Chemistry.
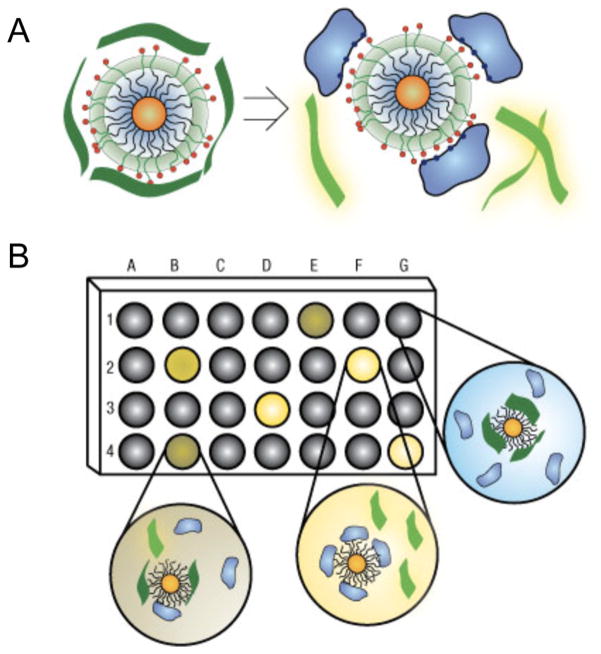
Schematic representation of a nanoparticle probe for the detection of various cancer biomarkers. (A) This in-solution assay uses a library of AuNPs capped with various cationic functional groups that is then coated with an electrostatically associated fluorophore-labeled polymer (poly(p-phenyleneethynylene) or PPE). In the absence of target, the AuNP quenches the fluorescence of the fluorophore, and the sensor is in an “off state.” Binding of various proteins to the AuNP can trigger the dissociation of PPE from the nanoparticle, resulting in a fluorescence enhancement and the transition of the nanoparticle probe to an “on state”. (B) In a typical experiment, one AuNP from a library is contained within each of the wells of a microplate, and a protein sample is added to each well. Due to the differences in the surface charge of various proteins, the biomarkers that are analyzed bind to each of the AuNPs in the library to varying extents, thereby generating a unique “fingerprint” that enables their differentiation through fluorescence spectroscopy. Reprinted with permission from ref . Copyright 2007 Macmillan Publishers Ltd.
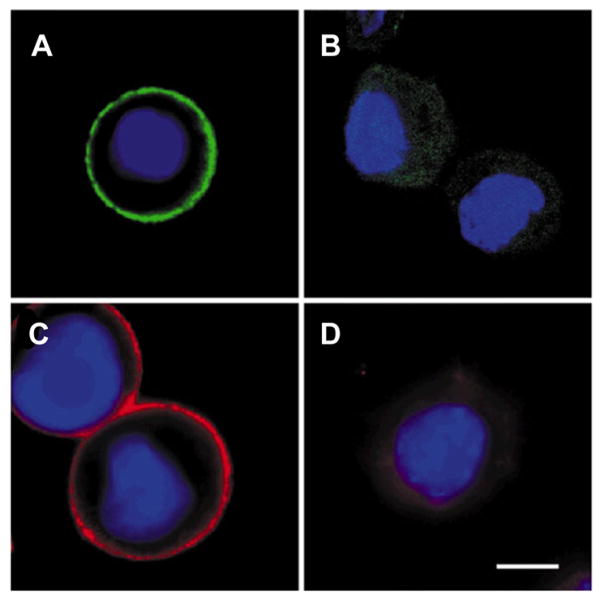
(A, C) Fixed breast cancer SK-BR-3 cells labeled with anti-Her2 535-nm-emitting QDs and anti-Her2 630-nm-emitting QDs. (B, D) SK-BR-3 cells treated with IgG coated 535-nm-emitting QDs and 630-nm-emitting QDs were not specifically labeled. Cell nuclei were stained with Hoechst 33342 (blue), and the scale bar represents 10 μm. Adapted with permission from ref . Copyright 2003 Macmillan Publishers Ltd.
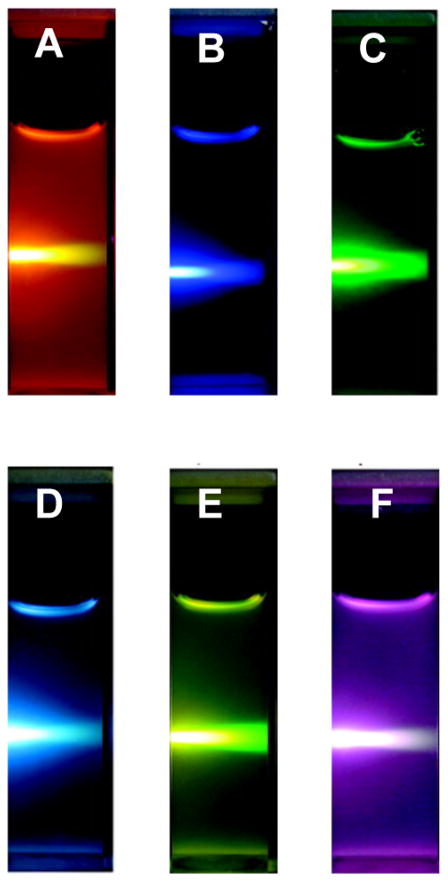
Photographs of 1 wt% colloidal solutions of NaYbF4:Er/Tm/Ho upconversion nanoparticles of (A) NaYbF4:2% Er, (B) NaYbF4:2% Tm, (C) NaYbF4:2% Ho, (D) NaYbF4:1% Tm, 1% Ho, (E) NaYbF4:1% Er, 1% Ho, and (F) NaYbF4:1% Er, 1% Tm excited with 980 nm near-infrared light. Despite their differing emission profiles (as seen by the different colors in the photographs), all samples can be excited with the same wavelength of near-infrared light. Adapted from ref . Copyright 2009 American Chemical Society.
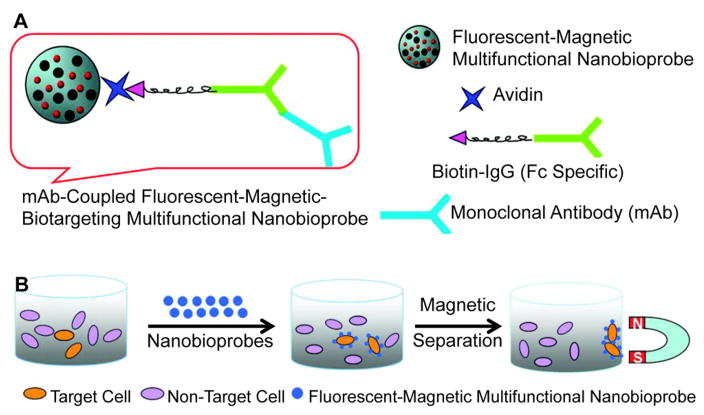
Fluorescent magnetic bifunctional nanoparticles (FMBNs) used in the simultaneous fluorescence detection and magnetic isolation of target cancer cells. (A) FMBNs consist of CdSe/ZnS core/shell QDs and Fe2O3 nanoparticles that are encapsulated in a copolymer nanosphere. Biotinylated monoclonal antibodies against a target protein are recognized by the avidin-conjugated FMBNs through avidin–biotin interactions. (B) Upon binding of the FMBNs to target cells, magnetic separation may be performed to isolate the cancer cells that express the cell surface marker of interest. Adapted from ref . Copyright 2011 American Chemical Society.
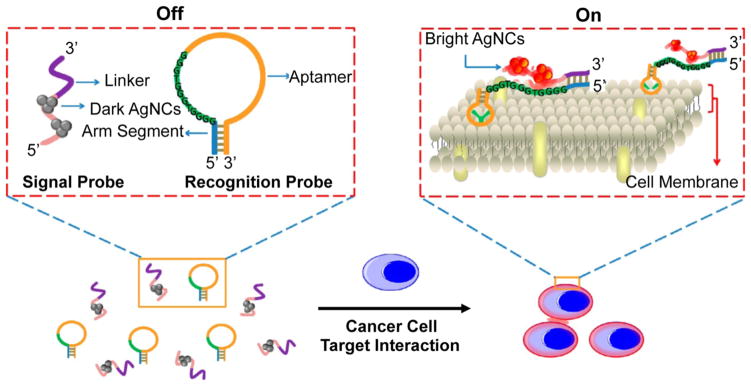
Schematic representation of silver nanoclusters (AgNCs) used in the detection of CCRF-CEM acute leukemia cells. In the “off state”, the system consists of two DNA strands: the “signal probe” which is tethered to AgNCs that are not fluorescent and a linker region that is complementary to the arm segment of the “recognition probe”. Upon binding of the scg8c aptamer region of the recognition probe to CCRF-CEM cells, the arm segment is exposed, enabling the hybridization of the signal probe and the recognition probe. This brings the AgNCs in close proximity of the G-rich segment of the recognition probe, leading to enhanced AgNC fluorescence in the “on” state. Adapted from ref . Copyright 2013 American Chemical Society.
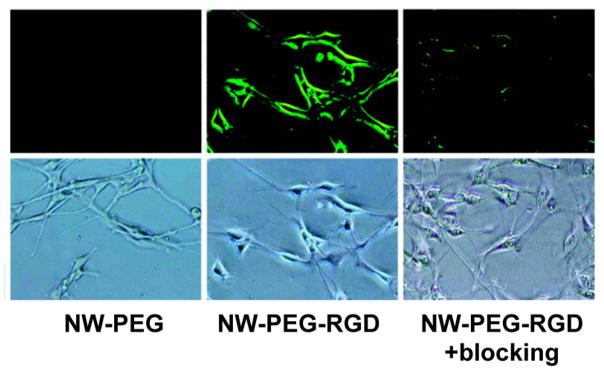
RGD peptide functionalized ZnO nanowires (NW-PEG-RGD) were used to selectively label integrin αvβ3 in U87MG glioblastoma cells. Cells were treated with either PEGylated ZnO nanowires (NW-PEG) or NW-PEG-RGD. As a control, integrin αvβ3 was also blocked on U87MG cells by pretreating with cyclic RGDYK peptide, resulting in decreased labeling of the U87MG cells. Note that images were taken under 200× magnification. Adapted from ref . Copyright 2011 American Chemical Society.
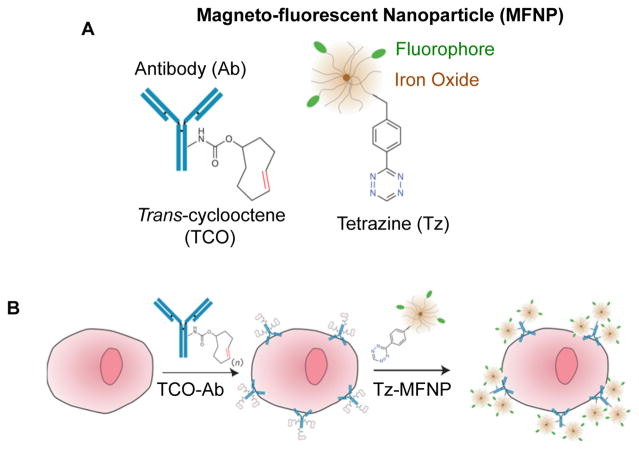
(A) Schematic representation of a tetrazine-labeled magnetofluorescent nanoparticle (MFNP) and a trans-cyclooctene (TCO)-functionalized antibody used in the detection of cancer cells. (B) Cells are first treated with the TCO-Ab and then treated with MFNPs, which react in cell culture conditions to fluorophore-label cells expressing the target of interest. Adapted with permission from ref . Copyright 2010 Macmillan Publishers Ltd.
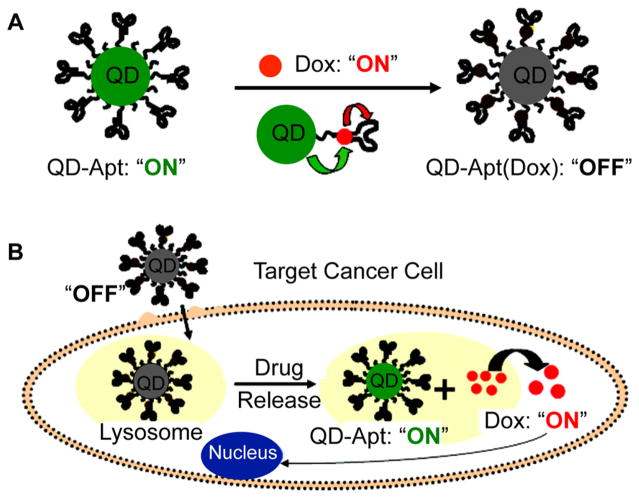
Schematic representation of aptamer-functionalized QDs for combined cancer cell imaging and therapy. (A) Doxorubicin (Dox) is intercalated into DNA aptamers bound to the QD probe. (B) Aptamers recognize cell surface markers of a target cancer cell, and once the construct is internalized, Dox is released. Adapted from ref . Copyright 2007 American Chemical Society.
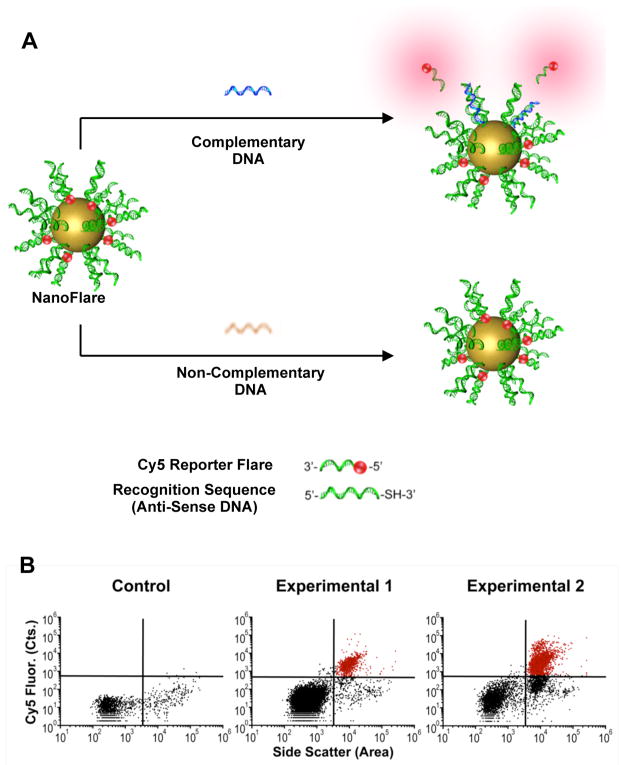
(A) NanoFlares are used in the fluorescence-based detection of intracellular mRNA and consist of thiolated “recognition” antisense DNA adsorbed onto the surface of a spherical AuNP. The “reporter flare,” a shorter complementary DNA with a Cyanine 5 (Cy5) fluorophore, is hybridized to the recognition strand, resulting in the quenching of the Cy5 fluorophore. Upon target binding, the reporter flare is released generating a measurable fluorescence signal. (B) NanoFlares have been shown to enable the detection and isolation of circulating tumor cells from a murine model of triple negative breast cancer. Blood samples from mice with xenografted mCherry labeled MDA-MB-231 tumors were treated with vimentin-targeting NanoFlares, and MDA-MB-231 cells were retrieved based on NanoFlare fluorescence. Representative scatter plots (N = 1 mouse per scatter plot) are shown for a mouse that was not injected with mCherry MDA-MB-231 breast cancer cells (Control) and mice that were injected with mCherry MDA-MB-231 breast cancer cells and developed widespread metastases (Experimental 1 and 2). Cancerous cells are shown in red, and noncancerous cells are shown in black (B). Adapted with permission from ref . Copyright 2014 National Academy of Sciences of the United States of America.
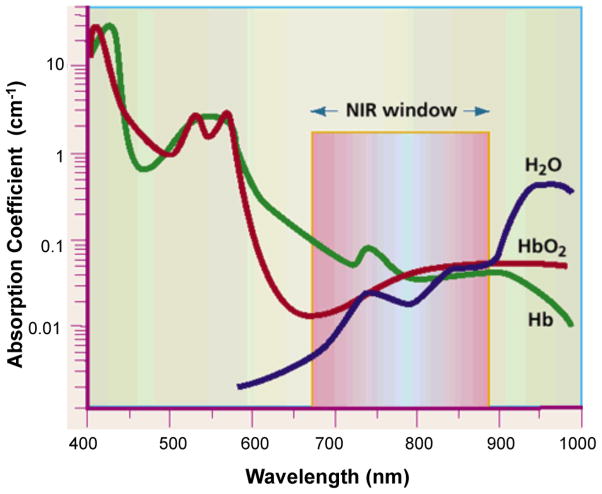
NIR window is optimal for in vivo imaging due to minimal light absorption by hemoglobin (Hb), oxyhemoglobin (HbO2), and water in tissues from 650 to 900 nm. Adapted with permission from ref . Copyright Macmillan Publishers Ltd.
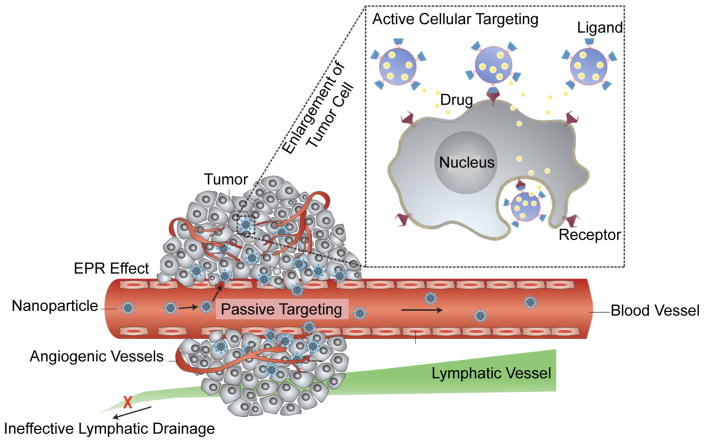
Diagram depicting the enhanced permeability and retention effect displayed by tumor tissue. Due to the leaky tumor vasculature as a result of poor lymphatic drainage, nanoparticles will escape the blood stream and preferentially localize in tumor tissue, also known as passive targeting. Reprinted with permission from ref . Copyright 2007 Macmillan Publishers Ltd.
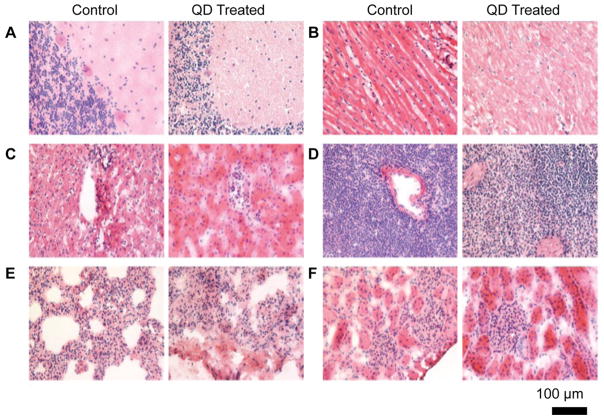
Histological (hematoxylin and eosin staining) analysis of the major organs of nonhuman primates 90 days after injection of phospholipid micelle-encapsulated QDs. Tissues were collected from control (left image) and treated (right image) animals. Tissue analysis shows no significant differences in the (A) brain, (B) heart, (C) liver, (D) spleen, (E) kidneys, or (F) lymph nodes. Reprinted with permission from ref . Copyright 2012 Macmillan Publishers Ltd.
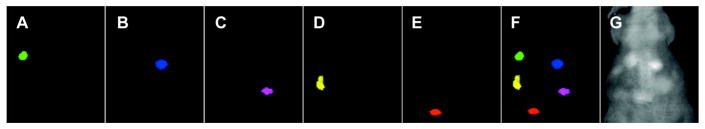
Upconversion nanoparticles with varying emission profiles for multicolor in vivo imaging. (A) NaYF4:Yb,Er, (B) NaYF4:Yb,Er–rhodium B, (C) NaYF4:Yb,Er–rhodium 6G, (D) NaYF4:Yb,Er–Tide Quencher 1, and (E) NaYF4:ErTm upconversion nanoparticles subcutaneously injected into the back of a nude mouse. (F) Fluorescence merge of the upconversion nanoparticles and (G) white light image. Adapted from ref . Copyright 2011 American Chemical Society.
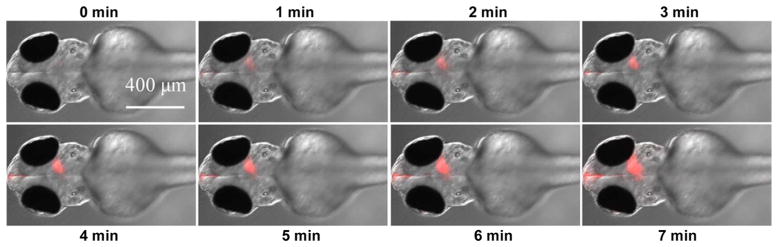
Zebrafish embryo induced with cerebral hypoxia imaged using an UCNP sensor for low oxygen detection. Zebrafish embryos were injected with UCNP sensors via intracerebral microinjection prior to treatment with 2,3-butanedione monoxime (BDM) to induce cerebral hypoxia. The increase in fluorescence intensity from the cranium 0–7 min post BDM treatment indicates the decrease in oxygen. Adapted from ref . Copyright 2014 American Chemical Society.
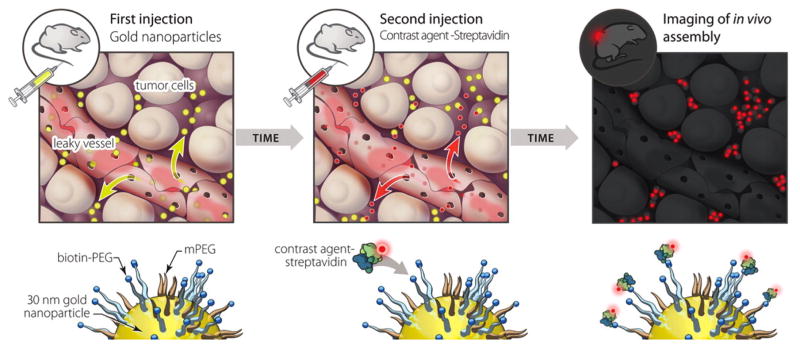
Schematic representation of AuNP “anchors” for in vivo tumor imaging. Biotinylated AuNPs are injected into mice and passively accumulate in target tumor tissue before streptavidin-fluorophore is injected to fluorophore-label the AuNPs in vivo. Reprinted with permission from ref . Copyright 2010 National Academy of Sciences of the United States of America.
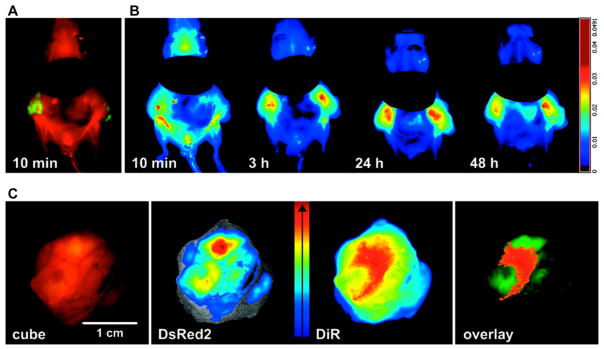
(A) Image of xenografted mouse 10 min post injection with DiR-encapsulating PEG–PLA nanoparticles (red) illustrates location of DsRed2 labeled HT29 tumors (green). (B) Time course of DiR fluorescence from 10 min to 48 h post injection of PEG–PLA nanoparticles. (C) Ex vivo imaging of excised tumor demonstrates colocalization of DsRed2 labeled HT29 tumors and DiR from PEG–PLA nanoparticles. Adapted from ref . Copyright 2011 American Chemical Society.
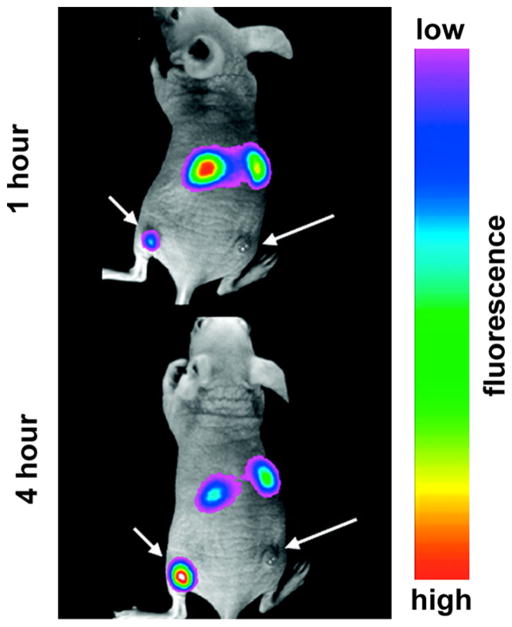
Nude mouse with subcutaneous U87MG xenograft tumor (left hind leg, short arrow) and MCF7 xenograft tumor (right hind leg, long arrow) imaged 1 (top) and 4 (bottom) h post intravenous injection with RGD labeled UCNPs. UCNP accumulation is higher in the U87MG tumor as compared to the MCF7 tumor, due to active targeting of integrin αvβ3. Adapted from ref . Copyright 2009 American Chemical Society.
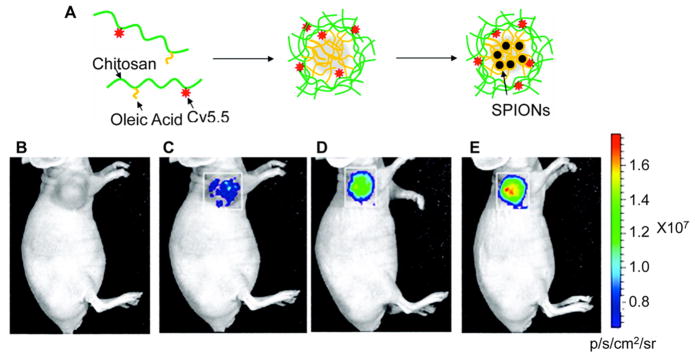
(A) Schematic representation of the synthesis of superparamagnetic iron oxide nanoparticle (SPION) encapsulated in chitosan nanoparticles labeled with Cy5.5. (B) U87MG tumor-bearing mice (B) preinjection, and (C) 1, (D) 3, and (E) 5 h post injection of SPION-loaded Cy5.5-labeled chitosan nanoparticles. Adapted from ref . Copyright 2011 American Chemical Society.
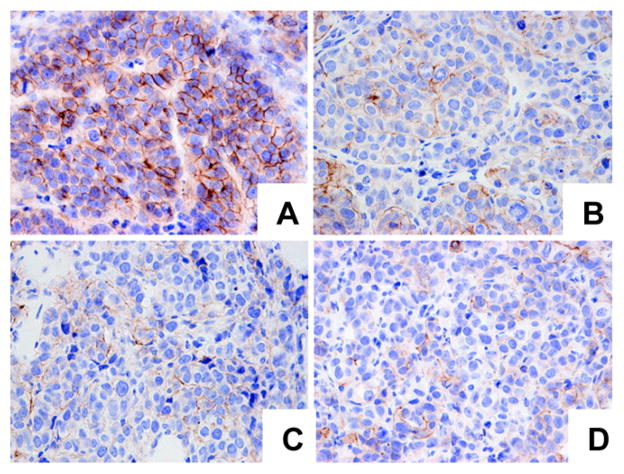
Theranostic trastuzumab-conjugated UCNPs are targeted to tumor tissue via active Her2 recognition. The magnetofluorescence of the UCNPs allows for diagnostic imaging, while trastuzumab results in therapeutic down-regulation of Her2. Immunohistochemical analysis of Her2 expression in tumor sections from MCF7 xenografted mice (A) prior to intravenous injection with trastuzumab-conjugated UCNPs, (B) 5 h post injection, (C) 24 h post injection, and (D) 1 week post injection. Note that brown staining corresponds to Her2 while blue represents cell nuclei, and that the images were taken under 40× magnification. Adapted from ref . Copyright 2011 American Chemical Society.
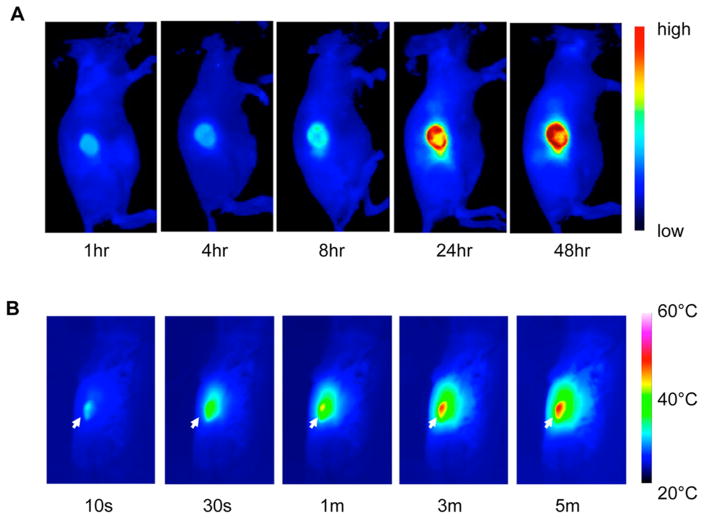
Cy5 labeled PEDOT:PSS passively target 4T1 tumors. (A) Fluorescence images 1–48 h post intravenous administration. (B) Tissue temperature with 10 s to 5 min of laser irradiation. Tumor location is indicated by the arrow. Adapted from ref . Copyright 2012 American Chemical Society.
References
-
- DeSantis CE, Lin CC, Mariotto AB, Siegel RL, Stein KD, Kramer JL, Alteri R, Robbins AS, Jemal A. Cancer Treatment and Survivorship Statistics, 2014. Ca-Cancer J Clin. 2014;64:252–271. - PubMed
-
- World Health Organization. 2014 www.who.int.
-
- Siegel R, Ma J, Zou Z, Jemal A. Cancer Statistics, 2014. Ca-Cancer J Clin. 2014;64:9–29. - PubMed
-
- Hanahan D, Weinberg RA. The Hallmarks of Cancer. Cell. 2000;100:57–70. - PubMed
-
- Hanahan D, Weinberg RA. Hallmarks of Cancer: The Next Generation. Cell. 2011;144:646–674. - PubMed
Publication types
MeSH terms
Substances
Grants and funding
LinkOut - more resources
Full Text Sources
Other Literature Sources
