. 2015 Nov;31(9):570-84.
doi: 10.1089/jop.2014.0076. Epub 2015 Aug 27.

2-Phenyl-APB-144-Induced Retinal Pigment Epithelium Degeneration and Its Underlying Mechanisms

Affiliations

2-Phenyl-APB-144-Induced Retinal Pigment Epithelium Degeneration and Its Underlying Mechanisms

Shin-ichiro Hirai et al. J Ocul Pharmacol Ther. 2015 Nov.

Abstract

Purpose: To investigate the efficacy of 2-phenyl-APB-144 (APB)-induced retinopathy in a rat model and its underlying mechanisms, with a particular focus on retinal pigment epithelium (RPE) degeneration.

Methods: Electroretinograms (ERGs) were evaluated in APB-administered rats. In ARPE-19 cells, cathepsin, and autophagy marker LC3 were analyzed by western blotting or immunohistochemistry. Organelle pH alterations were detected by Acridine Orange Staining. Endoplasmic reticulum stress-dependent or -independent cell death signaling was analyzed by reporter gene assays of activating transcription factor 4 (ATF4), immunoglobulin heavy-chain binding protein (BiP), inositol-requiring enzyme 1α (IRE1α), quantitative reverse transcription-polymerase chain reaction of CHOP mRNA, and the effects of pharmacological eukaryotic initiation factor 2α (eIF2α) dephosphorylation inhibitor, Salubrinal. The pharmacological effects of Salubrinal were examined by fluorophotometry, electrophysiology, and histopathology.

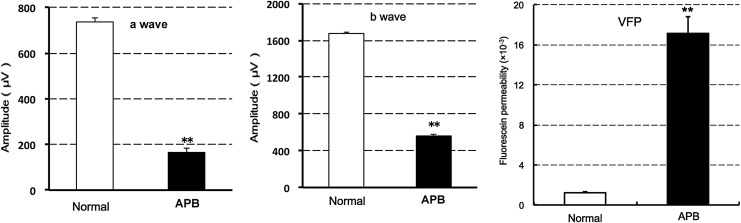
Results: APB-induced ERG amplitude reduction and fluorescein permeability enhancement into the vitreous body of rats were determined. In ARPE-19 cells, APB-induced organelle pH alterations, imbalances of procathepsin and cathepsin expression, the time-dependent accumulation of LC3-II, and the translational activation of ATF4 were determined. Salubrinal protected against APB-induced cell death and inhibited ATF4 downstream factor CHOP mRNA induction. In APB-induced rat retinopathy, systemic Salubrinal alleviated the enhanced fluorescein permeability into the vitreous body from the RPE, the reductions in ERG amplitudes, and RPE degeneration.

Conclusions: Organelle pH alterations and autophagy impairments are involved in APB-induced RPE cell death. Inhibition of eIF2α dephosphorylation protected the RPE in vivo and in vitro. These findings suggested that APB-induced retinopathy is a valuable animal model for exploring the mechanism of RPE-driven retinopathy.


Figures

<b>FIG. 1.</b>
FIG. 1.
Chemical structure of 2-phenyl-APB-144 (APB).
<b>FIG. 2.</b>
FIG. 2.
Effects of systemic APB on ERG a- and b-wave amplitudes and fluorescein permeability into the vitreous body in rats. After oral administration of 40 mg/kg APB, ERG a- and b-waves were evaluated at 7 days (left and middle graphs), and fluorescein permeability was evaluated by vitreous fluorophotometry (VFP) at 8 days after administration (right graph). The data represent mean ± SE (n = 8 eyes in 4 animals). **P < 0.01 versus normal rats, as assessed by Student's t-test. ERG, electroretinogram.
<b>FIG. 3.</b>
FIG. 3.
(A) Time and concentration dependency of APB-induced cell death in ARPE-19 cells. Cells were treated with 0–100 μM APB for 3, 6, and 24 h. After 24 h of treatment, in particular, APB shows concentration-dependent cell death at 50–100 μM. The cell viability was assessed by WST-8 assays. The data represent the percent changes relative to the value at time 0 (mean ± SE, n = 3). (B) Acridine Orange staining of ARPE-19 cells treated with 100 μM APB or 100 nM bafilomycin for 6 h. Note that granular green staining is reduced in both APB- and bafilomycin-treated cells, compared with untreated control cells, in the merged photographs. Hoechst: nuclear staining. AO: Acridine Orange staining. Merge: merged photographs of Hoechst and Acridine Orange staining. Scale Bar: 10 μm. (C) Intensity of Acridine Orange staining in APB- and bafilomycin-treated cells. Note that the intensity is significantly higher in control cells, compared with APB- and bafilomycin-treated cells. **P < 0.01 versus control, as assessed by Student's t-test. The data represent mean ± SE (n = 50 cells). (D) Western blot analyses of procathepsin and cathepsin D, L in APB- and bafilomycin-treated ARPE-19 cells. Cells were treated with 100 μM APB or 100 nM bafilomycin for 0, 3, 6, 12, 18, and 24 h. The numbers on the right indicate approximate molecular weights (kDa). (E) Expression level analyses of procathepsin/cathepsin ratios in ARPE-19 cells treated with 100 μM APB or 100 nM bafilomycin for 0, 3, 6, 12, 18, and 24 h. **P < 0.01, *P < 0.05 versus 0-h sample, as assessed by Student's t-test. The data represent mean ± SE (n = 3). Baf, bafilomycin.
<b>FIG. 4.</b>
FIG. 4.
(A) Western blot analyses of LC3-I and LC3-II in ARPE-19 cells treated with EBSS (starvation) for 3 h, and with 100 μM APB or 100 nM bafilomycin for 0, 3, 6, 12, 18, and 24 h. (B) Expression level analyses of LC3-II in ARPE-19 cells treated with EBSS (starvation) for 3 h, and with 100 μM APB or 100 nM bafilomycin for 0, 3, 6, 12, 18, and 24 h. The expression level of LC3-II was normalized by that of β-actin. **P < 0.01, *P < 0.05 versus 0-h sample, as assessed by Student's t-test. The data represent mean ± SE (n = 3). (C) Immunohistochemical localization of LC3 in ARPE-19 cells under starvation conditions (EBSS) and APB or Baf treatment for 12 h. Note the positive punctuate staining of fluorescein in starved, APB-treated, and bafilomycin-treated cells, compared with untreated control cells, in the merged photographs. DAPI: nuclear staining. LC3: immunostaining with an anti-LC3 antibody. Merge: merged photographs of DAPI and LC3 immunostaining. Scale Bar: 10 μm. (D) LC3-immunopositive punctate spots in ARPE-19 cells treated with EBSS (starvation), 100 μM APB, or 100 nM bafilomycin (Baf) for 12 h. Note that the numbers of punctuate spots are significantly larger in cells treated with EBSS, APB, or bafilomycin, compared with control cells. **P < 0.01 versus control sample, as assessed by Student's t-test. The data represent mean ± SE (n = 50 cells). EBSS, Earle's balanced salt solution.
<b>FIG. 5.</b>
FIG. 5.
Time courses of human BiP, IRE1α, and ATF4 reporter activities after APB treatment evaluated by luciferase assays. Note that ATF4 translational activity increases in a time-dependent manner. ARPE-19 cells were transiently transfected with pGL3-hBiP pro.-132 (BiP), pTKX-ERAI-Luc (IRE1α), pCAX-hATF4(1-285)-hRL-HA (ATF4), and pRL-SV40. After transfections, the cells were treated with 100 μM APB for 0, 3, 6, 9, and 24 h. The data represent the percent changes relative to the value at time 0 (mean ± SE, n = 3). ATF4, activating transcription factor 4; BiP, binding protein; IRE1α, inositol-requiring enzyme 1α.
<b>FIG. 6.</b>
FIG. 6.
(A) Effects of Salubrinal, z-VAD-fmk, AEBSF, and NAC on APB-induced ARPE-19 cell viability. Note that 100 μM Salubrinal significantly protects against APB-induced cell death (top and middle graphs). The cells were treated with 100 μM APB and the indicated test substances. After 24 h of treatment, the cell viability was evaluated by WST-8 assays. The data represent the percentages relative to the value in untreated cells set as 100% (mean ± SE, n = 4). **P < 0.01 versus vehicle, as assessed by the Dunnett's multiple comparison test. (B) Effect of Salubrinal on CHOP mRNA induction in APB-treated ARPE-19 cells (bottom graph). Note the significant inhibition of CHOP mRNA expression by Salubrinal. The cells were treated with vehicle or Salubrinal for 6 h. After the treatment, total RNA was extracted, amplified with primers corresponding to human CHOP, and quantified by ΔΔCT analysis. The values were normalized to the expression levels of GAPDH. The data represent the mean ± SE of 3–4 samples. $$P < 0.01 versus control cells, P < 0.05 versus vehicle (APB-treated cells only) as assessed by the Student's t-test. AEBSF, 4-(2-aminoethyl)benzenesulfonyl fluoride hydrochloride; NAC, N-acetyl cysteine.
<b>FIG. 7.</b>
FIG. 7.
Pharmacological effects of systemic Salubrinal on APB-induced retinopathy. After oral administration of 40 mg/kg APB to rats, 2 mg/kg Salubrinal was repeatedly administered intraperitoneally, once daily, for 8 days. (A, B) ERG a- and b-waves and fluorescein permeability into the vitreous body (right graph) were evaluated at 7 and 8 days after APB administration, respectively. The data represent mean ± SE for ERG a- and b-wave amplitudes (A) and fluorescein permeability into the vitreous body (B) in normal, vehicle-treated, and Salubrinal (2 mg/kg)-treated rats (n = 8 eyes in 4 animals). $P < 0.05 versus vehicle-treated rats, **P < 0.01 versus normal rats as assessed by Student's t-test. (C) Pathological findings of the retina from APB-treated rats administered vehicle or Salubrinal for 7 days. Note that retinal pigment epithelium degeneration and photoreceptor outer segment disruption are improved in the Salubrinal-treated rat retina. Hematoxylin and eosin staining. Scale Bar: 50 μm.
<b>FIG. 8.</b>
FIG. 8.
Rates of body weight change following a single p.o. administration of vehicle or APB (20, 40, and 80 mg/kg) to Brown Norway rats. Normal: untreated rats. The data represent mean ± SE of 4 rats. p.o., peroral.
<b>FIG. 9.</b>
FIG. 9.
Mean plasma APB concentrations following a single p.o. administration of 40 mg/kg APB or single i.v. administration of 1 mg/kg APB to Brown Norway rats. The data represent mean ± SE (p.o.: n = 4 rats) or mean (i.v.: n = 2 rats). i.v., intravenous.

Similar articles

Cited by

References

    1. Wang A.L., Lukas T.J., Yuan M., et al. . Autophagy, exosomes, and drusen formation in age-related macular degeneration. Autophagy. 5:563–564, 2009 - PubMed
    1. Algvere P.V., and Seregard S. Age-related maculopathy: pathogenetic features and new treatment modalities. Acta Ophthalmol. Scand. 80:136–143, 2002 - PubMed
    1. Bergmann M., Schütt F., Holz F.G., and Kopitz J. Inhibition of the ATP-driven proton pump in RPE lysosomes by the major lipofuscin fluorophore A2-E may contribute to the pathogenesis of age-related macular degeneration. FASEB J. 18:562–564, 2004 - PubMed
    1. Kaarniranta K., Sinha D., Blasiak J., et al. . Autophagy and heterophagy dysregulation leads to retinal pigment epithelium dysfunction and development of age-related macular degeneration. Autophagy. 9:973–984, 2013 - PMC - PubMed
    1. Kaarniranta K. Autophagy–hot topic in AMD. Acta Ophthalmol. 88:387–388, 2010 - PubMed

Publication types

MeSH terms