. 2016 Feb;278(2):430-40.
doi: 10.1148/radiol.2015142899. Epub 2015 Aug 27.

Squamous Cell Carcinoma Xenografts: Use of VEGFR2-targeted Microbubbles for Combined Functional and Molecular US to Monitor Antiangiogenic Therapy Effects

Affiliations

Squamous Cell Carcinoma Xenografts: Use of VEGFR2-targeted Microbubbles for Combined Functional and Molecular US to Monitor Antiangiogenic Therapy Effects

Sarah C Baetke et al. Radiology. 2016 Feb.

Abstract

Purpose: To assess the ability of vascular endothelial growth factor receptor type 2 (VEGFR2)-targeted and nontargeted ultrasonography (US) to depict antiangiogenic therapy effects and to investigate whether first-pass kinetics obtained with VEGFR2-targeted microbubbles provide independent data about tumor vascularization.

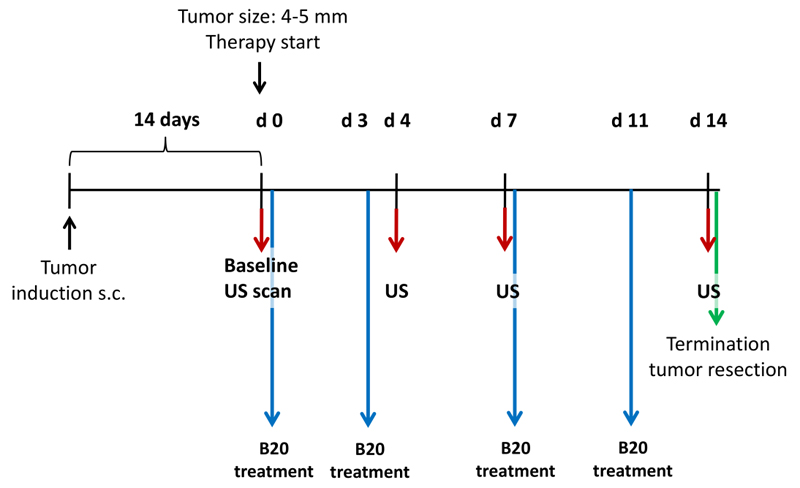
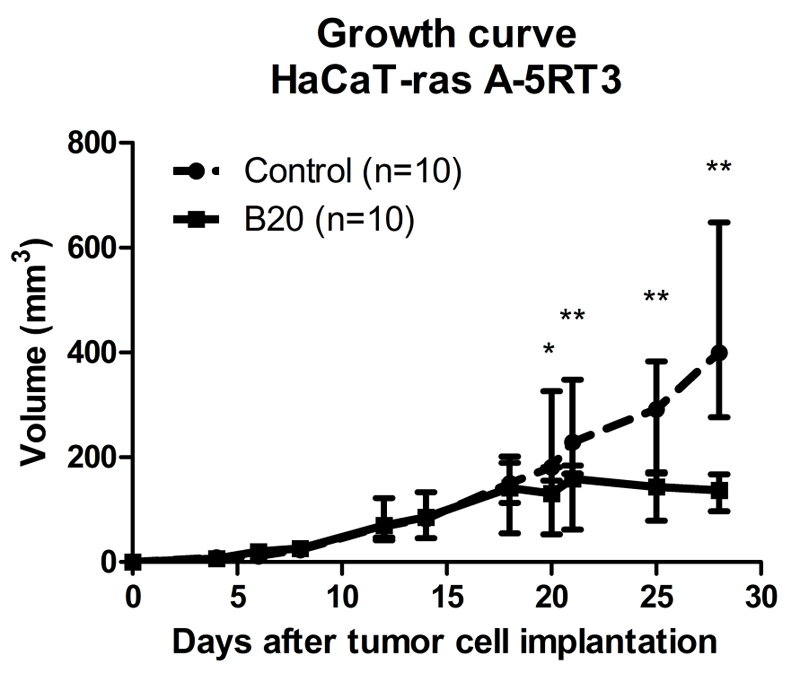
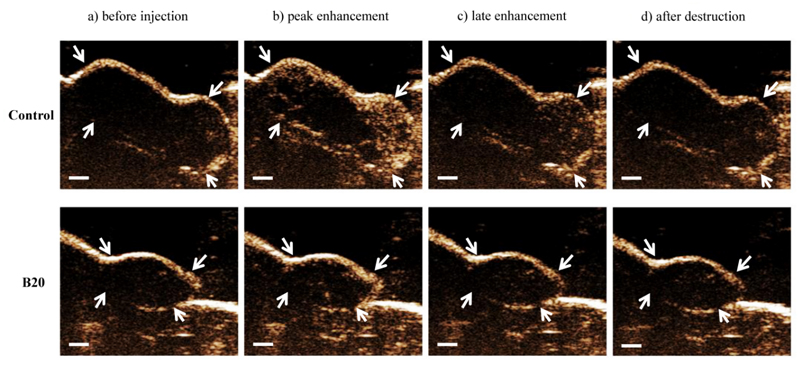
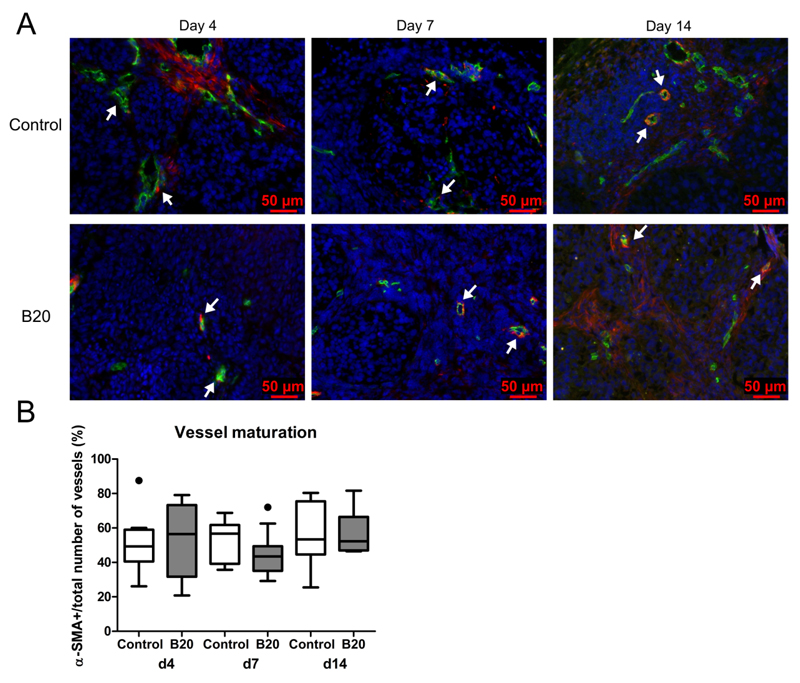
Materials and methods: Governmental approval was obtained for animal experiments. Vascularization in response to anti-vascular endothelial growth factor receptor or vehicle-control treatment (10 per group) in HaCaT-ras A-5RT3 xenografts was longitudinally assessed in mice by means of first-pass kinetics of nontargeted microbubbles (BR1, BR38; Bracco, Geneva, Switzerland) and VEGFR2-targeted microbubbles (BR55, Bracco) before and 4, 7, and 14 days after therapy. VEGFR2 expression was determined 8 minutes after BR55 injection with destruction-replenishment analysis. US data were validated with immunohistochemistry. Significant differences were evaluated with the Mann-Whitney test.

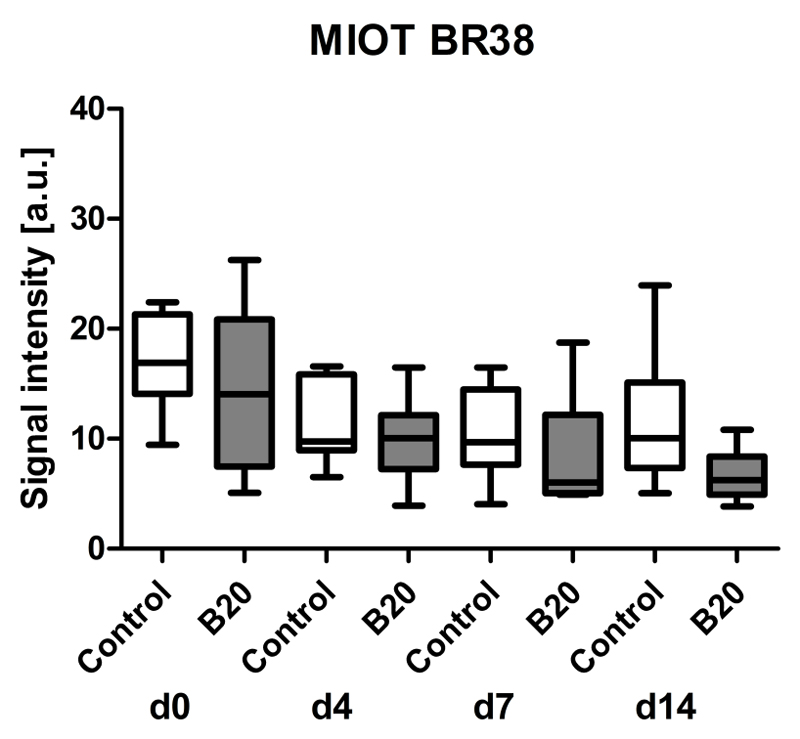
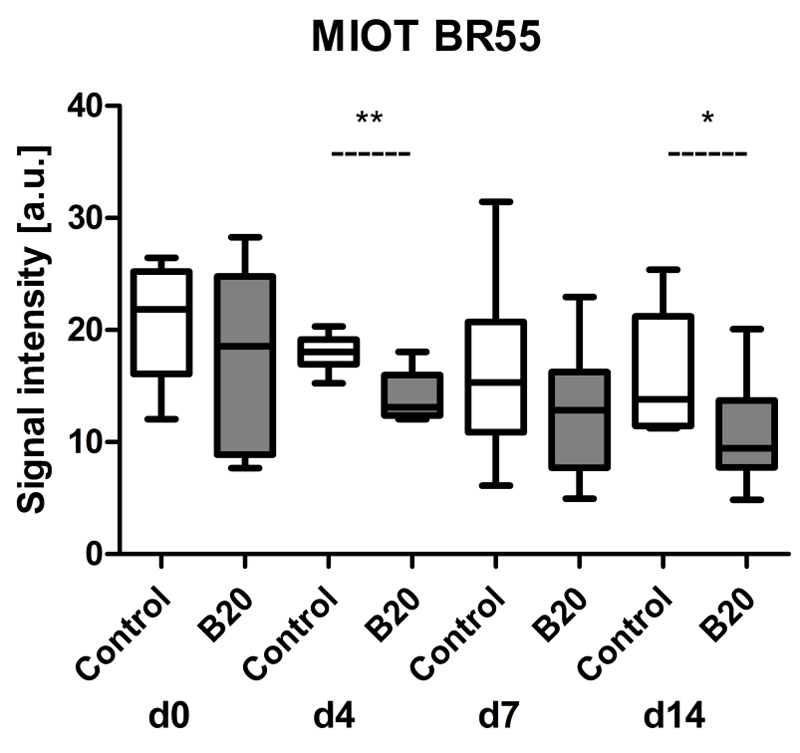
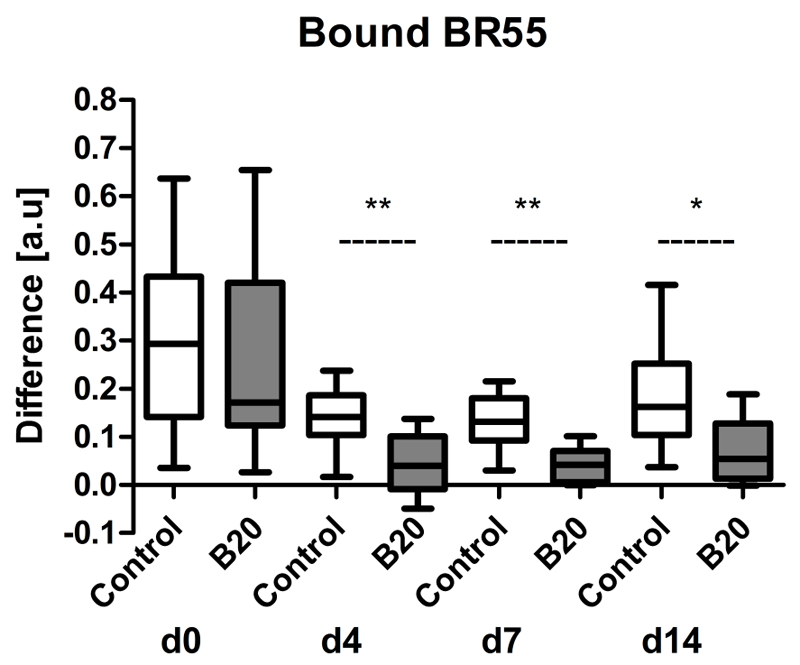
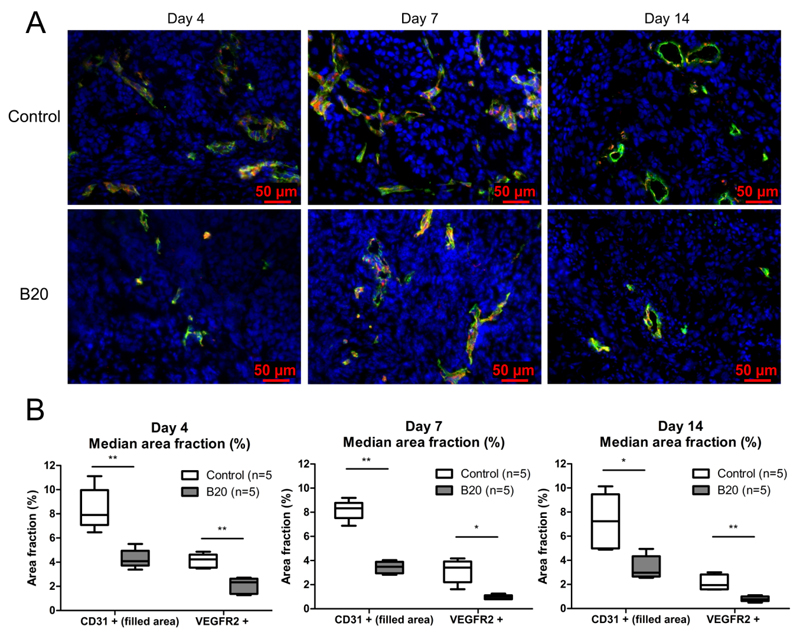
Results: First-pass analysis with BR1, BR38, and BR55 showed similar tendencies toward decreasing vascularization, with a stronger decrease in tumors treated with anti-VEGF antibody. The median signal intensity (in arbitrary units [au]) of anti-VEGF antibody-treated versus control tumors at day 14 was as follows: BR1, 5.2 au (interquartile range [IQR], 3.2 au) vs 11.3 au (IQR, 10.0 au), respectively; BR38, 6.2 au (IQR, 3.5) vs 10.0 au (IQR, 7.8); and BR55, 9.5 au (IQR, 6.0 au) vs 13.8 au (IQR, 9.8) (P = .0230). VEGFR2 assessment with BR55 demonstrated significant differences between both groups throughout the therapy period (median signal intensity of anti-VEGF antibody-treated vs control tumors: 0.04 au [IQR, 0.1 au] vs 0.14 au [IQR, 0.08 au], respectively, at day 4, P = .0058; 0.04 au [IQR, 0.06 au] vs 0.13 au [IQR, 0.09 au] at day 7, P = .0058; and 0.06 au [IQR, 0.11 au] vs 0.16 au [IQR, 0.15 au] at day 14, P = .0247). Immunohistochemistry confirmed the lower microvessel density and VEGFR2-positive area fraction in tumors treated with anti-VEGF antibody.

Conclusion: Antiangiogenic therapy effects were detected earlier and more distinctly with VEGFR2-targeted US than with functional US. First-pass analyses with BR55, BR38, and BR1 revealed similar results, with a decrease in vascularization during therapy. Functional data showed that BR55 is not strongly affected by early binding of the microbubbles to VEGFR2. Thus, functional and molecular imaging of angiogenesis can be performed with BR55 within one examination.


Figures

Figure 1
Figure 1
Diagram of experimental study design. HaCaT-ras A-5RT3 cells were injected subcutaneously (s.c.) in right flank of nude mice. Fourteen days after tumor cell injection, baseline US was performed and mice were randomized to one of two treatment groups, receiving either B20 (n=10) or vehicle control treatment (n=10). Additional US examinations were performed 4, 7, and 14 days after therapy initiation. After the last measurement time point, mice were sacrificed and tumors were excised for histologic analysis.
Figure 2
Figure 2
Growth curve of HaCaT-ras A-5RT3 tumors in B20-treated and control animals. Therapy was started 14 days after tumor cell injection. Treatment with VEGF-antibody B20 reduced tumor growth during a 14-day period, with significant differences in tumor volume between B20-treated and control animals 6 days after treatment start (day 20). Data are medians and IQRs. * = p < 0.05,** = p < 0.01.
Figure 3
Figure 3
Box-and-whisker plot shows analysis of rBV with postprocessing MIOT technique after injection of nontargeted BR1 microbubbles. Data are medians and IQRs.
Figure 4
Figure 4
Box-and-whisker plot shows analysis of rBV with postprocessing MIOT technique after injection of nontargeted, long-circulating BR38 microbubbles. Data are medians and IQRs.
Figure 5
Figure 5
Box-and-whisker plot shows results of first-pass analysis with BR55 and postprocessing with MIOT technique after injection of targeted microbubbles. Data are medians and IQRs. * = p < 0.05.
Figure 6
Figure 6
Representative US images show control and B20-treated HaCaT-ras A-5RT3 tumor at therapy day 14 before and after injection of BR55 microbubbles. A higher peak enhancement is seen in control tumor compared with B20-treated tumor. Eight minutes after microbubble injection (late enhancement), the intensity of contrast enhancement is still higher in control tumor owing to bound BR55 microbubbles. Contrast intensity is markedly lower after application of a destructive pulse. Arrows indicate tumor margin. Bar = 1 mm.
Figure 7
Figure 7
Box-and-whisker plot shows amount of target-bound BR55 in B20-treated and control tumors. The amount of bound BR55 microbubbles was significantly decreased in tumors of B20-treated animals compared with control mice starting from day 4 of therapy. Results are expressed as difference in US imaging signal before and after application of a destructive pulse. Data are medians and IQRs. * = p < 0.05, ** = p < 0.01.
Figure 8
Figure 8
Immunohistochemical analysis of microvessel density and VEGFR2 expression at treatment days 4, 7, and 14. A) Representative images for immunofluorescent staining for CD31 (green), VEGFR2 (red), and cell nuclei (blue) of control and B20-treated tumor at therapy days 4, 7, and 14. B) Box-and-whisker plots show CD31- and VEGFR2-positive area fraction at treatment days 4, 7, and 14. B20-treated tumors show a significantly decreased microvessel density and VEGFR2-positive area fraction compared with control tumors. Data are medians and IQRs. * = p < 0.05, ** = p < 0.01.
Figure 9
Figure 9
Immunohistochemical analysis of vessel maturation at treatment days 4, 7, and 14. A) Images from immunofluorescent staining for CD31 (green), α-SMA (red), and cell nuclei (blue) of control and B20-treated tumor at therapy days 4, 7, and 14. Arrows indicate representative α-SMA-positive blood vessels. In addition to α-SMA-positive blood vessels, fluorescent signals from α-SMA-positive, nonvessel-associated myofibroblasts can be observed in the tumor stroma. B) Box-and-whisker plot shows median percentage of α-SMA-positive vessels. The percentage of α-SMA-positive vessels was equal for control and B20-treated tumors at therapy days 4, 7, and 14. Data are medians and IQRs. There are five tumors per experimental group. * = p < 0.05.

Similar articles

Cited by

References

    1. Kiefer F, Siekmann AF. The role of chemokines and their receptors in angiogenesis. Cell Mol Life Sci. 2011;68:2811–2830. - PMC - PubMed
    1. Rossi D, Zlotnik A. The biology of chemokines and their receptors. Annu Rev Immunol. 2000;18:217–242. - PubMed
    1. Carmeliet P, Jain RK. Angiogenesis in cancer and other diseases. Nature. 2000;407(6801):249–257. - PubMed
    1. Romagnani P, Lasagni L, Annunziato F, Serio M, Romagnani S. CXC chemokines: the regulatory link between inflammation and angiogenesis. Trends Immunol. 2004;25(4):201–209. - PubMed
    1. Hanahan D, Weinberg RA. Hallmarks of cancer: the next generation. Cell. 2011;144(5):646–674. - PubMed

Publication types

MeSH terms

Substances

LinkOut - more resources