. 2015 Aug 27;6(8):e1868.
doi: 10.1038/cddis.2015.238.

Transglutaminase 2--a novel inhibitor of adipogenesis

Affiliations

Transglutaminase 2--a novel inhibitor of adipogenesis

V D Myneni et al. Cell Death Dis. .

Abstract

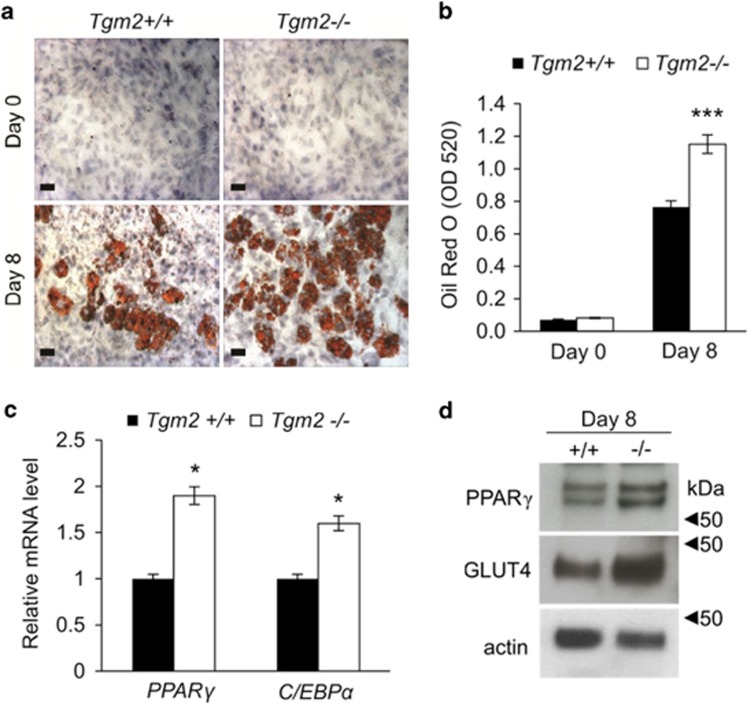
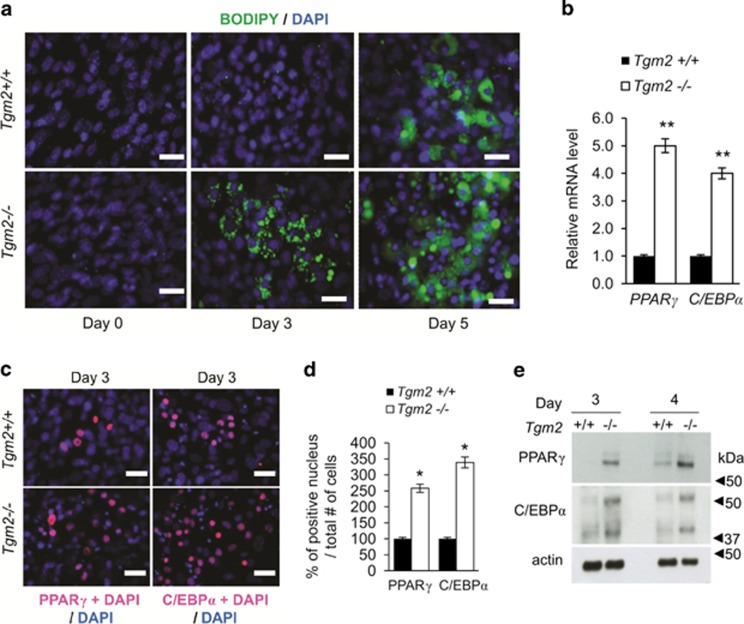
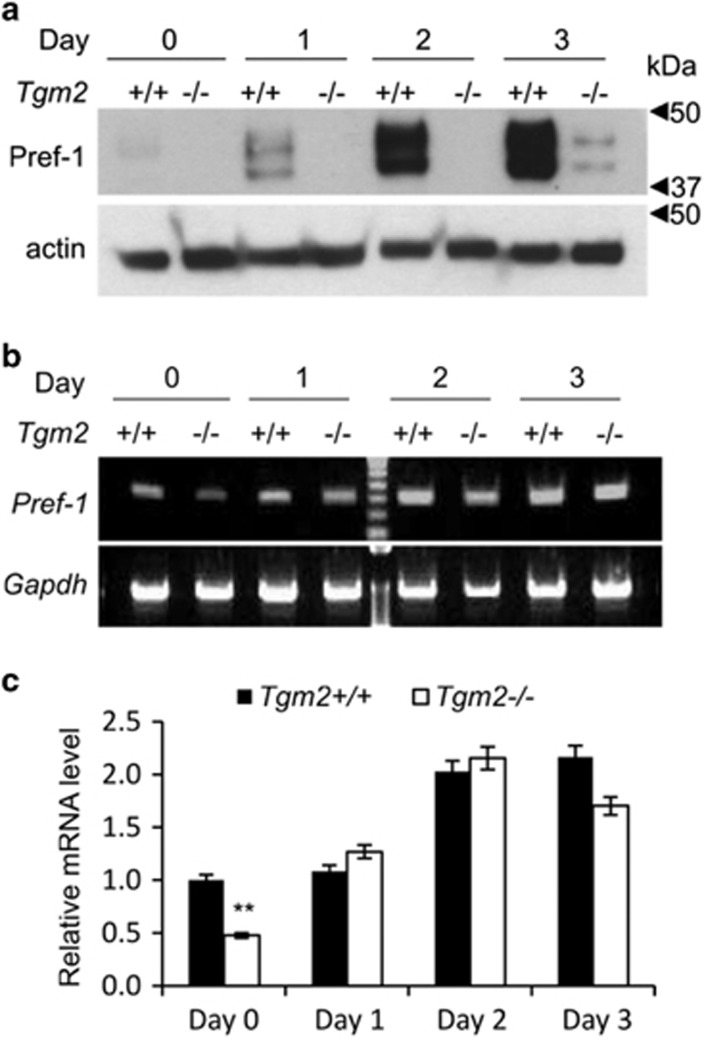
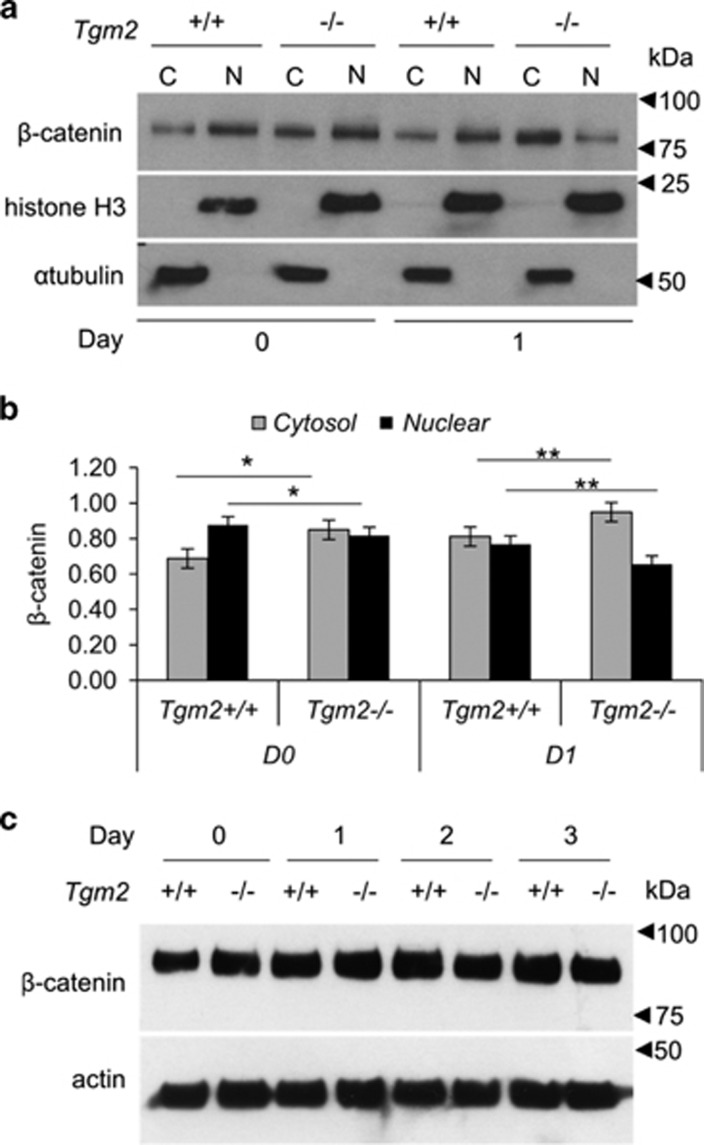
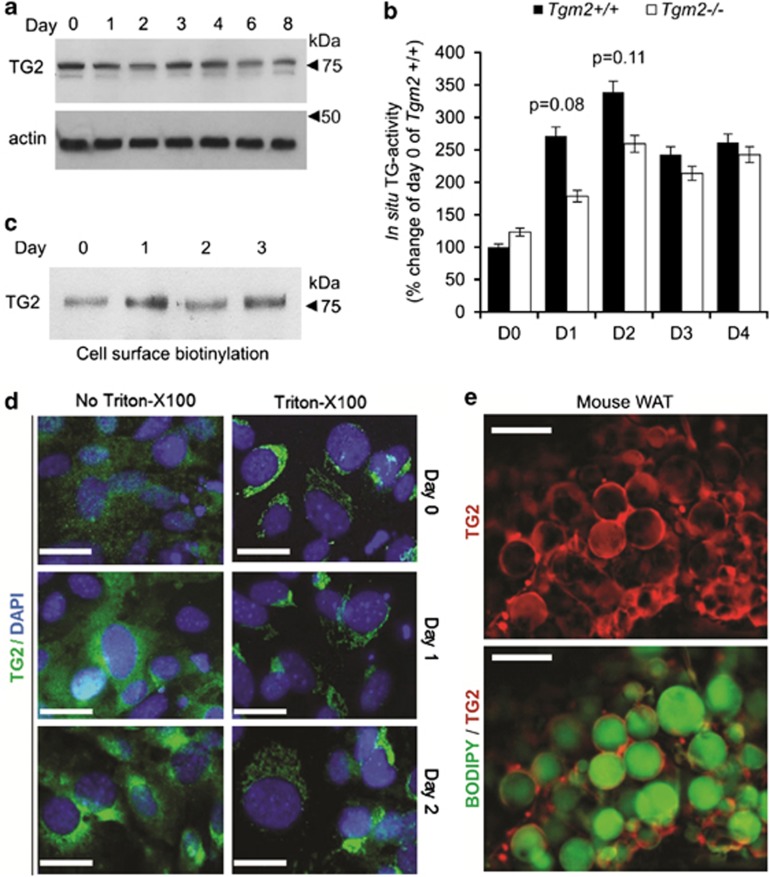
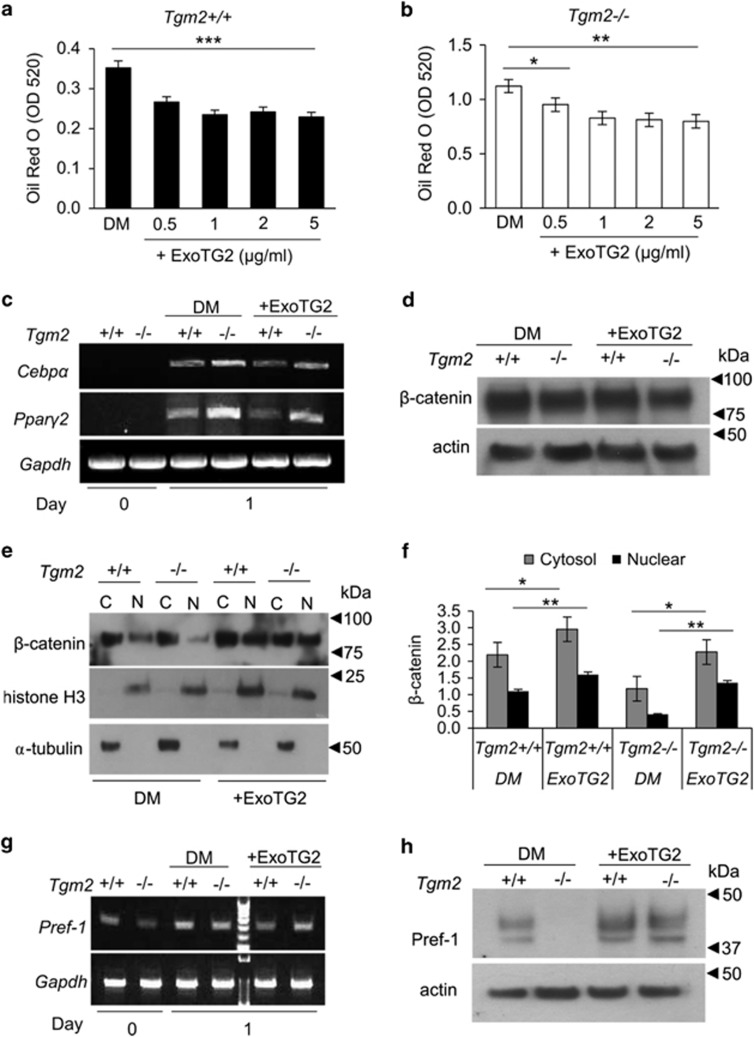
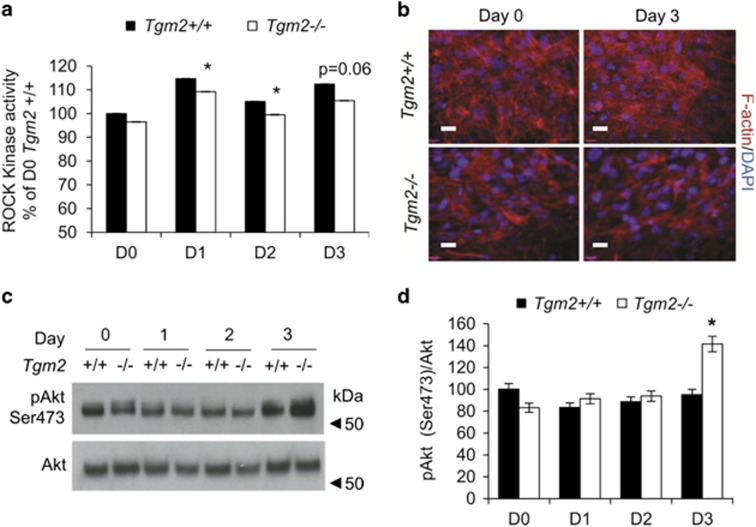
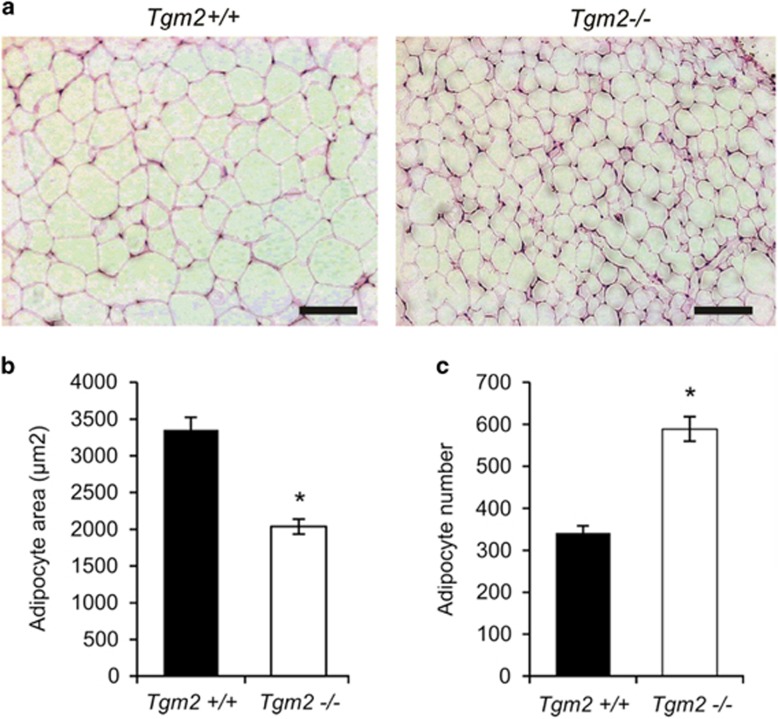
Differentiation of preadipocytes to lipid storing adipocytes involves extracellular signaling pathways, matrix remodeling and cytoskeletal changes. A number of factors have been implicated in maintaining the preadipocyte state and preventing their differentiation to adipocytes. We have previously reported that a multifunctional and protein crosslinking enzyme, transglutaminase 2 (TG2) is present in white adipose tissue. In this study, we have investigated TG2 function during adipocyte differentiation. We show that TG2 deficient mouse embryonic fibroblasts (Tgm2-/- MEFs) display increased and accelerated lipid accumulation due to increased expression of major adipogenic transcription factors, PPARγ and C/EBPα. Examination of Pref-1/Dlk1, an early negative regulator of adipogenesis, showed that the Pref-1/Dlk1 protein was completely absent in Tgm2-/- MEFs during early differentiation. Similarly, Tgm2-/- MEFs displayed defective canonical Wnt/β-catenin signaling with reduced β-catenin nuclear translocation. TG2 deficiency also resulted in reduced ROCK kinase activity, actin stress fiber formation and increased Akt phosphorylation in MEFs, but did not alter fibronectin matrix levels or solubility. TG2 protein levels were unaltered during adipogenic differentiation, and was found predominantly in the extracellular compartment of MEFs and mouse WAT. Addition of exogenous TG2 to Tgm2+/+ and Tgm2-/- MEFs significantly inhibited lipid accumulation, reduced expression of PPARγ and C/EBPα, promoted the nuclear accumulation of β-catenin, and recovered Pref-1/Dlk1 protein levels. Our study identifies TG2 as a novel negative regulator of adipogenesis.


Figures

Figure 1
Figure 1
Tgm2−/− MEFs show enhanced adipogenesis. (a) Tgm2+/+ and Tgm2−/− MEFs were subjected to adipogenic differentiation and their ability to accumulate lipids was assessed on days 0 and 8 by Oil Red O staining. Cells were counter stained with hematoxylin. Increases lipids are visible in Tgm2−/− MEFs on day 8. Scale bar equals 70 μm. (b) Quantification of Oil Red O cultures on days 0 and 8 show significantly increases lipid accumulation to Tgm2−/− MEFs compared with Tgm2+/+ MEFs. Results are mean values±SEM (n=3). ***P<0.001. (c) mRNA expression analysis of Pparγ and Cebpα from Tgm2+/+ and Tgm2−/− MEFs on day 8 shows a significant increase in Tgm2−/− MEFs. The relative quantity of mRNA expression was normalized to 18 S. Error bars±SD (n=3), *P<0.05. (d) Western blot analysis of total cell lysate of Tgm2−/− and Tgm2+/+ MEFs on day 8, show increased PPARγ protein and its downstream target GLUT4 in Tgm2−/− MEFs; actin used as loading control
Figure 2
Figure 2
Tgm2−/− MEFs show accelerated adipogenesis. (a) Immunofluorescence staining for lipid with Bodipy 493/503 (green) during differentiation of Tgm2+/+ and Tgm2−/− MEFs. Lipid accumulation is visible on day 3 in Tgm2−/− MEFs compared with Tgm2+/+ MEFs which show lipids only on day 4–5 onwards. Nuclei were visualized with DAPI (blue). Scale bar equals 50 μm. (b) mRNA expression of Pparγ and Cebpα from Tgm2+/+ and Tgm2−/− MEFs on day 3, show a significant increase in Tgm2−/− MEFs. The relative quantity of mRNA expression was normalized to 18 S. Error bars±SD (n=3), **P<0.01. (c) Nuclear translocation of PPARγ and C/EBPα (colocalization with DAPI in pink) in Tgm2+/+ and Tgm2−/− MEFs on day 3 show increased activation of transcription factors. Nuclei stained with DAPI (blue). Scale bar equals 50 μm. (d) Quantification of PPARγ and C/EBPα positive nucleus per total number of cells in Tgm2+/+ and Tgm2−/− MEFs on day 3 shows a dramatic and significant increase in Tgm2−/− MEFs. Error bars±SEM (n=3), *P<0.05. (e) Western blot analysis of PPARγ and C/EBPα in total cell lysates on days 3 and 4 show increased PPARγ and C/EBPα protein levels in Tgm2−/− MEFs; actin used as loading control
Figure 3
Figure 3
Pref-1 protein and mRNA production is compromised in Tgm2−/− MEFs. (a) Western blot analysis of Pref-1f in total cell lysates of Tgm2−/− and Tgm2+/+ MEFs during early differentiation on days 0–3 show almost complete absence of the protein. Actin was used as loading control. (b) mRNA expression of Pref-1 by RT-PCR in the cells shows that on day 0 Pref-1 mRNA is lower in Tgm2−/− compared with Tgm2+/+ MEFs; however, on day 3 the difference is no longer observed. This mRNA does not appear to translate into protein as per Western blot analysis. Gapdh used as loading control. (c) Quantification of mRNA expression of Pref-1 (b), shows significantly reduced of Pref-1 on day 0 in Tgm2−/− compared with Tgm2+/+ MEFs. Pref-1 expression was similar in both Tgm2−/− and Tgm2+/+ MEFs after initiation of differentiation (day 1). Error bars±SEM (n=3), **P<0.01
Figure 4
Figure 4
Tgm2−/− MEFs show decreased β-catenin nuclear translocation. (a) Western blot analysis of β-catenin levels in cytosol (C) and nuclear (N) fractions of Tgm2+/+ and Tgm2−/− MEFs on days 0 and 1. α-Tubulin and histone H3 were used as cytosolic and nuclear loading controls, respectively. (b) Quantification of Western blots shows significantly reduced nuclear translocation of β-catenin in Tgm2−/− MEFs compared with control cells before (day 0) and after initiation of differentiation (day 1). Error bars±SEM (n=3), *P<0.05; **P<0.01. (c) Western blot analysis for β-catenin levels in total cell lysates of Tgm2+/+ and Tgm2−/− MEFs from days 0–3 show no changes; actin used as a loading control
Figure 5
Figure 5
TG2 levels and location during early adipogenesis and in WAT. (a) Western blot analysis of total cell lysate from Tgm2+/+ MEFs during adipocyte differentiation. TG2 levels remain constant with no major fluctuations during differentiation. Actin used as loading control. (b) Transamidase activity in Tgm2−/− and Tgm2+/+ MEFs during adipogenesis was assessed in situ using 5-(biotinamido) pentylamine as an activity probe. Graph displayed is biotin detection in cells and the activity is normalized to TG-activity on day 0 of Tgm2+/+ MEFs (set for 100%). Results are mean values±SEM (n=3). (c) Western blot analysis of cell surface biotinylated protein extract for TG2 protein levels in Tgm2+/+ MEFs during adipocyte differentiation. TG2 levels on cell surface increase with initiation of differentiation (day 1). (d) Immunofluorescence staining of TG2 (green) during early differentiation of Tgm2+/+ MEFs. Nuclei were stained with DAPI (blue). Cells not treated with Triton-X100 show the extracellular distribution of TG2; Triton X-100 permeabilized cells show intracellular distribution; Scale bar equals 100 μm. (e) Immunofluorescence staining of whole-mount mouse white adipose tissue (WAT) showing distribution of TG2 (red) and lipids (Bodipy 493/503, green) in the tissue; TG2 is mainly extracellular; Scale bar equals 50 μm
Figure 6
Figure 6
Exogenous, extracellular TG2 inhibits adipogenesis and activates β-catenin signaling and recovers Pref-1 protein levels. (a, b) Tgm2+/+ and Tgm2−/− MEF cultures were treated with increasing concentrations (0.5–5 μg/ml) of exogenous TG2 (ExoTG2) from days 0 to 8. Graphs show quantification of Oil Red O staining on day 8. Exogenous TG2 was able to reduce lipid accumulation in a significant manner in both Tgm2+/+ and Tgm2−/− MEFs. Results are mean values±SEM (n=3). ***P<0.001. *P<0.05; **P<0.01. (c) mRNA expression of Pparγ and Cebpα in Tgm2+/+ and Tgm2−/− MEFs on days 0 and 1 with or without ExoTG2 (5 μg/ml); DM-differentiation medium. A reduced expression was observed with ExoTG2. (d) Western blot analysis of total β-catenin levels in total cell lysate of Tgm2+/+ and Tgm2−/− MEFs on day 1 with or without ExoTG2 (5 μg/ml) show no difference; actin used as a loading control. (e, f) Western blot analysis and quantification of β-catenin levels in cytosolic (c) and nuclear (N) fractions of Tgm2+/+ and Tgm2−/− MEFs on day 1 with or without ExoTG2 (5 μg/ml). Normalization was done to loading controls α-tubulin and histone H3. Tgm2−/− MEFs show significantly increased levels of β-catenin in the nucleus. Error bars±SEM (n=3), *P<0.05; **P<0.01. (g) mRNA expression of Pref-1 in Tgm2+/+ and Tgm2−/− MEFs on days 0 and 1 with or without ExoTG2 (5 μg/ml). (h) Western blot analysis of total cell lysate for Pref-1 in Tgm2+/+ and Tgm2−/− MEFs on day 1 with or without ExoTG2 (5 μg/ml). ExoTG2 treatment recovered Pref-1 protein levels in Tgm2−/− MEFs
Figure 7
Figure 7
Tgm2−/− MEFs display reduced ROCK kinase activity, actin fibers and increased Akt phosphorylation. (a) Microplate ROCK kinase activity of Tgm2+/+ and Tgm2−/− MEFs in total cell lysate during differentiation show moderate but significant decrease in Tgm2−/− cells on days 1 and 2. Error bars±SEM (n=3), *P<0.05. (b) Immunofluorescence staining of of Tgm2+/+ and Tgm2−/− MEFs for F-actin on days 0 and 3. A moderate decrease in actin stress fibers is observed. Nuclei are stained with DAPI (blue). Scale bar 200 μm. (c, d) Western blot analysis and quantification of pAkt (Ser473) and total Akt in MEF cell lysates from day 0–3. An increase in Akt phosphorylation is seen on day 3 in Tgm2−/− MEFs compared with Tgm2+/+ MEFs. Results are mean values±SEM (n=3), *P<0.05
Figure 8
Figure 8
Increased adipocyte number in Tgm2−/− mouse WAT. (a) H&E stained sections of epididymal fat pads from Tgm2−/− and Tgm2+/+ mice at 24 weeks of age. (b) Average adipocyte area, shows a significant decrease in the adipocyte area in Tgm2−/− compared with Tgm2+/+ mice. (c) Average adipocyte number was significantly increased in Tgm2−/− mice compared with Tgm2+/+. Results are mean values±SEM (n=3), *P<0.05. Scale bar equals 100 μm

References

    1. Van Gaal LF, Mertens IL, De Block CE. Mechanisms linking obesity with cardiovascular disease. Nature. 2006;444:875–880. - PubMed
    1. Kahn SE, Hull RL, Utzschneider KM. Mechanisms linking obesity to insulin resistance and type 2 diabetes. Nature. 2006;444:840–846. - PubMed
    1. Spalding KL, Arner E, Westermark PO, Bernard S, Buchholz BA, Bergmann O, et al. Dynamics of fat cell turnover in humans. Nature. 2008;453:783–787. - PubMed
    1. Virtue S, Vidal-Puig A. It's not how fat you are, it's what you do with it that counts. PLoS Biol. 2008;6:e237. - PMC - PubMed
    1. Tchoukalova Y, Koutsari C, Jensen M. Committed subcutaneous preadipocytes are reduced in human obesity. Diabetologia. 2007;50:151–157. - PubMed

Publication types

MeSH terms

LinkOut - more resources