. 2015 Aug 27;11(8):e1004321.
doi: 10.1371/journal.pcbi.1004321. eCollection 2015 Aug.

Escher: A Web Application for Building, Sharing, and Embedding Data-Rich Visualizations of Biological Pathways

Affiliations

Escher: A Web Application for Building, Sharing, and Embedding Data-Rich Visualizations of Biological Pathways

Zachary A King et al. PLoS Comput Biol. .

Abstract

Escher is a web application for visualizing data on biological pathways. Three key features make Escher a uniquely effective tool for pathway visualization. First, users can rapidly design new pathway maps. Escher provides pathway suggestions based on user data and genome-scale models, so users can draw pathways in a semi-automated way. Second, users can visualize data related to genes or proteins on the associated reactions and pathways, using rules that define which enzymes catalyze each reaction. Thus, users can identify trends in common genomic data types (e.g. RNA-Seq, proteomics, ChIP)--in conjunction with metabolite- and reaction-oriented data types (e.g. metabolomics, fluxomics). Third, Escher harnesses the strengths of web technologies (SVG, D3, developer tools) so that visualizations can be rapidly adapted, extended, shared, and embedded. This paper provides examples of each of these features and explains how the development approach used for Escher can be used to guide the development of future visualization tools.


Conflict of interest statement

The authors have declared that no competing interests exist.

Figures

Fig 1
Fig 1. The Escher interface.
A) The application includes a set of menus with a link to the documentation, a button bar for accessing common features, and a menu for jumping to maps that were built with the same model. B) To build pathway maps, enter the Add reaction mode using the Edit menu or the button bar. Click on the canvas or an existing metabolite to see a search menu. Reactions can be searched by reaction ID, by metabolite, and by gene. When a gene dataset or reaction dataset is loaded, suggestions appear for the reactions with the largest values in the dataset.
Fig 2
Fig 2. Data visualization.
A) The results of an in silico flux simulation visualized on the reactions. B) Metabolomics data for E. coli aerobic growth visualized on the metabolites. C) RNA-Seq data showing the shift from aerobic to anaerobic conditions in E. coli. Green represents reactions downregulated in anaerobic growth and red represents gene upregulated in anaerobic growth, based on the log2 of the fold change.
Fig 3
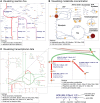
Fig 3. The organization of the Escher project.
A) Escher source code can be compiled to a single JavaScript file (either minified or not minified) and two style sheets. The Python package is used to serve the Escher web application in various ways. APIs exist for both JavaScript and Python. B) Escher maps are generated from the BiGG database or built by users. COBRA models are generated using COBRApy. C) The Escher web application can be viewed on the Escher website, or, for local access, using various methods in the Python package.
Fig 4
Fig 4. The import and export types in Escher and the EscherConverter.
A) Escher can save to the Escher JSON file format or export to a SVG image. EscherConverter can be used to generate files in the SBML and SBGN-ML formats. B) The EscherConverter graphical user interface.

References

    1. Arnold K, Bordoli L, Kopp J, Schwede T (2006) The SWISS-MODEL workspace: A web-based environment for protein structure homology modelling. Bioinformatics 22: 195–201. - PubMed
    1. Herráez A (2006) Biomolecules in the computer: Jmol to the rescue. Biochem Mol Biol Educ 34: 255–261. 10.1002/bmb.2006.494034042644 - DOI - PubMed
    1. Skinner ME, Uzilov AV, Stein LD, Mungall CJ, Holmes IH (2009) JBrowse: A next-generation genome browser. Genome Res 19: 1630–1638. 10.1101/gr.094607.109 - DOI - PMC - PubMed
    1. Karolchik D, Barber GP, Casper J, Clawson H, Cline MS, et al. (2014) The UCSC Genome Browser database: 2014 update. Nucleic Acids Res 42: 764–770. 10.1093/nar/gkt1168 - DOI - PMC - PubMed
    1. Smoot ME, Ono K, Ruscheinski J, Wang PL, Ideker T (2011) Cytoscape 2.8: New features for data integration and network visualization. Bioinformatics 27: 431–432. 10.1093/bioinformatics/btq675 - DOI - PMC - PubMed

Publication types