. 2015 Aug 28:5:13229.
doi: 10.1038/srep13229.

Connectivity in grey reef sharks (Carcharhinus amblyrhynchos) determined using empirical and simulated genetic data

Affiliations

Connectivity in grey reef sharks (Carcharhinus amblyrhynchos) determined using empirical and simulated genetic data

Paolo Momigliano et al. Sci Rep. .

Abstract

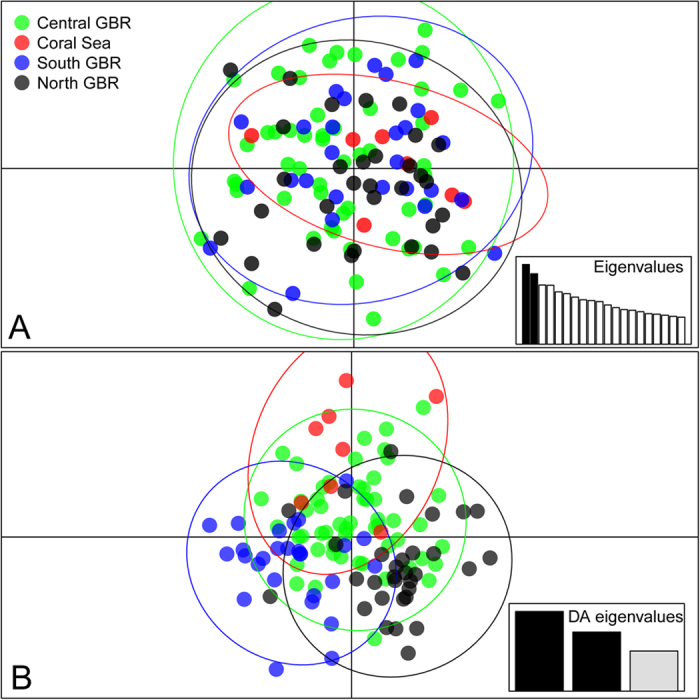
Grey reef sharks (Carcharhinus amblyrhynchos) can be one of the numerically dominant high order predators on pristine coral reefs, yet their numbers have declined even in the highly regulated Australian Great Barrier Reef (GBR) Marine Park. Knowledge of both large scale and fine scale genetic connectivity of grey reef sharks is essential for their effective management, but no genetic data are yet available. We investigated grey reef shark genetic structure in the GBR across a 1200 km latitudinal gradient, comparing empirical data with models simulating different levels of migration. The empirical data did not reveal any genetic structuring along the entire latitudinal gradient sampled, suggesting regular widespread dispersal and gene flow of the species throughout most of the GBR. Our simulated datasets indicate that even with substantial migrations (up to 25% of individuals migrating between neighboring reefs) both large scale genetic structure and genotypic spatial autocorrelation at the reef scale were maintained. We suggest that present migration rates therefore exceed this level. These findings have important implications regarding the effectiveness of networks of spatially discontinuous Marine Protected Areas to protect reef sharks.


Figures

Figure 1
Figure 1. Sampling design. Genetic samples were collected from 121 grey reef sharks in three distinct regions of the GBR and the Coral Sea (Herald Cays).
In the North GBR, 32 individuals were sampled from 2 reefs; in the Central GBR, 54 individuals from 9 reefs and in the southern GBR we sampled 27 individuals from 3 reefs. Furthermore, 8 individuals were sampled from the Herald Cays in the Coral Sea. The map was produced using the package “maps” in the R statistical environment.
Figure 2
Figure 2. Between-region estimates of genetic differentiation with 95% confidence intervals: Weir and Cockerham Fst (Fst), Hedrick’s G’st (G’st) and Jost’s D (D).
All estimates were very close to 0 and non-significant. Confidence intervals were estimated using 1000 bootstrap pseudo-replicates.
Figure 3
Figure 3. Results from PCA (A) and DAPC (B) analyses.
Groups were defined as geographic regions within the sampling area (North GBR, Central GBR, South GBR and Coral Sea). Eigenvalues representing the variance explained by principal components (A) and discriminant factors (B) are shown in the scree plots. The x and y axes represent, respectively, the first and second principal components (A) and the first and second discriminant factors (B). Individuals are represented by dots, groups are color-coded and depicted by 95% inertia ellipses.
Figure 4
Figure 4. Results from the simulated datasets under different migration scenarios.
Top graph (A) shows estimated global Meirman’ s F’st estimates between regions. Bottom graph (B) shows spatial autocorrelation estimates (r across different spatial scales: within reef, within region and across the entire simulated seascape). All scenarios resulted in positive and significant patterns of spatial autocorrelation. Error bars represent 95% confidence intervals obtained from 10 independent simulations. Grey lines in both (A,B) represent the estimates obtained from the empirical dataset.

Similar articles

Cited by

References

    1. Heithaus M. R., Frid A., Wirsing A. J. & Worm B. Predicting ecological consequences of marine top predator declines. Trends Ecol. Evol. 23, 202–210 (2008). - PubMed
    1. Myers R. A., Baum J. K., Shepherd T. D., Powers S. P. & Peterson C. H. Cascading effects of the loss of apex predatory sharks from a coastal ocean. Science 315, 1846–1850 (2007). - PubMed
    1. Bascompte J., Melián C. J. & Sala E. Interaction strength combinations and the overfishing of a marine food web. Proc. Natl. Acad. Sci. USA 102, 5443–5447, 10.1073/pnas.0501562102 (2005). - DOI - PMC - PubMed
    1. Wirsing A. J., Heithaus M. R., Frid A. & Dill L. M. Seascapes of fear: evaluating sublethal predator effects experienced and generated by marine mammals. Mar. Mamm. Sci. 24, 1–15 (2008).
    1. Ruppert J. L., Travers M. J., Smith L. L., Fortin M.-J. & Meekan M. G. Caught in the middle: combined impacts of shark removal and coral loss on the fish communities of coral reefs. PloS one 8, e74648 (2013). - PMC - PubMed

Publication types