. 2016 Jan;68(1):103-16.
doi: 10.1002/art.39408.

Phenotypic, Functional, and Gene Expression Profiling of Peripheral CD45RA+ and CD45RO+ CD4+CD25+CD127(low) Treg Cells in Patients With Chronic Rheumatoid Arthritis

Affiliations

Phenotypic, Functional, and Gene Expression Profiling of Peripheral CD45RA+ and CD45RO+ CD4+CD25+CD127(low) Treg Cells in Patients With Chronic Rheumatoid Arthritis

Gina J Walter et al. Arthritis Rheumatol. 2016 Jan.

Abstract

Objective: Conflicting evidence exists regarding the suppressive capacity of Treg cells in the peripheral blood (PB) of patients with rheumatoid arthritis (RA). The aim of this study was to determine whether Treg cells are intrinsically defective in RA.

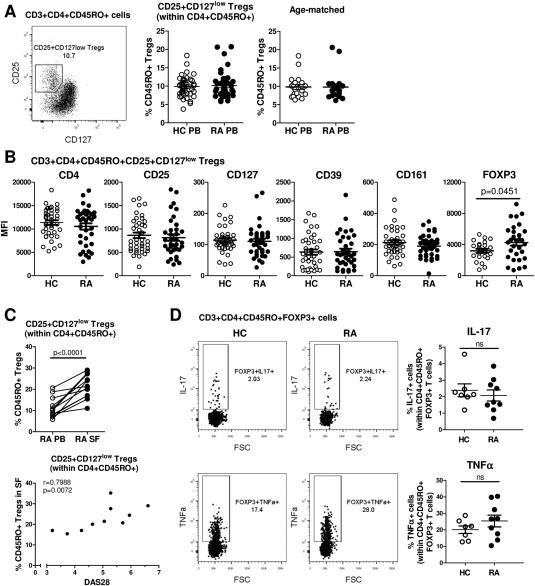
Methods: Using a range of assays on PB samples from patients with chronic RA and healthy controls, CD3+CD4+CD25+CD127(low) Treg cells from the CD45RO+ or CD45RA+ T cell compartments were analyzed for phenotype, cytokine expression (ex vivo and after in vitro stimulation), suppression of Teff cell proliferation and cytokine production, suppression of monocyte-derived cytokine/chemokine production, and gene expression profiles.

Results: No differences between RA patients and healthy controls were observed with regard to the frequency of Treg cells, ex vivo phenotype (CD4, CD25, CD127, CD39, or CD161), or proinflammatory cytokine profile (interleukin-17 [IL-17], interferon-γ [IFNγ], or tumor necrosis factor [TNF]). FoxP3 expression was slightly increased in Treg cells from RA patients. The ability of Treg cells to suppress the proliferation of T cells or the production of cytokines (IFNγ or TNF) upon coculture with autologous CD45RO+ Teff cells and monocytes was not significantly different between RA patients and healthy controls. In PB samples from some RA patients, CD45RO+ Treg cells showed an impaired ability to suppress the production of certain cytokines/chemokines (IL-1β, IL-1 receptor antagonist, IL-7, CCL3, or CCL4) by autologous lipopolysaccharide-activated monocytes. However, this was not observed in all patients, and other cytokines/chemokines (TNF, IL-6, IL-8, IL-12, IL-15, or CCL5) were generally suppressed. Finally, gene expression profiling of CD45RA+ or CD45RO+ Treg cells from the PB revealed no statistically significant differences between RA patients and healthy controls.

Conclusion: Our findings indicate that there is no global defect in either CD45RO+ or CD45RA+ Treg cells in the PB of patients with chronic RA.


Figures

Figure 1
Figure 1
Frequency and phenotype of CD3+CD4+CD45RO+CD25+CD127low Treg cells in patients with rheumatoid arthritis (RA). A, Fluorescence‐activated cell sorting analysis was used to gate on CD25+CD127low Treg cells (boxed area with percentage value shown) within the CD4+CD45RO+ T cell population in peripheral blood mononuclear cells (PBMCs) from RA patients (left). Percentages of these cells were compared between healthy controls (HC) and RA patients (each n = 42) (center) or between age‐matched healthy controls (mean ± SD age 49 ± 2.5 years) and RA patients (mean ± SD age 49 ± 2.4 years) (each n = 20) (right). B, Expression levels of the indicated surface markers in CD3+CD4+CD45RO+CD25+CD127low Treg cells were analyzed in PBMCs from healthy controls (n = 40) and RA patients (n = 36). FoxP3 expression was measured intracellularly (n = 23 healthy controls, n = 30 RA patients). C, The percentage of CD25+CD127low cells within CD4+CD45RO+ T cells was determined in paired samples of freshly isolated PB and synovial fluid (SF) from RA patients (n = 15) (top), and Treg cell frequencies in the RA SF (n = 10) were assessed for correlation with the Disease Activity Score in 28 joints (DAS28), by Spearman's test (bottom). Symbols represent individual patients. D, PBMCs from healthy controls (n = 7) and RA patients (n = 9) were stimulated with phorbol myristate acetate and ionomycin for 3 hours in the presence of GolgiStop, and the percentage of interleukin‐17 (IL‐17)–positive or tumor necrosis factor (TNF)–positive cells (boxed areas with percentage values shown) within CD3+CD4+CD14−CD45RO+FoxP3+ T cells was determined. Representative dot plots are shown. In A, B, and D, symbols represent individual donors; horizontal bars show the mean. Groups were compared by either paired or unpaired t‐test. MFI = mean fluorescence intensity.
Figure 2
Figure 2
Ability of CD45RO+ Treg cells from patients with RA to suppress Teff cell proliferation and cytokine production. CD4+CD45RA−CD45RO+CD25−CD127+ Teff cells from healthy controls and RA patients were labeled with 5,6‐carboxyfluorescein succinimidyl ester (CFSE) and cocultured with CD14+ monocytes at a 1:1 cell ratio in the presence of anti‐CD3 monoclonal antibody (100 ng/ml), in the absence or presence of autologous sorted CD45RO+ Treg cells (added at the indicated Teff cell:Treg cell ratios). On day 3, cell proliferation was assessed by flow cytometry (A and B), and cell culture supernatants were collected for detection of secretion of interferon‐γ (IFNγ) (C) and TNF (D) by Luminex. A, Histograms show the CFSE dilution and the percentage of cell proliferation at the different cell ratios in representative samples from a healthy control subject and an RA patient. B–D, Left, Cumulative data show the percentage of proliferating cells (B) or levels of cytokines (C and D) in the absence or presence of Treg cells from healthy controls (n = 8) and patients with RA (n = 8–9). Right, The percentage suppression of Teff cell proliferation is shown for each Teff cell:Treg cell ratio. Bars show the mean ± SEM. The broken horizontal line in C and D indicates the lower limit of detection. Statistical analysis was performed using Kruskal‐Wallis test with Dunn's multiple comparison test.  = P < 0.05; ∗∗ = P < 0.01; ∗∗∗ = P < 0.001 versus absence of Treg cells. NS = not significant (see Figure 1 for other definitions).
Figure 3
Figure 3
Ability of CD45RO+ Treg cells from patients with RA to suppress CD25intermediate (CD25int) Teff cell proliferation and cytokine production. A, The percentage of CD25intCD127+ and CD25−CD127+ Teff cells within CD4+CD45RO+ T cells was determined in PB samples from healthy controls (n = 12) and RA patients (n = 16). Symbols represent individual donors; horizontal bars show the mean. Groups were compared by unpaired t‐test. B, CD25−CD127+ and CD25intCD127+ Teff cells were sorted from CD4+CD45RO+ T cells in the PB of healthy controls (n = 7) and RA patients (n = 9) and cocultured with autologous monocytes in the presence of anti‐CD3. The percentages of Teff cells producing IL‐17 or TNF were determined following restimulation of the cells with phorbol myristate acetate and ionomycin on day 3. Data were analyzed by Wilcoxon's matched pairs signed rank test. C, CD4+CD45RA−CD45RO+CD25intCD127+ Teff cells from healthy controls and RA patients were labeled with 5,6‐carboxyfluorescein succinimidyl ester and cocultured with CD14+ monocytes at a 1:1 cell ratio in the presence of anti‐CD3 monoclonal antibody (100 ng/ml), in the absence or presence of autologous sorted CD45RO+CD25+CD127low Treg cells (added at the indicated Teff cell:Treg cell ratios). On day 3, Teff cell proliferation was assessed by flow cytometry. Left, Cumulative data show the percentage of proliferating cells in the absence or presence of Treg cells from healthy controls (n = 6) and RA patients (n = 4). Right, The percentage suppression of Teff cell proliferation is shown for each Teff cell:Treg cell ratio. Bars show the mean ± SEM. Data were analyzed by Mann‐Whitney test. NS = not significant (see Figure 1 for other definitions).
Figure 4
Figure 4
Ability of CD45RO+ Treg cells from patients with RA to suppress lipopolysaccharide (LPS)–induced monocyte (Mono)–derived cytokine/chemokine production. CD14+ monocytes from healthy controls (n = 6–8) and RA patients (n = 7–9) were cultured in the presence of 100 ng/ml LPS without or with sorted CD45RO+ Treg cells at a 1:1 ratio. After 3 days, the supernatants were collected and analyzed using a human 25‐plex cytokine array or by enzyme‐linked immunosorbent assay (for IL‐6 and IL‐8). Each line joined by symbols represents an individual donor. The broken horizontal line indicates the lower limit of detection. For monocyte chemotactic protein 1 (MCP‐1), the dotted horizontal line indicates the upper limit of detection. Data were analyzed by Wilcoxon's matched pairs signed rank test.  = P < 0.05; ∗∗ = P < 0.01 versus absence of Treg cells. IL‐1Ra = interleukin‐1 receptor antagonist; IP‐10 = interferon‐γ–inducible protein 10; MIP‐1α = macrophage inflammatory protein 1α; NS = not significant (see Figure 1 for other definitions).
Figure 5
Figure 5
Gene expression profiling of CD45RA+ and CD45RO+ Treg and Teff CD4+ T cell subsets from the peripheral blood (PB) of healthy controls (HC) and patients with rheumatoid arthritis (RA). CD25+CD127low Treg cells and CD25−CD127+ Teff cells were sorted from the CD45RA+CD45RO− (naive) or CD45RA−CD45RO+ (memory) CD4+ T cell compartments from the PB of age‐ and sex‐matched healthy controls (mean age 54 years [range 34–69]) and RA patients (mean age 57 years [range 37–75]) (each n = 6 female donors). Five of the RA patients were receiving disease‐modifying antirheumatic drug treatment (n = 3 methotrexate [MTX], n = 1 hydroxychloroquine [HCQ], n = 1 MTX, HCQ, and sulfasalazine); 1 patient had received no medication. All patients had moderate‐to‐active disease, with a mean ± SEM Disease Activity Score in 28 joints of 4.8 ± 0.3. A, Principal components analysis (PCA) based on global gene expression levels in the PB shows distinct clusters of the CD45RA+ Teff, CD45RA+ Treg, CD45RO+ Teff, and CD45RO+ Treg cell populations. B, PCA shows that the 4 T cell populations do not cluster differently between healthy controls and RA patients. C, The heatmap, representing results from hierarchical cluster analysis, shows the relative expression levels of previously described Treg signature–associated genes in the different T cell subsets from the PB of healthy controls and RA patients.

Similar articles

Cited by

References

    1. Cao D, Malmstrom V, Baecher‐Allan C, Hafler D, Klareskog L, Trollmo C. Isolation and functional characterization of regulatory CD25brightCD4+ T cells from the target organ of patients with rheumatoid arthritis. Eur J Immunol 2003;33:215–23. - PubMed
    1. Van Amelsfort JM, Jacobs KM, Bijlsma JW, Lafeber FP, Taams LS. CD4+CD25+ regulatory T cells in rheumatoid arthritis: differences in presence, phenotype, and function between peripheral blood and synovial fluid. Arthritis Rheum 2004;50:2775–85. - PubMed
    1. Liu MF, Wang CR, Fung LL, Lin LH, Tsai CN. The presence of cytokine‐suppressive CD4+CD25+ T cells in the peripheral blood and synovial fluid of patients with rheumatoid arthritis. Scand J Immunol 2005;62:312–7. - PubMed
    1. Mottonen M, Heikkinen J, Mustonen L, Isomaki P, Luukkainen R, Lassila O. CD4+ CD25+ T cells with the phenotypic and functional characteristics of regulatory T cells are enriched in the synovial fluid of patients with rheumatoid arthritis. Clin Exp Immunol 2005;140:360–7. - PMC - PubMed
    1. Lawson CA, Brown AK, Bejarano V, Douglas SH, Burgoyne CH, Greenstein AS, et al. Early rheumatoid arthritis is associated with a deficit in the CD4+CD25high regulatory T cell population in peripheral blood. Rheumatology (Oxford) 2006;45:1210–7. - PubMed

Publication types

MeSH terms