. 2015 Sep 1;29(17):1801-16.
doi: 10.1101/gad.266999.115. Epub 2015 Aug 27.

Regulation of gene expression dynamics during developmental transitions by the Ikaros transcription factor

Affiliations

Regulation of gene expression dynamics during developmental transitions by the Ikaros transcription factor

Teresita L Arenzana et al. Genes Dev. .

Abstract

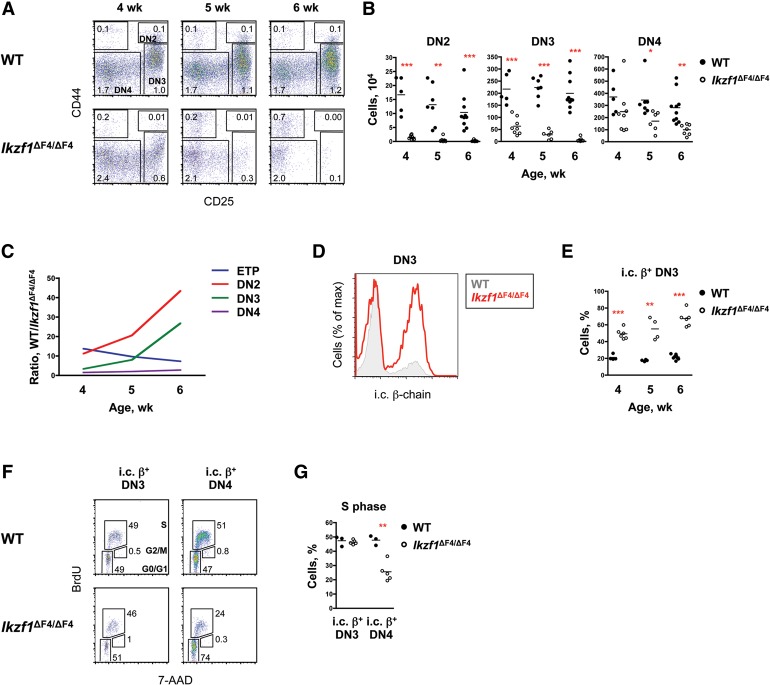
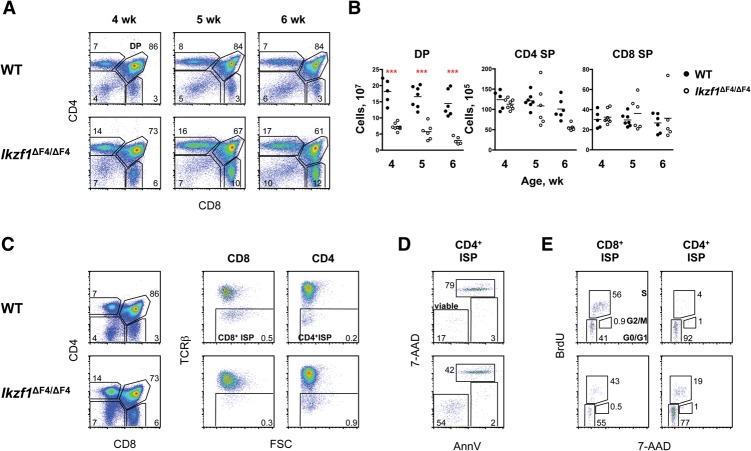
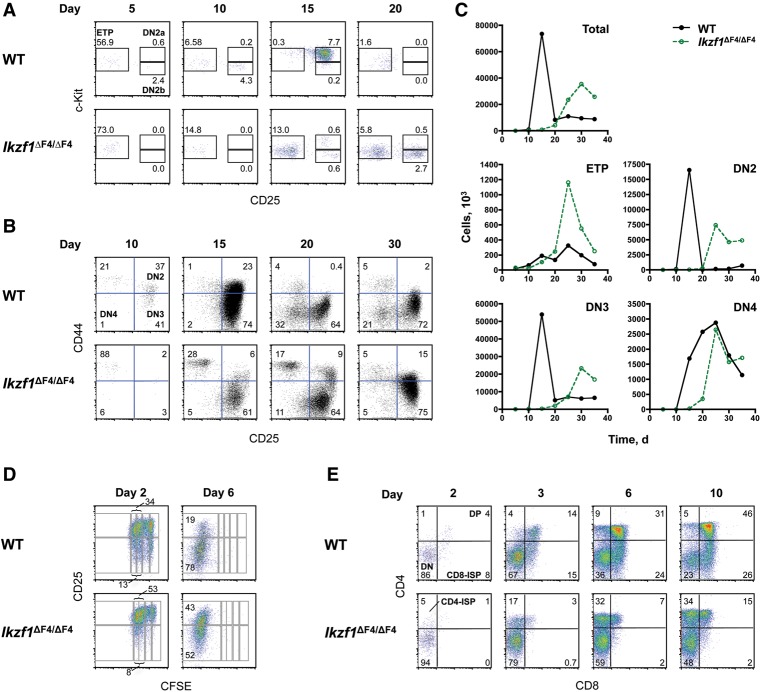
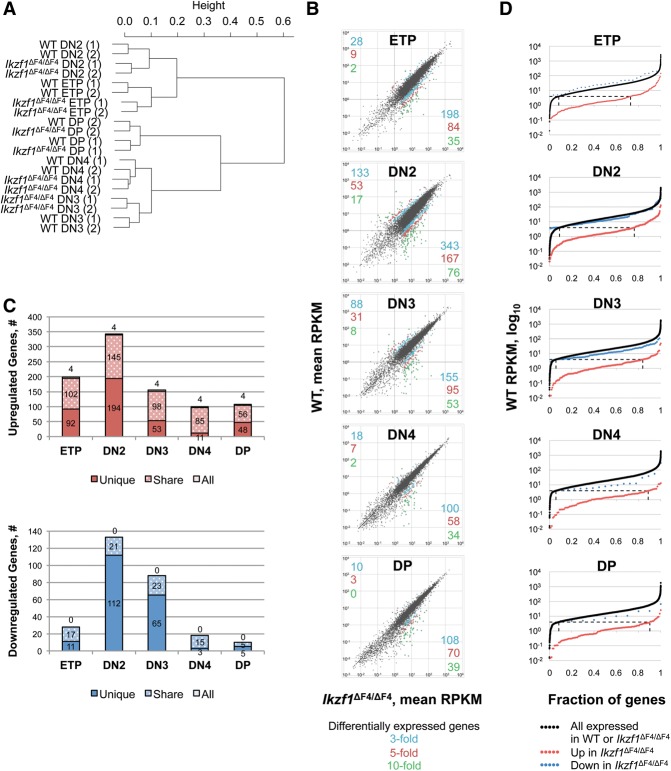
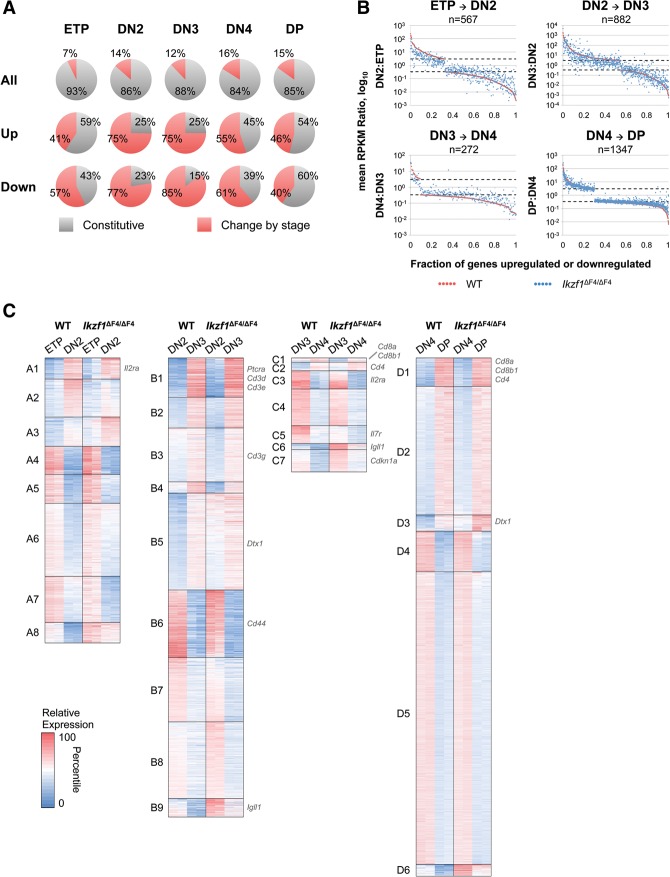
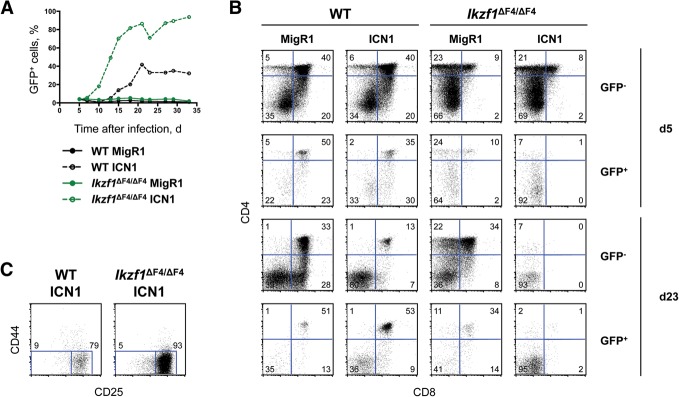
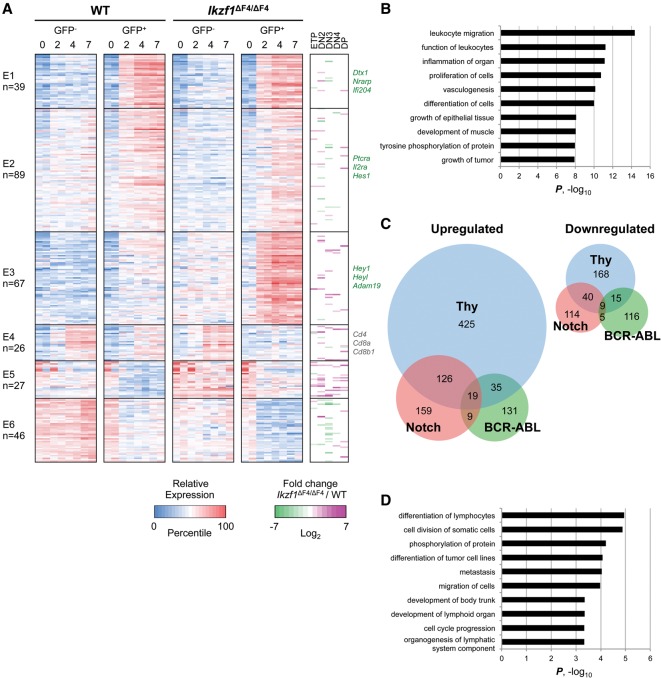
The DNA-binding protein Ikaros is a potent tumor suppressor and hematopoietic regulator. However, the mechanisms by which Ikaros functions remain poorly understood, due in part to its atypical DNA-binding properties and partnership with the poorly understood Mi-2/NuRD complex. In this study, we analyzed five sequential stages of thymocyte development in a mouse strain containing a targeted deletion of Ikaros zinc finger 4, which exhibits a select subset of abnormalities observed in Ikaros-null mice. By examining thymopoiesis in vivo and in vitro, diverse abnormalities were observed at each developmental stage. RNA sequencing revealed that each stage is characterized by the misregulation of a limited number of genes, with a strong preference for stage-specific rather than lineage-specific genes. Strikingly, individual genes rarely exhibited Ikaros dependence at all stages. Instead, a consistent feature of the aberrantly expressed genes was a reduced magnitude of expression level change during developmental transitions. These results, combined with analyses of the interplay between Ikaros loss of function and Notch signaling, suggest that Ikaros may not be a conventional activator or repressor of defined sets of genes. Instead, a primary function may be to sharpen the dynamic range of gene expression changes during developmental transitions via atypical molecular mechanisms that remain undefined.

Keywords: Ikaros; gene regulation; leukemogenesis; lymphocyte development; transcription.


Figures

Figure 1.
Figure 1.
Altered development and response of Ikzf1ΔF4/ΔF4 DN thymocytes at the pre-TCR signaling checkpoint. (A) Shown are staining profiles of lineage (lin) gated thymocytes in wild-type (WT) and Ikzf1ΔF4/ΔF4 mice at 4, 5, and 6 wk of age. The absolute mean percentages are indicated (n = 5–10). (B) Shown are absolute numbers of the indicated thymocyte populations in wild-type and Ikzf1ΔF4/ΔF4 mice at 4 wk (n = 5–8), 5 wk (n = 6–7), and 6 wk (n = 7–10). Each symbol represents an individual mouse, and the bar shows the mean. (C) Shown are the ratios of the average cell numbers of the indicated populations in wild type over Ikzf1ΔF4/ΔF4 as they relate to age. (D,E) Shown are histograms of lin CD44 CD25+ DN3 thymocytes in wild-type and Ikzf1ΔF4/ΔF4 mice at 5 wk of age (D) and the proportion of intracellular (i.c.) β-chain+ DN3 thymocytes in wild-type and Ikzf1ΔF4/ΔF4 mice at 4 wk (n = 4–6), 5 wk (n = 4), and 6 wk (n = 5–6) (E). Each symbol represents an individual mouse, and the bar shows the mean. (F,G) Shown are cell cycle analysis of lin CD44 CD25+ DN3 cells and lin CD44 CD25 DN4 cells (F) and proportions of the indicated populations in S phase in 4- to 5-wk-old wild-type and Ikzf1ΔF4/ΔF4 mice (n = 3–5) (G). Each symbol represents an individual mouse, and the bar shows the mean. For B, E, and G, (*) P < 0.05; (**) P < 0.01; (***) P < 0.001.
Figure 2.
Figure 2.
T-cell differentiation in Ikzf1ΔF4/ΔF4 mice progresses through a CD4+ ISP stage instead of a CD8+ ISP stage. (A) Shown are staining profiles of thymocytes in wild-type (WT) and Ikzf1ΔF4/ΔF4 mice at 4, 5, and 6 wk of age. The absolute mean percentages are indicated (n = 5–8). (B) Shown are absolute numbers of the indicated thymocyte populations in wild-type and Ikzf1ΔF4/ΔF4 mice at 4 wk (n = 5–8), 5 wk (n = 6–7), and 6 wk (n = 5–10). SP cells are gated on TCRβhi. (C) Shown are staining profiles of total (left), CD8+ gated (middle), and CD4+ gated (right) thymocytes of 4-wk-old wild-type and Ikzf1ΔF4/ΔF4 mice. The absolute percentages indicated are representative of five to eight mice. (D) Shown are staining profiles of Annexin V (AnnV) and 7-AAD (DNA content) for wild-type and Ikzf1ΔF4/ΔF4 TCRβlo CD4+ ISP thymocytes; the fractions of AnnV 7-AAD viable cells, AnnV+ 7-AAD early apoptotic cells, and AnnV+ 7-AAD+ dead cells are indicated. Data are representative of three independent experiments. (E) Shown are cell cycle analyses of TCRβlo CD8+ gated (left) and TCRβlo CD4+ gated (right) cells using BrdU and 7-AAD (DNA content) staining, with cells in the G0/G1, S, and G2/M phases gated. Percentages are representative of three independent experiments.
Figure 3.
Figure 3.
Aberrant T-cell differentiation in vitro in the absence of finger 4 of Ikaros. (AC) FACS-sorted lin Sca-1+ c-Kit+ CD150+ LSK cells from 6-wk-old wild-type (WT) and Ikzf1ΔF4/ΔF4 bone marrow were cultured on OP9-DL1 stromal cells in the presence of 5 ng/mL Flt-3L and 5 ng/mL IL-7 for the indicated numbers of days. Shown are staining profiles of GFP CD45+ lin CD44+ c-Kit+ cells (A) and GFP CD45+ lin cells (B) at the indicated time points. Data are representative of three independent experiments. (C) Shown are absolute numbers of the indicated thymocyte populations in wild-type and Ikzf1ΔF4/ΔF4 cultures. Data are representative of two independent experiments. (D,E) Delayed T-cell differentiation in vitro when initiated from Ikzf1ΔF4/ΔF4 DN3 cells. (D) FACS-sorted carboxyfluorescein succinimidyl ester (CFSE)-labeled lin CD44 CD25+ DN3 cells from 5-wk-old wild-type and Ikzf1ΔF4/ΔF4 mice were cultured on OP9-DL1 stromal cells in the presence of 5 ng/mL Flt-3L and 2.5 ng/mL IL-7 for the indicated numbers of days. Shown are staining profiles of GFP CD45+ lin cells representative of three independent experiments. (E) FACS-sorted lin CD44 CD25+ DN3 cells from 4-wk-old wild-type and Ikzf1ΔF4/ΔF4 mice were cultured on OP9-DL1 stromal cells in the presence of 5 ng/mL Flt-3L and 1 ng/mL IL-7 for the indicated numbers of days. Shown are staining profiles of GFP gated cells. The percentages indicated are representative of three mice.
Figure 4.
Figure 4.
Stage specificity of genes differentially expressed in Ikzf1ΔF4/ΔF4 thymocyte subsets. (A) Hierarchical clustering of expressed genes (>200 base pairs, four or more RPKM in at least one sample; n = 10,177 genes) is shown. (B) RPKM scatter plots of expressed genes of the indicated thymocyte subsets in wild-type (WT) and Ikzf1ΔF4/ΔF4 mice are shown. Colored dots and numbers indicate differentially expressed genes (P ≤ 0.001) up-regulated (bottom right quadrant) or down-regulated (top left quadrant) by threefold (blue), fivefold (red), and 10-fold (green) in Ikzf1ΔF4/ΔF4 T cells. (C) Genes differentially expressed (P ≤ 0.001) in any one Ikzf1ΔF4/ΔF4 thymocyte subset compared with wild type were divided into three categories based on whether the gene was also differentially expressed in any other thymocyte subset. (All) Genes that are differentially expressed in all five thymocyte subsets; (share) genes that are differentially expressed in two or more thymocyte subsets; (unique) genes that are differentially expressed only in the thymocyte subset indicated. (D) The majority of genes up-regulated in Ikzf1ΔF4/ΔF4 cells are not expressed in wild-type cells. RPKM values of wild-type cells were plotted for all expressed genes (four or more RPKM in wild-type or Ikzf1ΔF4/ΔF4 cells), for genes up-regulated by threefold (P ≤ 0.001) in Ikzf1ΔF4/ΔF4 cells compared with wild-type cells, and for genes down-regulated by threefold (P ≤ 0.001) in Ikzf1ΔF4/ΔF4 cells compared with wild-type cells. The dotted horizontal line shows where four RPKM intersects the graphs.
Figure 5.
Figure 5.
Genes differentially expressed in Ikzf1ΔF4/ΔF4 thymocyte subsets are biased toward genes modulated by stage. (A) All expressed genes or genes differentially regulated in Ikzf1ΔF4/ΔF4 thymocyte subsets were divided into two categories: constitutive (expression of gene does not change during stage transition) and change by stage (expression of gene changes [greater than or equal to threefold; P ≤ 0.001] during stage transition). (B) Stage-dependent fold changes of all genes that were up-regulated or down-regulated by at least threefold (P ≤ 0.001) during the indicated stage transition in wild-type (WT) cells were plotted for wild-type (red) and Ikzf1ΔF4/ΔF4 (blue) stage transitions. (C) Expressed genes differentially regulated by threefold (P ≤ 0.001) at each stage transition of wild-type or Ikzf1ΔF4/ΔF4 cells were divided into a variable number of k-means clusters. Colors indicate the percentile of relative expression. ETP-to-DN2 transition, n = 796 genes; DN2-to-DN3 transition, n = 1389 genes; DN3-to-DN4 transition, n = 345 genes; DN4-to-DP transition, n = 1568 genes.
Figure 6.
Figure 6.
Enhanced Notch-induced growth expansion of Ikzf1ΔF4/ΔF4 DN T cells in vitro. (A) Lin-depleted thymocytes from 4- to 5-wk-old wild-type (WT) and Ikzf1ΔF4/ΔF4 mice were transduced with MigR1 (empty vector) or MigR1-ICN1 retroviruses and cultured on OP9-DL1 stromal cells in the presence of 5 ng/mL IL-7 for the indicated numbers of days. Shown is the proportion of GFP+ cells at the indicated time points. Data are representative of three independent experiments. (B) Shown are staining profiles of GFP CD45+ and GFP+ CD45+ gated cells. The percentages indicated are representative of three independent experiments. (C) Shown are staining profiles of GFP+ CD45+ CD4 CD8 gated cells at day 13.
Figure 7.
Figure 7.
Loss of finger 4 of Ikaros affects genes weakly induced or repressed by activated Notch. (A) Expressed genes differentially regulated by threefold (P ≤ 0.001) between ICN1-GFP+ and ICN1-GFP cells and differentially regulated by fivefold (P ≤ 0.001) in any time point relative to day 0 were divided into six k-means clusters. The right panel shows the corresponding fold change of expression levels in Ikzf1ΔF4/ΔF4 over wild-type (WT) T-cell subsets. Colors indicate percentile of relative expression (blue to red) or log2 fold change (green to purple). (B) Gene ontology analysis is shown for genes up-regulated or down-regulated by fivefold (P ≤ 0.001) in ICN1-GFP+ Ikzf1ΔF4/ΔF4 cells compared with ICN1-GFP+ wild-type cells. (C) A Venn diagram is shown comparing the lists of genes differentially up-regulated (left panel) or down-regulated (right panel) by threefold in Ikzf1ΔF4/ΔF4 cells compared with wild-type cells in thymocytes (ETP, DN2, DN3, DN4, or DP), Notch-expressing cells (ICN1-GFP+ cells at day 2, 4, or 7), and BCR-ABL-expressing cells (day 14, 21, or 28). (D) A gene ontology analysis is shown for genes up-regulated or down-regulated by threefold in Ikzf1ΔF4/ΔF4 cells compared with wild-type cells in both Notch-expressing and BCR-ABL-expressing cells.

References

    1. Aifantis I, Mandal M, Sawai K, Ferrando A, Vilimas T. 2006. Regulation of T-cell progenitor survival and cell-cycle entry by the pre-T-cell receptor. Immunol Rev 209: 159–169. - PubMed
    1. Anders S, Huber W. 2010. Differential expression analysis for sequence count data. Genome Biol 11: R106. - PMC - PubMed
    1. Aster JC, Xu L, Karnell FG, Patriub V, Pui JC, Pear WS. 2000. Essential roles for ankyrin repeat and transactivation domains in induction of T-cell leukemia by notch1. Mol Cell Biol 20: 7505–7515. - PMC - PubMed
    1. Avitahl N, Winandy S, Friedrich C, Jones B, Ge Y, Georgopoulos K. 1999. Ikaros sets thresholds for T cell activation and regulates chromosome propagation. Immunity 10: 333–343. - PubMed
    1. Brown KE, Guest SS, Smale ST, Hahm K, Merkenschlager M, Fisher AG. 1997. Association of transcriptionally silent genes with Ikaros complexes at centromeric heterochromatin. Cell 91: 845–854. - PubMed

Publication types

MeSH terms