. 2015 Sep 1;29(17):1875-89.
doi: 10.1101/gad.264127.115. Epub 2015 Aug 27.

Proteomic analysis of pRb loss highlights a signature of decreased mitochondrial oxidative phosphorylation

Affiliations

Proteomic analysis of pRb loss highlights a signature of decreased mitochondrial oxidative phosphorylation

Brandon N Nicolay et al. Genes Dev. .

Abstract

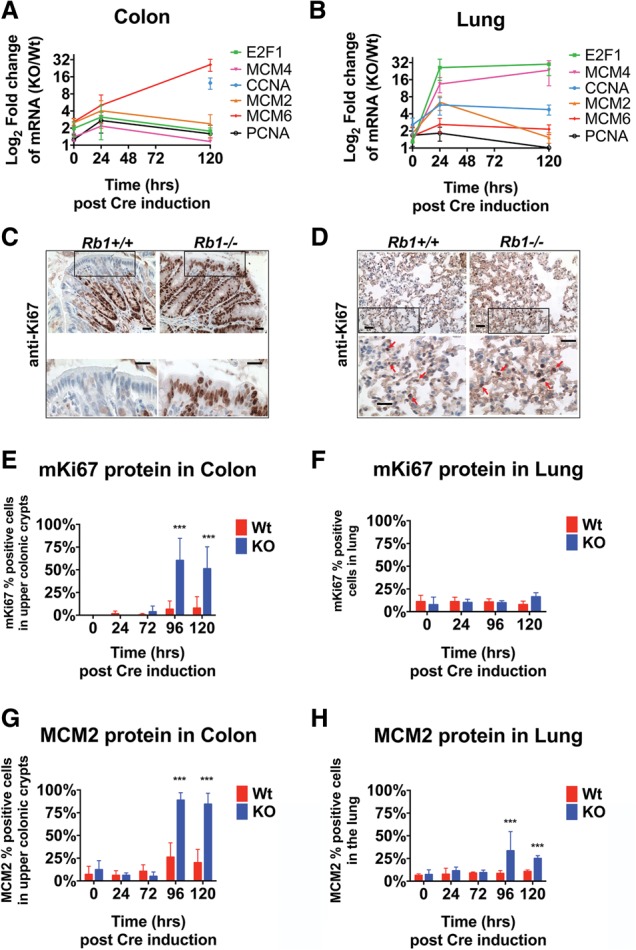
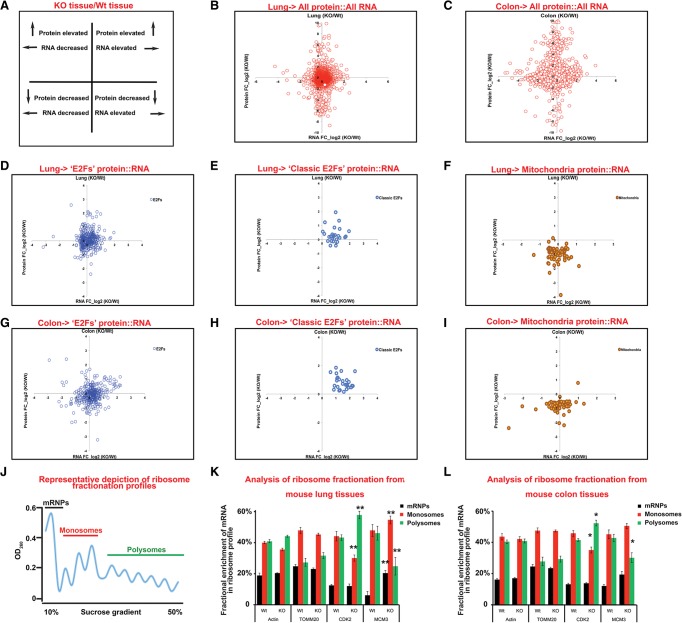
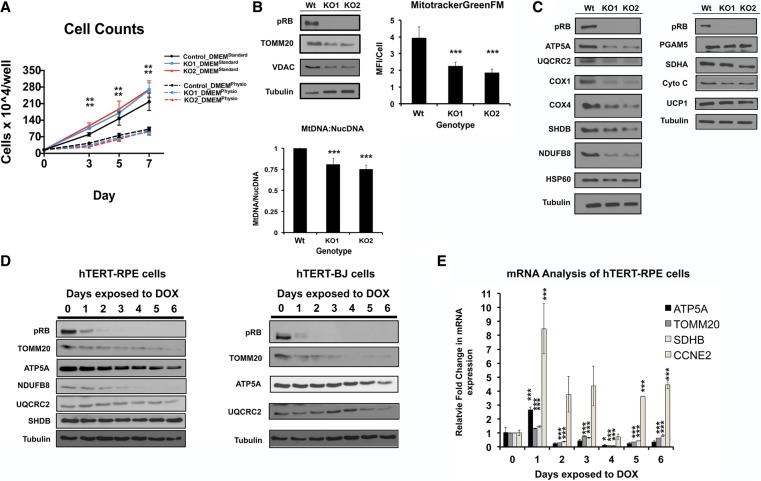
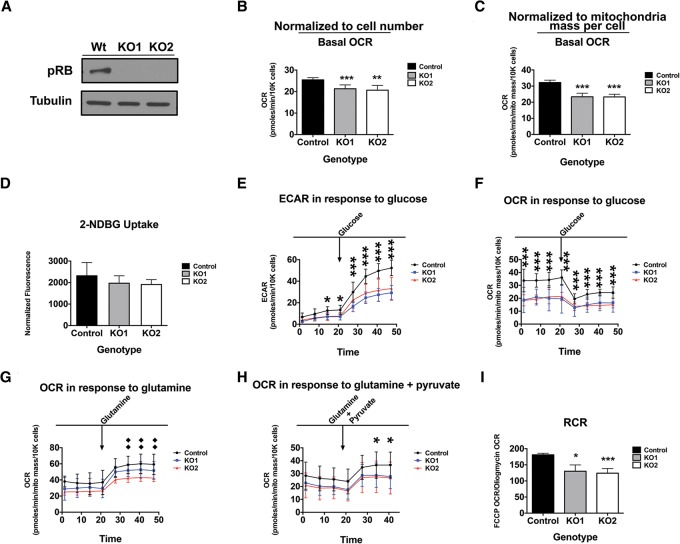
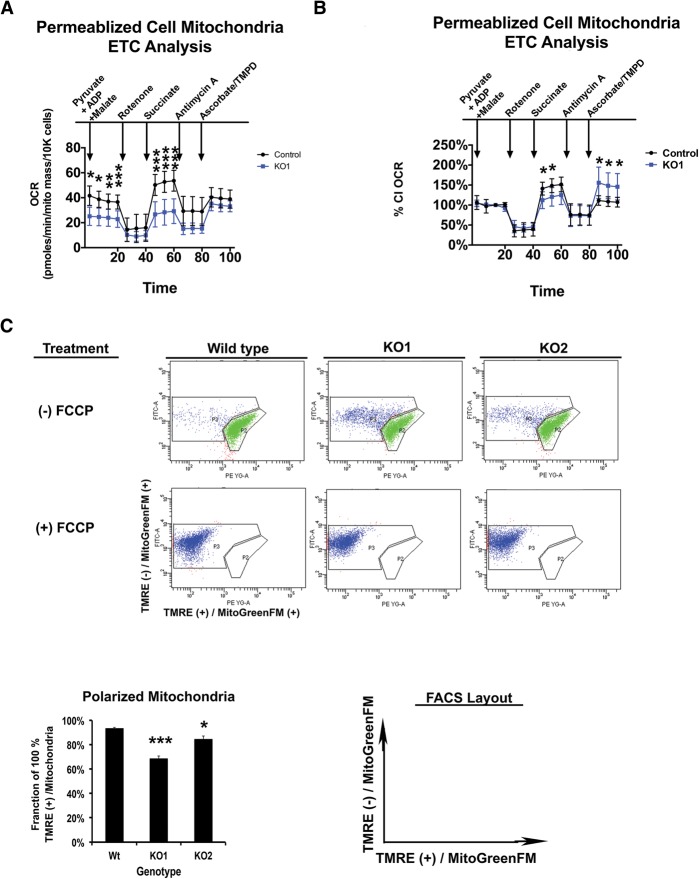
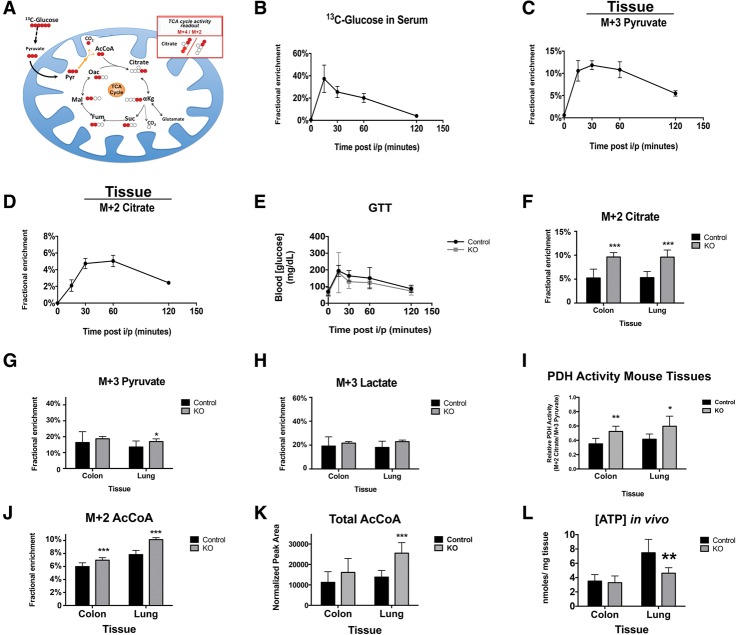
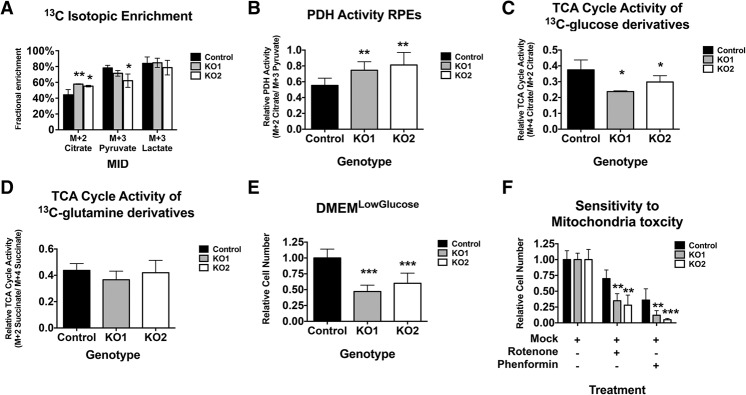
The retinoblastoma tumor suppressor (pRb) protein associates with chromatin and regulates gene expression. Numerous studies have identified Rb-dependent RNA signatures, but the proteomic effects of Rb loss are largely unexplored. We acutely ablated Rb in adult mice and conducted a quantitative analysis of RNA and proteomic changes in the colon and lungs, where Rb(KO) was sufficient or insufficient to induce ectopic proliferation, respectively. As expected, Rb(KO) caused similar increases in classic pRb/E2F-regulated transcripts in both tissues, but, unexpectedly, their protein products increased only in the colon, consistent with its increased proliferative index. Thus, these protein changes induced by Rb loss are coupled with proliferation but uncoupled from transcription. The proteomic changes in common between Rb(KO) tissues showed a striking decrease in proteins with mitochondrial functions. Accordingly, RB1 inactivation in human cells decreased both mitochondrial mass and oxidative phosphorylation (OXPHOS) function. RB(KO) cells showed decreased mitochondrial respiratory capacity and the accumulation of hypopolarized mitochondria. Additionally, RB/Rb loss altered mitochondrial pyruvate oxidation from (13)C-glucose through the TCA cycle in mouse tissues and cultured cells. Consequently, RB(KO) cells have an enhanced sensitivity to mitochondrial stress conditions. In summary, proteomic analyses provide a new perspective on Rb/RB1 mutation, highlighting the importance of pRb for mitochondrial function and suggesting vulnerabilities for treatment.

Keywords: 13C-glucose; OXPHOS; metabolism; mitochondria; pRB; proteomics.


Figures

Figure 1.
Figure 1.
Elevated E2F-regulated mRNAs are present independent of ectopic proliferation in Rbko tissues. qPCR analysis of select E2F-driven mRNAs following tamoxifen shows loss of Rb in the adult mouse colon (A) and lung (B). Ectopic mKi67 expression in the RbKO colon (C) but not in the lung (D). Bar, 20 µm. (E,F) Quantification of the percentage of mKi67-positive cells in the top cell positions of the colonic crypt or in the lung following acute excision of Rb. n = 300–600 cells counted per tissue per mouse; seven mice. (G,H) Quantification of the percentage of MCM2-positive cells in the top cell positions of the colonic crypt or in the lung following acute excision of Rb. n = 300–600 cells counted per tissue per mouse; seven mice. Error bars are the 95% confidence intervals. Statistical significances are as follows: (***) P < 0.001. Statistical differences are between RbKO and RbWt animals.
Figure 2.
Figure 2.
Loss of Rb leads to distinct changes in proteins and transcripts. (A) Key of the plots in BI. (BI) RNA and protein levels were normalized, and a fold change of RbKO/RbWt was taken and log2 transformed (0 value = ratio of 1/1). Eight-thousand-sixty-three gene products (RNA and protein) were correlated from the effects of Rb loss. The data shown are from four fold change ratios of biological replicates. Proteomics were from six mice. Little correlation between RNA and protein was detected in either the lung (B) or the colon (C). (D,E) E2F targets (blue) show increased RNA but little correlation in protein in the lung. (F) Mitochondria proteins decrease in the RbKO lung. (G,H) E2F targets (blue) show increased RNA and a correlation in protein in the colon. (I) Mitochondria proteins decrease in the RbKO colon. (J) Representative ribosome fractionation plot from the RbWt lung. (K,L) qPCR analysis of ribosomal fractions of specific genes from the colon and lung upon loss of Rb. Error bars are the 95% confidence intervals. Statistical significances are shown as follows: (*) P < 0.05; (**) P< 0.02. Statistical differences are between RbKO and RbWt animals.
Figure 3.
Figure 3.
Mitochondrial mass is decreased in RBKO RPE cells. (A) RB1−/− (RBKO) RPE cells show enhanced cell proliferation in standard DMEM culture medium. n = 4 per time point. (B) Western blot analysis reveals that RBKO cells have less TOMM20 and VDAC1, reduced mean fluorescence intensity (MFI) per cell of the MitoTrackerGreenFM (MFI per cell) (n = 550–800 cells per genotype), and a decreased ratio of mitochondria DNA (mtDNA) to nuclear DNA (NucDNA), n = 6 per genotype). (C) Western blot analysis confirms that RBKO cells have negative effects on specific OXPHOS proteins. (D) The time course shows different kinetics in the drops in mitochondria proteins following pRB depletion in RPE and BJ cell lines. (E) qPCR analysis to complement the time-course analysis of protein levels in D. The mRNA changes shown do not correspond directly to protein disappearance. Error bars are the 95% confidence intervals. Statistical significances are as follows: (*) P < 0.05; (**) P < 0.02; (***) P < 0.001. Statistical differences are between the effects from RB−/− compared with control cells.
Figure 4.
Figure 4.
Loss of RB1 leads to decreased respiration and mitochondria activity. (AC) Loss of pRb decreases OCR independently of mitochondrial mass differences. (B,C) RBKO RPE cells. n = 14, repeated twice. (D) Loss of pRB in RPE cells caused little to no difference in 2-NDBG uptake. (E) Extracellular acidification rate (ECAR) measurement in response to glucose challenge. (FH) OCR measurements in response to glucose (F), glutamine (G), or glutamine + pyruvate (H). For the ECAR and OCR analysis in EH, n = 14 replicates, repeated twice. (I) The respiratory control ratio is decreased in RBKO RPE cells. n = 14 replicates, repeated twice. Error bars are the 95% confidence intervals. Statistical significances are as follows: (*) P < 0.05; (**) P < 0.02; (***) P < 0.001. Statistical differences are between the effects from RB−/− compared with control cells.
Figure 5.
Figure 5.
Decreased mitochondria capacity and hypopolarized mitochondria are features of RBKO cells. (A,B) Permeablized cell mitochondria respiration assays. (A) RBKO RPE cells have decreased capacity of CI and CII. (B) Data from A normalized to the CI OCR for each genotype. RBKO RPE cells have decreased CII activity and increased CIV capacity. (C) Analysis of mitochondria membrane potential as shown by TMRE and MitoTrackerGreenFM stainings. The labeled axes represent the channels used to gate samples for FACS analysis. The X-axis is cells positive (+) for maximum TMRE fluorescence and MitoTrackerGreenFM. The Y-axis is cells positive (+) for MitoTrackerGreenFM and showing reduced TMRE fluorescence. Bar graph of FACS plots. As a control, cells were treated with 20 μM FCCP (a mitochondrial membrane uncoupler). Error bars are the 95% confidence intervals. Statistical significances are as follows: (*) P < 0.05; (**) P < 0.02; (***) P < 0.001. Statistical differences are between the effects from RB1−/− compared with control cells.
Figure 6.
Figure 6.
In vivo 13C-glucose analysis of the effects of the loss of Rb on TCA cycle entry. (A) Cartoon of U13C-glucose fate mapping the TCA cycle through pyruvate oxidation. Red circles are 13C, and open circles are 12C. Pyruvate is completely comprised of 13C and is labeled M + 3. (AcCoA) Acetyl-CoA; (αKG) α-ketoglutarate; (CO2) carbon dioxide; (Suc) succinate; (Mal) malate; (Fum) fumarate; (Oac) oxaloacetate; (Pyr) ppyruvate. (BD) Time-course analysis of the kinetics of the U13C-glucose bolus in the blood and tissues of control mice. Shown is the fractional enrichment of U13C-glucose in the blood or tissues at the indicated time points after intraperitoneal injection of the U13C-glucose. n = 9–24 mice per time point. (B) Kinetics of the clearance of U13C-glucose from the blood. (C,D) Kinetics of the oxidation of U13C-glucose into downstream glycolytic (M + 3 pyruvate) and TCA cycle (M + 2 citrate) intermediates in adult mouse tissues. The data trend is representative of colon and lung tissues; shown are data of colon samples. (E) GTT shows similar glucose absorption between genotypes in mice after 96 h following Rb loss. n = 4 mice per genotype. (FH) Rb loss elevates 13C-glucose-derived citrate in both the colon and the lung but does not affect 13C-glucose-derived pyruvate or lactate. n = 8 mice. (I) Ratio of PDH activity (M + 2 citrate/M + 3 pyruvate). Rb loss elevates PDH activity in both the colon and the lung. (J,K) Loss of Rb increases enrichment of glucose-derived acetyl-CoA and increases total pools of acetyl-CoA. (L) Loss of Rb impacts ATP levels in vivo. Error bars are the 95% confidence intervals. Statistical significances are as follows: (*) P < 0.05; (**) P < 0.02; (***) P < 0.001. Statistical differences are between the effects from Rb−/− compared with control cells.
Figure 7.
Figure 7.
RBKO RPE cells have decreased TCA cycle activity and enhanced sensitivity to mitochondrial stress. (A) RB loss elevates 13C-glucose-derived citrate in RPE cells but has little to no effect on the rates of 13C-glucose-derived pyruvate or lactate. n = 6. (B) The ratio of PDH activity (M + 2 citrate/M + 3 pyruvate). RB loss elevates PDH activity in RPE cells. (C,D) RBKO RPE cells show reduced TCA cycle oxidation of glucose (C) or glutamine (D). (E,F) RBKO RPE cells are growth-impaired over 72 h when cultured in low-glucose conditions (E) and show significantly enhanced sensitivity to 500 pM rotenone and 10 μM phenformin (F). n = 12 samples per genotype, repeated twice. Error bars are the 95% confidence intervals. Statistical significances are as follows: (*) P < 0.05; (**) P < 0.02; (***) P < 0.001. Statistical differences are between RBKO and RBWt except in F, where it is mock compared with drug treatment.

References

    1. Bandara LR, Buck VM, Zamanian M, Johnston LH, La Thangue NB. 1993. Functional synergy between DP-1 and E2F-1 in the cell cycle-regulating transcription factor DRTF1/E2F. EMBO J 12: 4317–4324. - PMC - PubMed
    1. Bartesaghi S, Graziano V, Galavotti S, Henriquez NV, Betts J, Saxena J, Minieri V, A D, Karlsson A, Martins LM, et al. 2015. Inhibition of oxidative metabolism leads to p53 genetic inactivation and transformation in neural stem cells. Proc Natl Acad Sci 112: 1059–1064. - PMC - PubMed
    1. Berkers CR, Maddocks OD, Cheung EC, Mor I, Vousden KH. 2013. Metabolic regulation by p53 family members. Cell Metab 18: 617–633. - PMC - PubMed
    1. Birsoy K, Possemato R, Lorbeer FK, Bayraktar EC, Thiru P, Yucel B, Wang T, Chen WW, Clish CB, Sabatini DM. 2014. Metabolic determinants of cancer cell sensitivity to glucose limitation and biguanides. Nature 508: 108–112. - PMC - PubMed
    1. Blanchet E, Annicotte JS, Lagarrigue S, Aguilar V, Clape C, Chavey C, Fritz V, Casas F, Apparailly F, Auwerx J, et al. 2011. E2F transcription factor-1 regulates oxidative metabolism. Nature Cell Biol 13: 1146–1152. - PMC - PubMed

Publication types

Substances